Download as PDF, PPTX


![Creating the sample dataset in
MATLAB
Copy and Paste this:
>> Price = [0;100;200;300];
>> Responses = [304;336;215;145];
Two vectors are now in the Workspace
Double click](https://image.slidesharecdn.com/matlabformarketingpeople-140310114034-phpapp02/75/Matlab-for-marketing-people-8-2048.jpg)

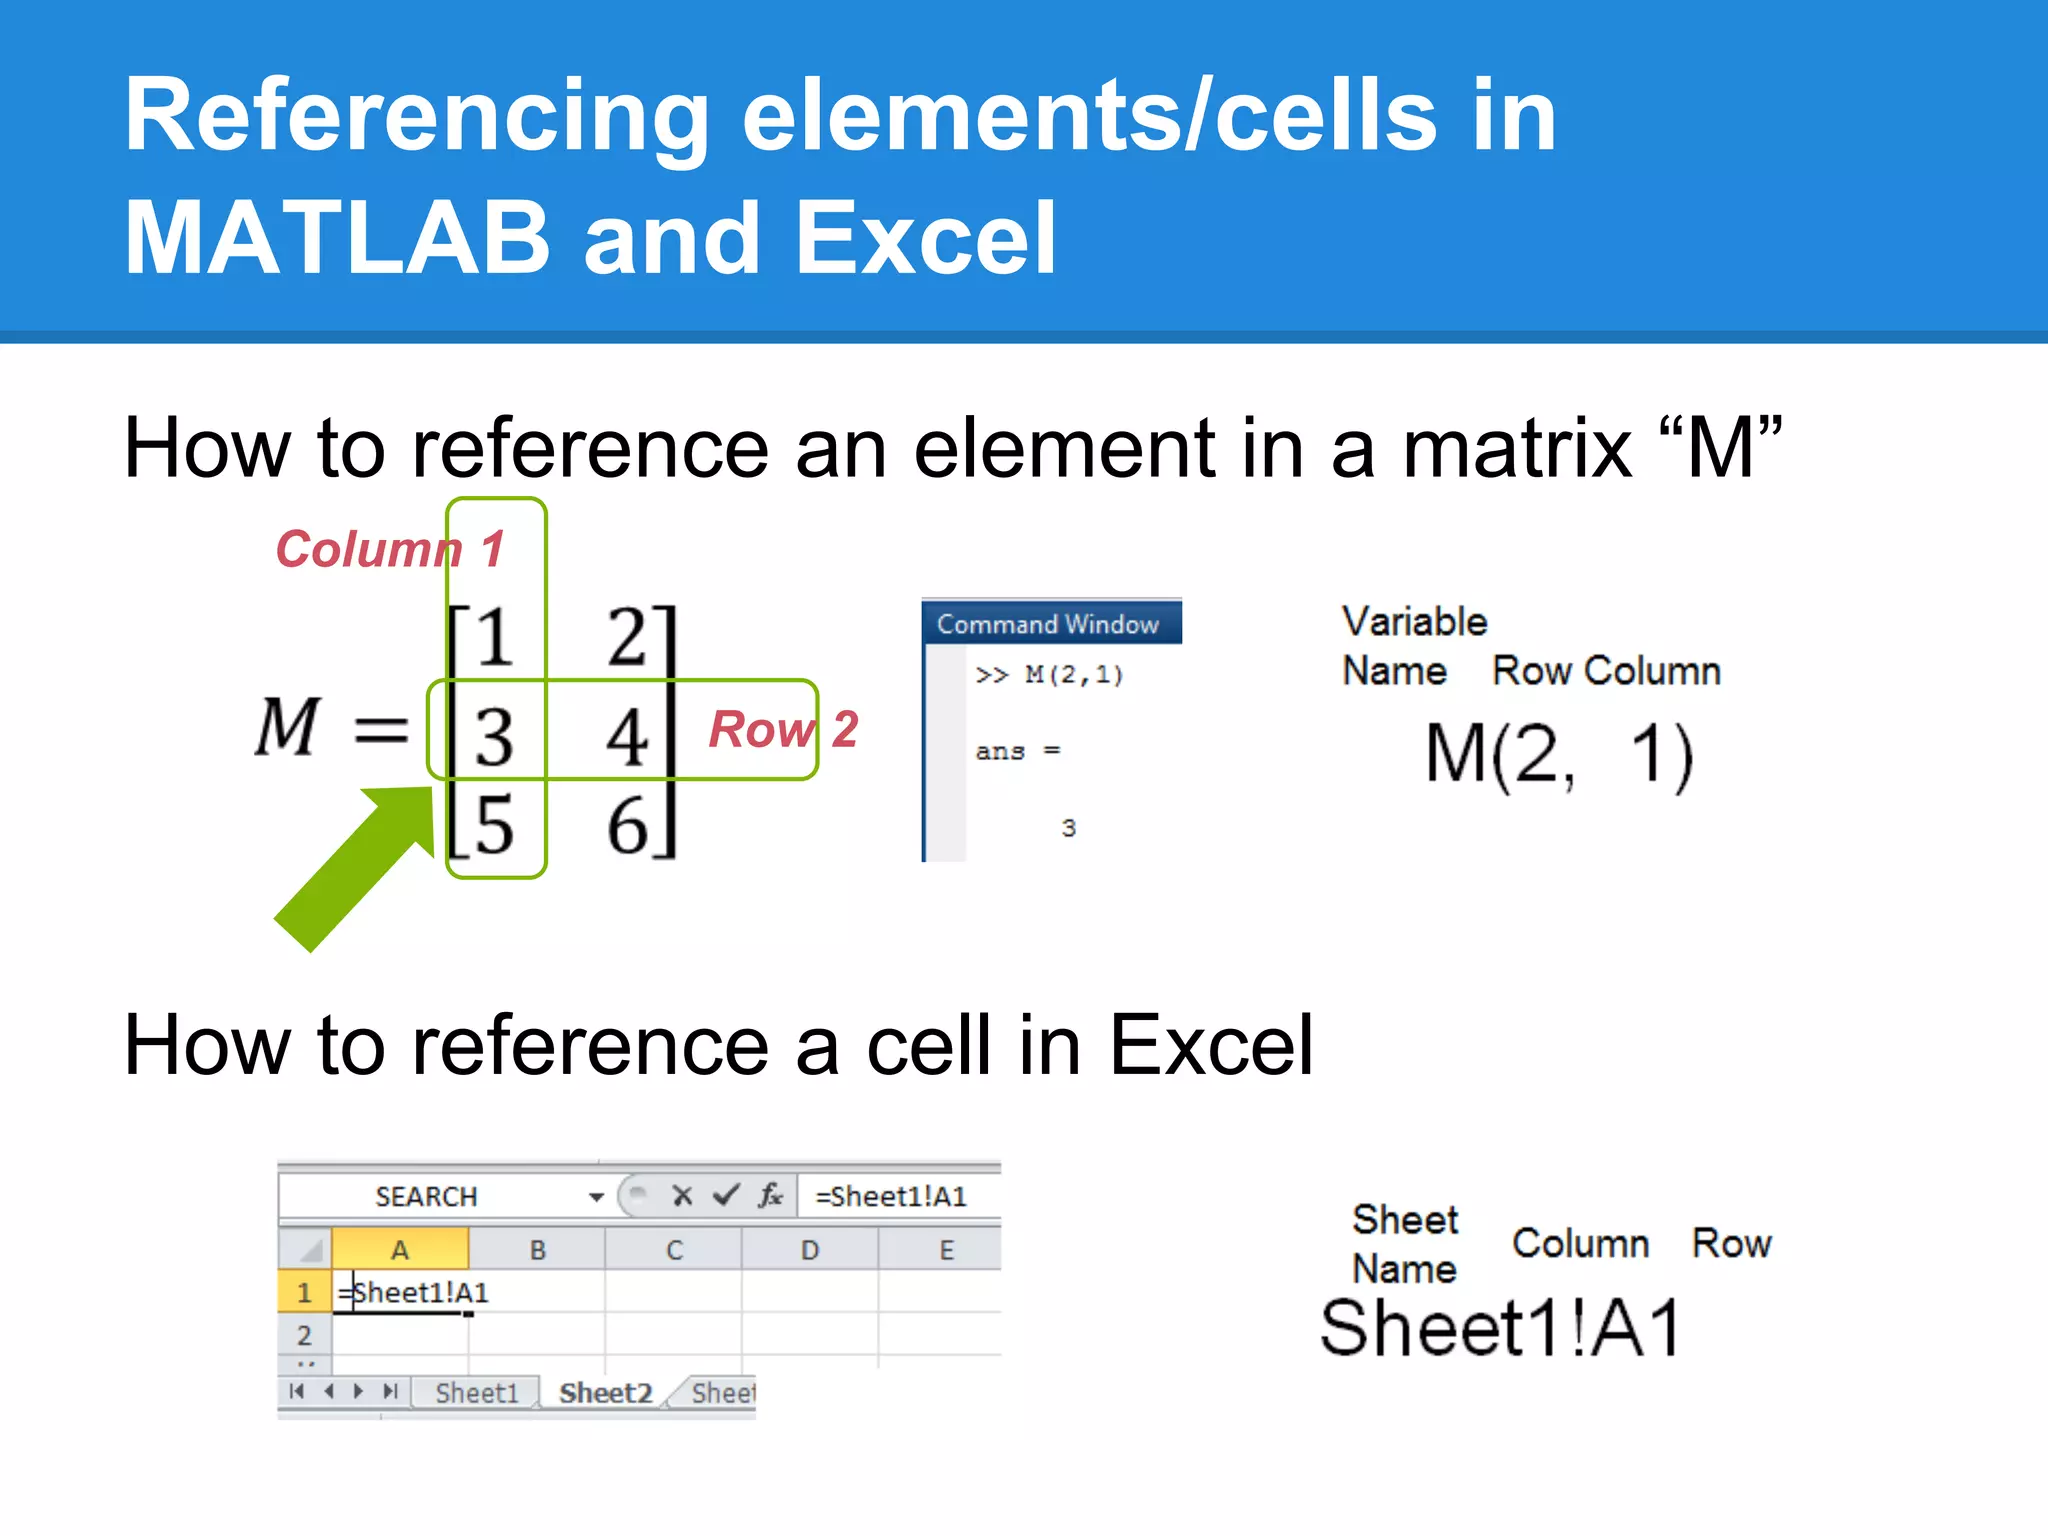


![What functions do you use in Excel
often?
Sum, Average, Count, Max, Min?
How do you do these in MATLAB?
First, create a new matrix:
>> M = [1, 2; 3, 4; 5, 6]
● Use [ ] to start and end the matrix or vector
● Use comma or space to separate elements
● Use semicolons to start a new row
● Content will be displayed when you enter this
without an ending semicolon.](https://image.slidesharecdn.com/matlabformarketingpeople-140310114034-phpapp02/75/Matlab-for-marketing-people-13-2048.jpg)


![Using Matrices and Vectors
Matrix Addition/Subtraction
First, create new matrices:
>> A = [3,8;1,7;1,3];
>> B = [9,4;1,7;4,8];
How do you do A+B? By adding/subtracting
corresponding elements.
Just A+B or A-B in
MATLAB
The dimensions must match between two matrices.](https://image.slidesharecdn.com/matlabformarketingpeople-140310114034-phpapp02/75/Matlab-for-marketing-people-19-2048.jpg)


![Using Matrices and Vectors
Matrix Vector Multiplication
First, create a new vector:
>> B = [2;3];
How do you do A×B? Go row by row with A:
Row 1: 3×2+8×3=6+24=30
Row 2: 1×2+7×3=2+21=23
Row 3: 1×2+3×3=2+ 9=11
It’s simple in MATLAB](https://image.slidesharecdn.com/matlabformarketingpeople-140310114034-phpapp02/75/Matlab-for-marketing-people-26-2048.jpg)


![Linear Equation
How to do this in MATLAB
To add the intercept term to x:
1. ones(3,1) creates a 3x1 vector of 1’s – same
as [1;1;1]
2. Concatenate it with x using [x ones(3,1)]
3. Now you are ready to apply multiplication
>> y = [x ones(3,1)]*p
This makes the code more general and run faster.](https://image.slidesharecdn.com/matlabformarketingpeople-140310114034-phpapp02/75/Matlab-for-marketing-people-29-2048.jpg)
![Using Matrices and Vectors
Matrix Matrix Multiplication
First, create a new matrix:
>> B = [2,1;3,4];
How do you do A×B? Break it down to matrix
vector combinations:
First
Then
In MATLAB,
same as
before
>> A*B](https://image.slidesharecdn.com/matlabformarketingpeople-140310114034-phpapp02/75/Matlab-for-marketing-people-30-2048.jpg)


![Price modeling example
Estimate parameters from the data
You can apply linear regression to estimate the
parameters α and β, using polyfit (n=1 for
linear).
>> [p_fit, Stats] = polyfit(Price,subscribers,1)
α = -0.0029
β = 0.9854
Pricing Model: y = -0.0029x+0.9584](https://image.slidesharecdn.com/matlabformarketingpeople-140310114034-phpapp02/75/Matlab-for-marketing-people-34-2048.jpg)
![Price modeling example
Plot the estimate against the data
Compare the estimate to the data
>> y_fit =[Price ones(4,1)]*p_fit'
>> plot(Price,subscribers)
>> hold on
>> plot(Price,y_fit,'r')
>> hold off
The estimate fits well with the data! So our
pricing model is fairly decent.](https://image.slidesharecdn.com/matlabformarketingpeople-140310114034-phpapp02/75/Matlab-for-marketing-people-35-2048.jpg)

![Appendix I
Summary of the code used
Price modeling example
>> Price = [0;100;200;300];
>> Responses = [304;336;215;145];
>> shares = Responses/sum(Responses);
>> subscribers = cumsum(flipud(shares));
>> subscribers = flipud(subscribers);
>> plot(Price,subscribers)
>> [p_fit, Stats] = polyfit(Price,subscribers,1);
>> y_fit =[Price ones(4,1)]*p_fit';
>> hold on
>> plot(Price,y_fit,'r')
>> hold off](https://image.slidesharecdn.com/matlabformarketingpeople-140310114034-phpapp02/75/Matlab-for-marketing-people-37-2048.jpg)


This document provides an introduction to MATLAB for people working in marketing. It explains that MATLAB is useful for analyzing large or complex datasets, as it can handle data more efficiently than Excel. The document demonstrates how to use MATLAB through a example of modeling mobile app subscription prices and demand based on survey data. Key functions and operations in MATLAB like vectors, matrices, element referencing, basic math operations, plotting, and linear regression are covered. The example shows how to estimate a linear pricing model that fits the sample data well.