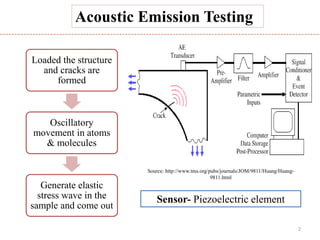
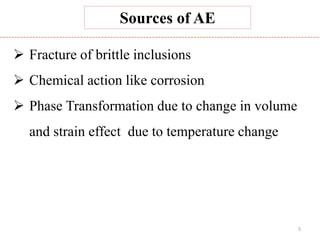
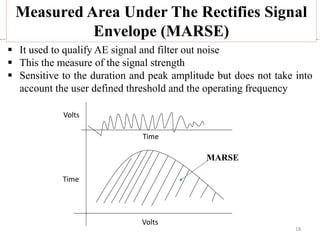
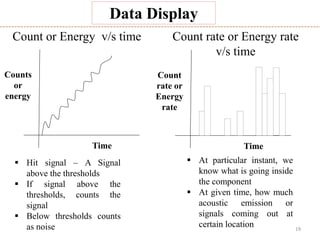
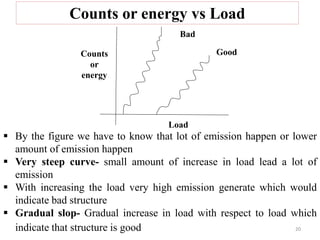
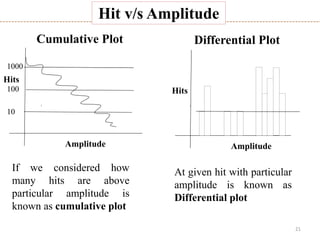
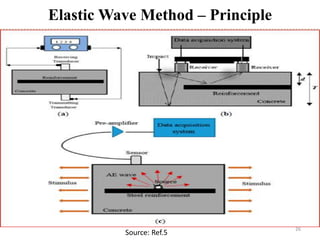
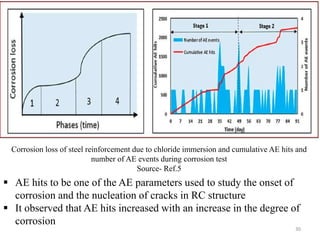
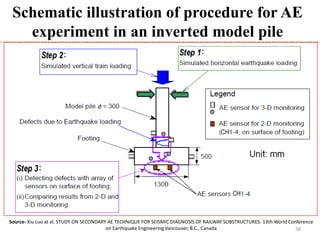
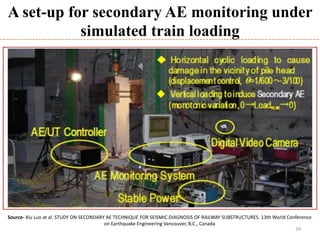
This document provides an overview of acoustic emission testing and its applications presented by Arvind Vishavkarma under the guidance of Dr. Sudhir Mishra at the Indian Institute of Technology Kanpur. It discusses acoustic emission sources in materials like metals, composites, and concrete due to cracking, fracture, phase transformations, and corrosion. Parameters of acoustic emission signals like amplitude, duration, rise time, and counts are described. Techniques for acoustic emission data analysis including source location and load monitoring are summarized. Finally, applications of acoustic emission testing for corrosion monitoring in reinforced concrete structures are briefly outlined.
![9
Stress change,
where,
I = n × n square matrix
c = stiffness tensor
c + ∆𝑐 = stiffness tensor of product phase
∆𝑐 = change in the stiffness
𝛽
∗
= unconstrained shape
𝛽 𝑜 = pre – existing stress or residual stress
D = shape matrix
V = volume of transformed phase
If the stiffness ∆𝒄 << c and there is no residual strength that means 𝛽 𝑜 = 0
Change in stress will depend on shape change
(transformation one material another material) , c is the
constant which is the material property
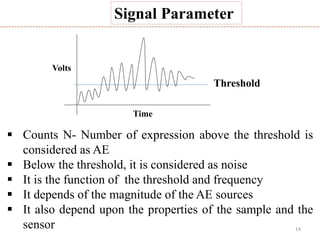
This parameter will control the intensity or the level of
acoustic emission
∆𝜎 𝑡 = 𝑐𝛽
∗
𝑉 𝑡
∆𝜎(𝑡) = 𝐼 + ∆𝑐𝐷
−
[(c + ∆𝑐)𝛽
∗
−∆𝑐𝛽 𝑜] 𝑉(𝑡)](https://image.slidesharecdn.com/acousticemission-180517104406/85/Acoustic-emission-9-320.jpg)


![SENTRO - Acoustic Emission Presentation [2016]](https://cdn.slidesharecdn.com/ss_thumbnails/98218305-2f60-4e90-9827-bdda4184e85d-170104020510-thumbnail.jpg?width=640&height=640&fit=bounds)


