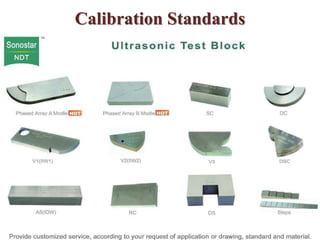
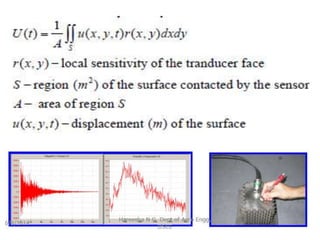
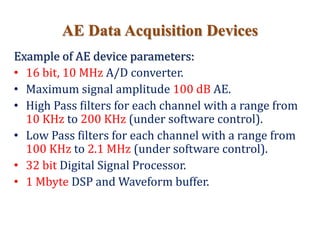
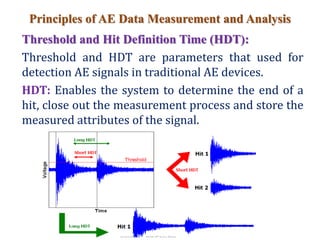
The document provides a detailed syllabus for Ultrasonic Testing (UT) and Acoustic Emission (AE) techniques, covering principles, instrumentation, data representation, and various ultrasonic applications. It discusses sound wave properties, testing techniques, and the use of different types of transducers and testing equipment relevant to flaw detection, thickness gauging, and quality assurance in mechanical engineering. Additionally, it highlights the importance of calibration standards and the diverse applications of ultrasonic inspection in various industries.

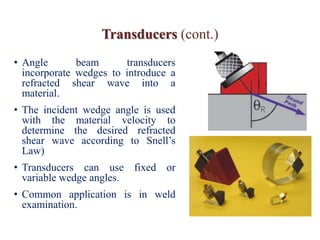
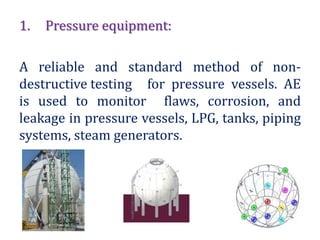
![Applications
• In field inspection
• Structural integrity evaluation
• Vessels testing [ambient, hot or cryogenic, metallic and FRP,
spheres]
• Tank bottom testing
• Nuclear components inspection (valves, lift beams, steam
lines)
• Corrosion detection
• Pipeline testing
• Railroad tank car testing
• Tube trailers & high pressure gas cylinders
• Aging aircraft evaluation
• Advanced materials testing (composites, ceramics)
• Production quality control
• Rocket motor testing.](https://image.slidesharecdn.com/unitiv-200522154813/85/ULTRASONIC-TESTING-UT-ACOUSTIC-EMISSION-AE-89-320.jpg)