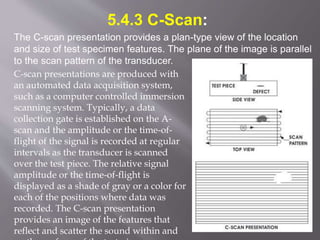
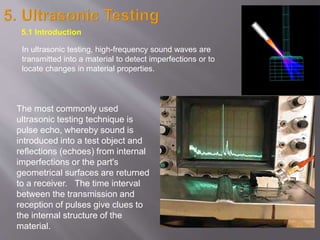
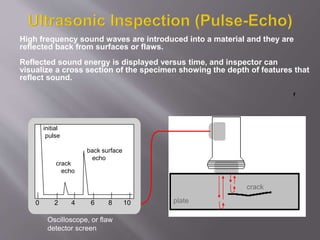
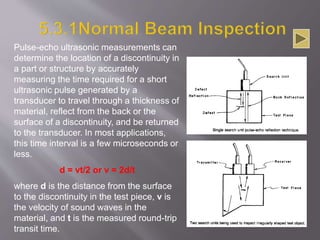
The most commonly used
ultrasonic testing technique is
pulse echo, whereby sound is
introduced into a test object and
reflections (echoes) from internal
imperfections or the part's
geometrical surfaces are returned
to a receiver. The time interval
between the transmission and
reception of pulses give clues to
the internal structure of the
material.
In ultrasonic testing, high-frequency sound waves are
transmitted into a material to detect imperfections or to
locate changes in material properties.
5.1 Introduction
High frequency sound waves are introduced into a material and they are
reflected back from surfaces or flaws.
Reflected sound energy is displayed versus time, and inspector can
visualize a cross section of the specimen showing the depth of features that
reflect sound.
f
plate
crack
0 2 4 6 8 10
initial
pulse
crack
echo
back surface
echo
Oscilloscope, or flaw
detector screen
 Piezoelectric transducers are used for
converting electrical pulses to mechanical
vibrations and vice versa
 Commonly used piezoelectric materials are
quartz, Li2SO4, and polarized ceramics such
as BaTiO3 and PbZrO3.
 Usually the transducers generate ultrasonic
waves with frequencies in the range 2.25 to
5.0 MHz
 Longitudinal or
compression
waves
 Shear or
transverse waves
 Surface or
Rayleigh waves
 Plate or Lamb
waves
Wave Propagation Direction
SymmetricalAsymmetrical
 Longitudinal waves
 Similar to audible sound
waves
 the only type of wave
which can travel through
liquid
 Shear waves
 generated by passing the
ultrasonic beam through
the material at an angle
 Usually a plastic wedge is
used to couple the
transducer to the material
 Surface waves
 travel with little attenuation in the direction of
propagation but weaken rapidly as the wave
penetrates below the material surface
 particle displacement follows an elliptical orbit
 Lamb waves
 observed in relatively thin plates only
 velocity depends on the thickness of the material
and frequency
5.2 Equipment & Transducers
5.2.1 Piezoelectric Transducers
The active element of most acoustic
transducers is piezoelectric ceramic. This
ceramic is the heart of the transducer which
converts electrical to acoustic energy, and
vice versa.
A thin wafer vibrates with a wavelength that
is twice its thickness, therefore, piezoelectric
crystals are cut to a thickness that is 1/2 the
desired radiated wavelength. Optimal
impedance matching is achieved by a
matching layer with thickness 1/4
wavelength.
Direction of wave
propagation
Characteristics of Piezoelectric Transducers
• Immersion: do not contact the
component. These transducers
are designed to operate in a
liquid environment and all
connections are watertight.
Wheel and squirter transducers
are examples of such immersion
applications.
Transducers are classified into groups according to the application.
Contact type
• Contact: are used for direct
contact inspections. Coupling
materials of water, grease, oils, or
commercial materials are used to
smooth rough surfaces and
prevent an air gap between the
transducer and the component
inspected.
immersion
• Dual Element: contain two independently
operating elements in a single housing.
One of the elements transmits and the
other receives. Dual element transducers
are very useful when making thickness
measurements of thin materials and when
inspecting for near surface defects.
Dual element
• Angle Beam: and wedges are typically
used to introduce a refracted shear wave
into the test material. Transducers can be
purchased in a variety of fixed angles or in
adjustable versions where the user
determines the angles of incident and
refraction. They are used to generate
surface waves for use in detecting defects
on the surface of a component.
Angle beam
5.2.2 Electromagnetic Acoustic Transducers (EMATs)
When a wire is placed near the surface of an electrically conducting object
and is driven by a current at the desired ultrasonic frequency, eddy currents
will be induced in a near surface region of the object. If a static magnetic
field is also present, these eddy currents will experience Lorentz forces of
the form
F = J x B
F is a body force per unit volume, J is the induced dynamic current density,
and B is the static magnetic induction.
EMAT: Couplant free transduction allows operation without contact at
elevated temperatures and in remote locations. The coil and magnet
structure can also be designed to excite complex wave patterns and
polarization's that would be difficult to realize with fluid coupled
piezoelectric probes (Lamb and Shear waves). In the inference of material
properties from precise velocity or attenuation measurements, use of
EMATs can eliminate errors associated with couplant variation, particularly
in contact measurements.
 Fluid couplant or a fluid bath is needed for
effective transmission of ultrasonic from the
transducer to the material
 Straight beam contact search unit project a
beam of ultrasonic vibrations perpendicular to
the surface
 Angle beam contact units send ultrasonic
beam into the test material at a predetermined
angle to the surface
Pulse-echo ultrasonic measurements can
determine the location of a discontinuity in
a part or structure by accurately
measuring the time required for a short
ultrasonic pulse generated by a
transducer to travel through a thickness of
material, reflect from the back or the
surface of a discontinuity, and be returned
to the transducer. In most applications,
this time interval is a few microseconds or
less.
d = vt/2 or v = 2d/t
where d is the distance from the surface
to the discontinuity in the test piece, v is
the velocity of sound waves in the
material, and t is the measured round-trip
transit time.
 Can be used for
testing flat sheet and
plate or pipe and
tubing
 Angle beam units are
designed to induce
vibrations in Lamb,
longitudinal, and
shear wave modes
Angle Beam Transducers and wedges are typically used to introduce a refracted
shear wave into the test material. An angled sound path allows the sound beam to
come in from the side, thereby improving detectability of flaws in and around
welded areas.
The geometry of the sample below allows the sound beam to be reflected
from the back wall to improve detectability of flaws in and around welded
areas.
Crack Tip Diffraction
When the geometry of the part is relatively uncomplicated and the orientation of a
flaw is well known, the length (a) of a crack can be determined by a technique
known as tip diffraction. One common application of the tip diffraction technique is
to determine the length of a crack originating from on the backside of a flat plate.
When an angle beam
transducer is scanned over
the area of the flaw, the
principle echo comes from
the base of the crack to
locate the position of the
flaw (Image 1). A second,
much weaker echo comes
from the tip of the crack and
since the distance traveled
by the ultrasound is less, the
second signal appears earlier
in time on the scope (Image
Crack height (a) is a function of the ultrasound
velocity (v) in the material, the incident angle
(2) and the difference in arrival times between
the two signal (dt).
The variable dt is really the difference in time
but can easily be converted to a distance by
dividing the time in half (to get the one-way
travel time) and multiplying this value by the
velocity of the sound in the material. Using
trigonometry an equation for estimating crack
height from these variables can be derived.
 With increased
incident angle so
that the refracted
angle is 90°
 Surface waves are
influenced most by
defects close to the
surface
 Will travel along
gradual curves with
little or no reflection
from the curve
5.4 Data Presentation
Ultrasonic data can be collected and displayed
in a number of different formats. The three most
common formats are know in the NDT world as
A-scan, B-scan and C-scan presentations.
Each presentation mode provides a different
way of looking at and evaluating the region of
material being inspected. Modern computerized
ultrasonic scanning systems can display data in
all three presentation forms simultaneously
5.4.1 A-Scan
The A-scan presentation displays the amount of received ultrasonic energy as a
function of time. The relative amount of received energy is plotted along the vertical
axis and elapsed time (which may be related to the sound energy travel time within
the material) is display along the horizontal axis.
Relative discontinuity size
can be estimated by
comparing the signal
amplitude obtained from an
unknown reflector to that
from a known reflector.
Reflector depth can be
determined by the position
of the signal on the
horizontal sweep.
The B-scan presentations is a profile (cross-sectional) view of the a
test specimen. In the B-scan, the time-of-flight (travel time) of the
sound energy is displayed along the vertical and the linear position of
the transducer is displayed along the horizontal axis. From the B-
scan, the depth of the reflector and its approximate linear dimensions
in the scan direction can be determined.
5.4.2 B-Scan
The B-scan is typically
produced by establishing a
trigger gate on the A-scan.
Whenever the signal intensity
is great enough to trigger the
gate, a point is produced on
the B-scan. The gate is
triggered by the sound
reflecting from the backwall
of the specimen and by
smaller reflectors within the
material.
5.4.3 C-Scan:
The C-scan presentation provides a plan-type view of the location
and size of test specimen features. The plane of the image is parallel
to the scan pattern of the transducer.
C-scan presentations are produced with
an automated data acquisition system,
such as a computer controlled immersion
scanning system. Typically, a data
collection gate is established on the A-
scan and the amplitude or the time-of-
flight of the signal is recorded at regular
intervals as the transducer is scanned
over the test piece. The relative signal
amplitude or the time-of-flight is
displayed as a shade of gray or a color for
each of the positions where data was
recorded. The C-scan presentation
provides an image of the features that
reflect and scatter the sound within and
Gray scale image produced using
the sound reflected from the front
surface of the coin
Gray scale image produced using the
sound reflected from the back surface
of the coin (inspected from “heads” side)
High resolution scan can produce very detailed images. Both images were
produced using a pulse-echo techniques with the transducer scanned over
the head side in an immersion scanning system.

Ultasonic testing

  • 2.
    The most commonlyused ultrasonic testing technique is pulse echo, whereby sound is introduced into a test object and reflections (echoes) from internal imperfections or the part's geometrical surfaces are returned to a receiver. The time interval between the transmission and reception of pulses give clues to the internal structure of the material. In ultrasonic testing, high-frequency sound waves are transmitted into a material to detect imperfections or to locate changes in material properties. 5.1 Introduction
  • 3.
    High frequency soundwaves are introduced into a material and they are reflected back from surfaces or flaws. Reflected sound energy is displayed versus time, and inspector can visualize a cross section of the specimen showing the depth of features that reflect sound. f plate crack 0 2 4 6 8 10 initial pulse crack echo back surface echo Oscilloscope, or flaw detector screen
  • 4.
     Piezoelectric transducersare used for converting electrical pulses to mechanical vibrations and vice versa  Commonly used piezoelectric materials are quartz, Li2SO4, and polarized ceramics such as BaTiO3 and PbZrO3.  Usually the transducers generate ultrasonic waves with frequencies in the range 2.25 to 5.0 MHz
  • 5.
     Longitudinal or compression waves Shear or transverse waves  Surface or Rayleigh waves  Plate or Lamb waves Wave Propagation Direction SymmetricalAsymmetrical
  • 6.
     Longitudinal waves Similar to audible sound waves  the only type of wave which can travel through liquid  Shear waves  generated by passing the ultrasonic beam through the material at an angle  Usually a plastic wedge is used to couple the transducer to the material
  • 7.
     Surface waves travel with little attenuation in the direction of propagation but weaken rapidly as the wave penetrates below the material surface  particle displacement follows an elliptical orbit  Lamb waves  observed in relatively thin plates only  velocity depends on the thickness of the material and frequency
  • 8.
    5.2 Equipment &Transducers 5.2.1 Piezoelectric Transducers The active element of most acoustic transducers is piezoelectric ceramic. This ceramic is the heart of the transducer which converts electrical to acoustic energy, and vice versa. A thin wafer vibrates with a wavelength that is twice its thickness, therefore, piezoelectric crystals are cut to a thickness that is 1/2 the desired radiated wavelength. Optimal impedance matching is achieved by a matching layer with thickness 1/4 wavelength. Direction of wave propagation
  • 9.
    Characteristics of PiezoelectricTransducers • Immersion: do not contact the component. These transducers are designed to operate in a liquid environment and all connections are watertight. Wheel and squirter transducers are examples of such immersion applications. Transducers are classified into groups according to the application. Contact type • Contact: are used for direct contact inspections. Coupling materials of water, grease, oils, or commercial materials are used to smooth rough surfaces and prevent an air gap between the transducer and the component inspected. immersion
  • 10.
    • Dual Element:contain two independently operating elements in a single housing. One of the elements transmits and the other receives. Dual element transducers are very useful when making thickness measurements of thin materials and when inspecting for near surface defects. Dual element • Angle Beam: and wedges are typically used to introduce a refracted shear wave into the test material. Transducers can be purchased in a variety of fixed angles or in adjustable versions where the user determines the angles of incident and refraction. They are used to generate surface waves for use in detecting defects on the surface of a component. Angle beam
  • 11.
    5.2.2 Electromagnetic AcousticTransducers (EMATs) When a wire is placed near the surface of an electrically conducting object and is driven by a current at the desired ultrasonic frequency, eddy currents will be induced in a near surface region of the object. If a static magnetic field is also present, these eddy currents will experience Lorentz forces of the form F = J x B F is a body force per unit volume, J is the induced dynamic current density, and B is the static magnetic induction. EMAT: Couplant free transduction allows operation without contact at elevated temperatures and in remote locations. The coil and magnet structure can also be designed to excite complex wave patterns and polarization's that would be difficult to realize with fluid coupled piezoelectric probes (Lamb and Shear waves). In the inference of material properties from precise velocity or attenuation measurements, use of EMATs can eliminate errors associated with couplant variation, particularly in contact measurements.
  • 12.
     Fluid couplantor a fluid bath is needed for effective transmission of ultrasonic from the transducer to the material  Straight beam contact search unit project a beam of ultrasonic vibrations perpendicular to the surface  Angle beam contact units send ultrasonic beam into the test material at a predetermined angle to the surface
  • 13.
    Pulse-echo ultrasonic measurementscan determine the location of a discontinuity in a part or structure by accurately measuring the time required for a short ultrasonic pulse generated by a transducer to travel through a thickness of material, reflect from the back or the surface of a discontinuity, and be returned to the transducer. In most applications, this time interval is a few microseconds or less. d = vt/2 or v = 2d/t where d is the distance from the surface to the discontinuity in the test piece, v is the velocity of sound waves in the material, and t is the measured round-trip transit time.
  • 14.
     Can beused for testing flat sheet and plate or pipe and tubing  Angle beam units are designed to induce vibrations in Lamb, longitudinal, and shear wave modes Angle Beam Transducers and wedges are typically used to introduce a refracted shear wave into the test material. An angled sound path allows the sound beam to come in from the side, thereby improving detectability of flaws in and around welded areas.
  • 15.
    The geometry ofthe sample below allows the sound beam to be reflected from the back wall to improve detectability of flaws in and around welded areas.
  • 16.
    Crack Tip Diffraction Whenthe geometry of the part is relatively uncomplicated and the orientation of a flaw is well known, the length (a) of a crack can be determined by a technique known as tip diffraction. One common application of the tip diffraction technique is to determine the length of a crack originating from on the backside of a flat plate. When an angle beam transducer is scanned over the area of the flaw, the principle echo comes from the base of the crack to locate the position of the flaw (Image 1). A second, much weaker echo comes from the tip of the crack and since the distance traveled by the ultrasound is less, the second signal appears earlier in time on the scope (Image
  • 17.
    Crack height (a)is a function of the ultrasound velocity (v) in the material, the incident angle (2) and the difference in arrival times between the two signal (dt). The variable dt is really the difference in time but can easily be converted to a distance by dividing the time in half (to get the one-way travel time) and multiplying this value by the velocity of the sound in the material. Using trigonometry an equation for estimating crack height from these variables can be derived.
  • 18.
     With increased incidentangle so that the refracted angle is 90°  Surface waves are influenced most by defects close to the surface  Will travel along gradual curves with little or no reflection from the curve
  • 19.
    5.4 Data Presentation Ultrasonicdata can be collected and displayed in a number of different formats. The three most common formats are know in the NDT world as A-scan, B-scan and C-scan presentations. Each presentation mode provides a different way of looking at and evaluating the region of material being inspected. Modern computerized ultrasonic scanning systems can display data in all three presentation forms simultaneously
  • 20.
    5.4.1 A-Scan The A-scanpresentation displays the amount of received ultrasonic energy as a function of time. The relative amount of received energy is plotted along the vertical axis and elapsed time (which may be related to the sound energy travel time within the material) is display along the horizontal axis. Relative discontinuity size can be estimated by comparing the signal amplitude obtained from an unknown reflector to that from a known reflector. Reflector depth can be determined by the position of the signal on the horizontal sweep.
  • 21.
    The B-scan presentationsis a profile (cross-sectional) view of the a test specimen. In the B-scan, the time-of-flight (travel time) of the sound energy is displayed along the vertical and the linear position of the transducer is displayed along the horizontal axis. From the B- scan, the depth of the reflector and its approximate linear dimensions in the scan direction can be determined. 5.4.2 B-Scan The B-scan is typically produced by establishing a trigger gate on the A-scan. Whenever the signal intensity is great enough to trigger the gate, a point is produced on the B-scan. The gate is triggered by the sound reflecting from the backwall of the specimen and by smaller reflectors within the material.
  • 22.
    5.4.3 C-Scan: The C-scanpresentation provides a plan-type view of the location and size of test specimen features. The plane of the image is parallel to the scan pattern of the transducer. C-scan presentations are produced with an automated data acquisition system, such as a computer controlled immersion scanning system. Typically, a data collection gate is established on the A- scan and the amplitude or the time-of- flight of the signal is recorded at regular intervals as the transducer is scanned over the test piece. The relative signal amplitude or the time-of-flight is displayed as a shade of gray or a color for each of the positions where data was recorded. The C-scan presentation provides an image of the features that reflect and scatter the sound within and
  • 23.
    Gray scale imageproduced using the sound reflected from the front surface of the coin Gray scale image produced using the sound reflected from the back surface of the coin (inspected from “heads” side) High resolution scan can produce very detailed images. Both images were produced using a pulse-echo techniques with the transducer scanned over the head side in an immersion scanning system.