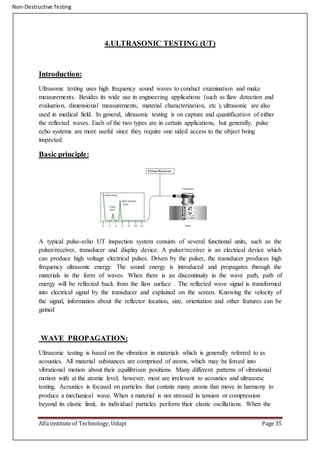
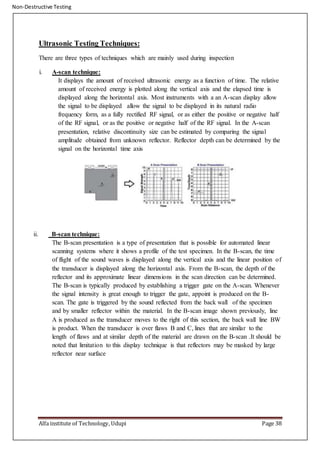
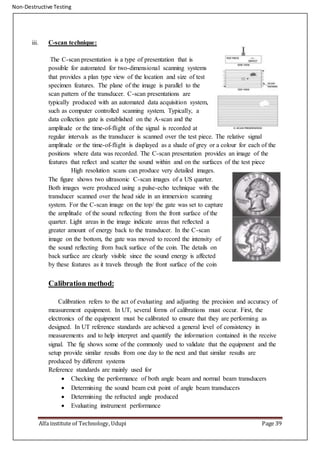
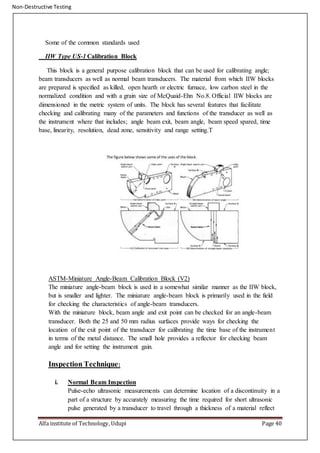
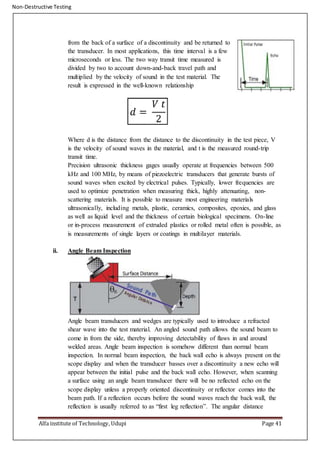
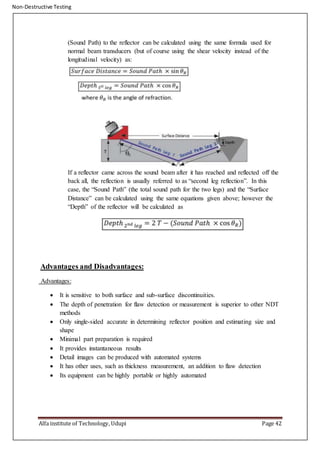
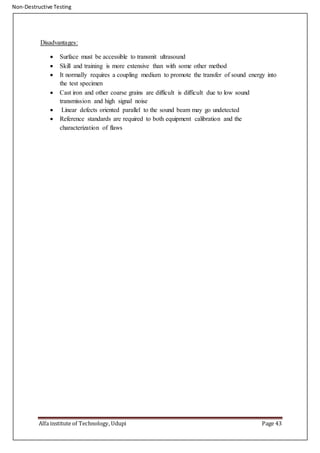
Ultrasonic testing uses high frequency sound waves to examine materials and detect flaws. It involves transmitting ultrasonic pulses into a material and analyzing the reflected waves. There are three main techniques: A-scans show reflected energy over time, B-scans show reflections along a line, and C-scans create images of internal features. Calibration is important using standards to validate equipment performance. Ultrasonic testing is widely used due to its sensitivity, ability to inspect thick materials, and ability to provide detailed images, though it requires transducer access and skilled technicians.