1) The document provides technical analysis of trends in the MCX gold, silver, copper, and crude oil markets.
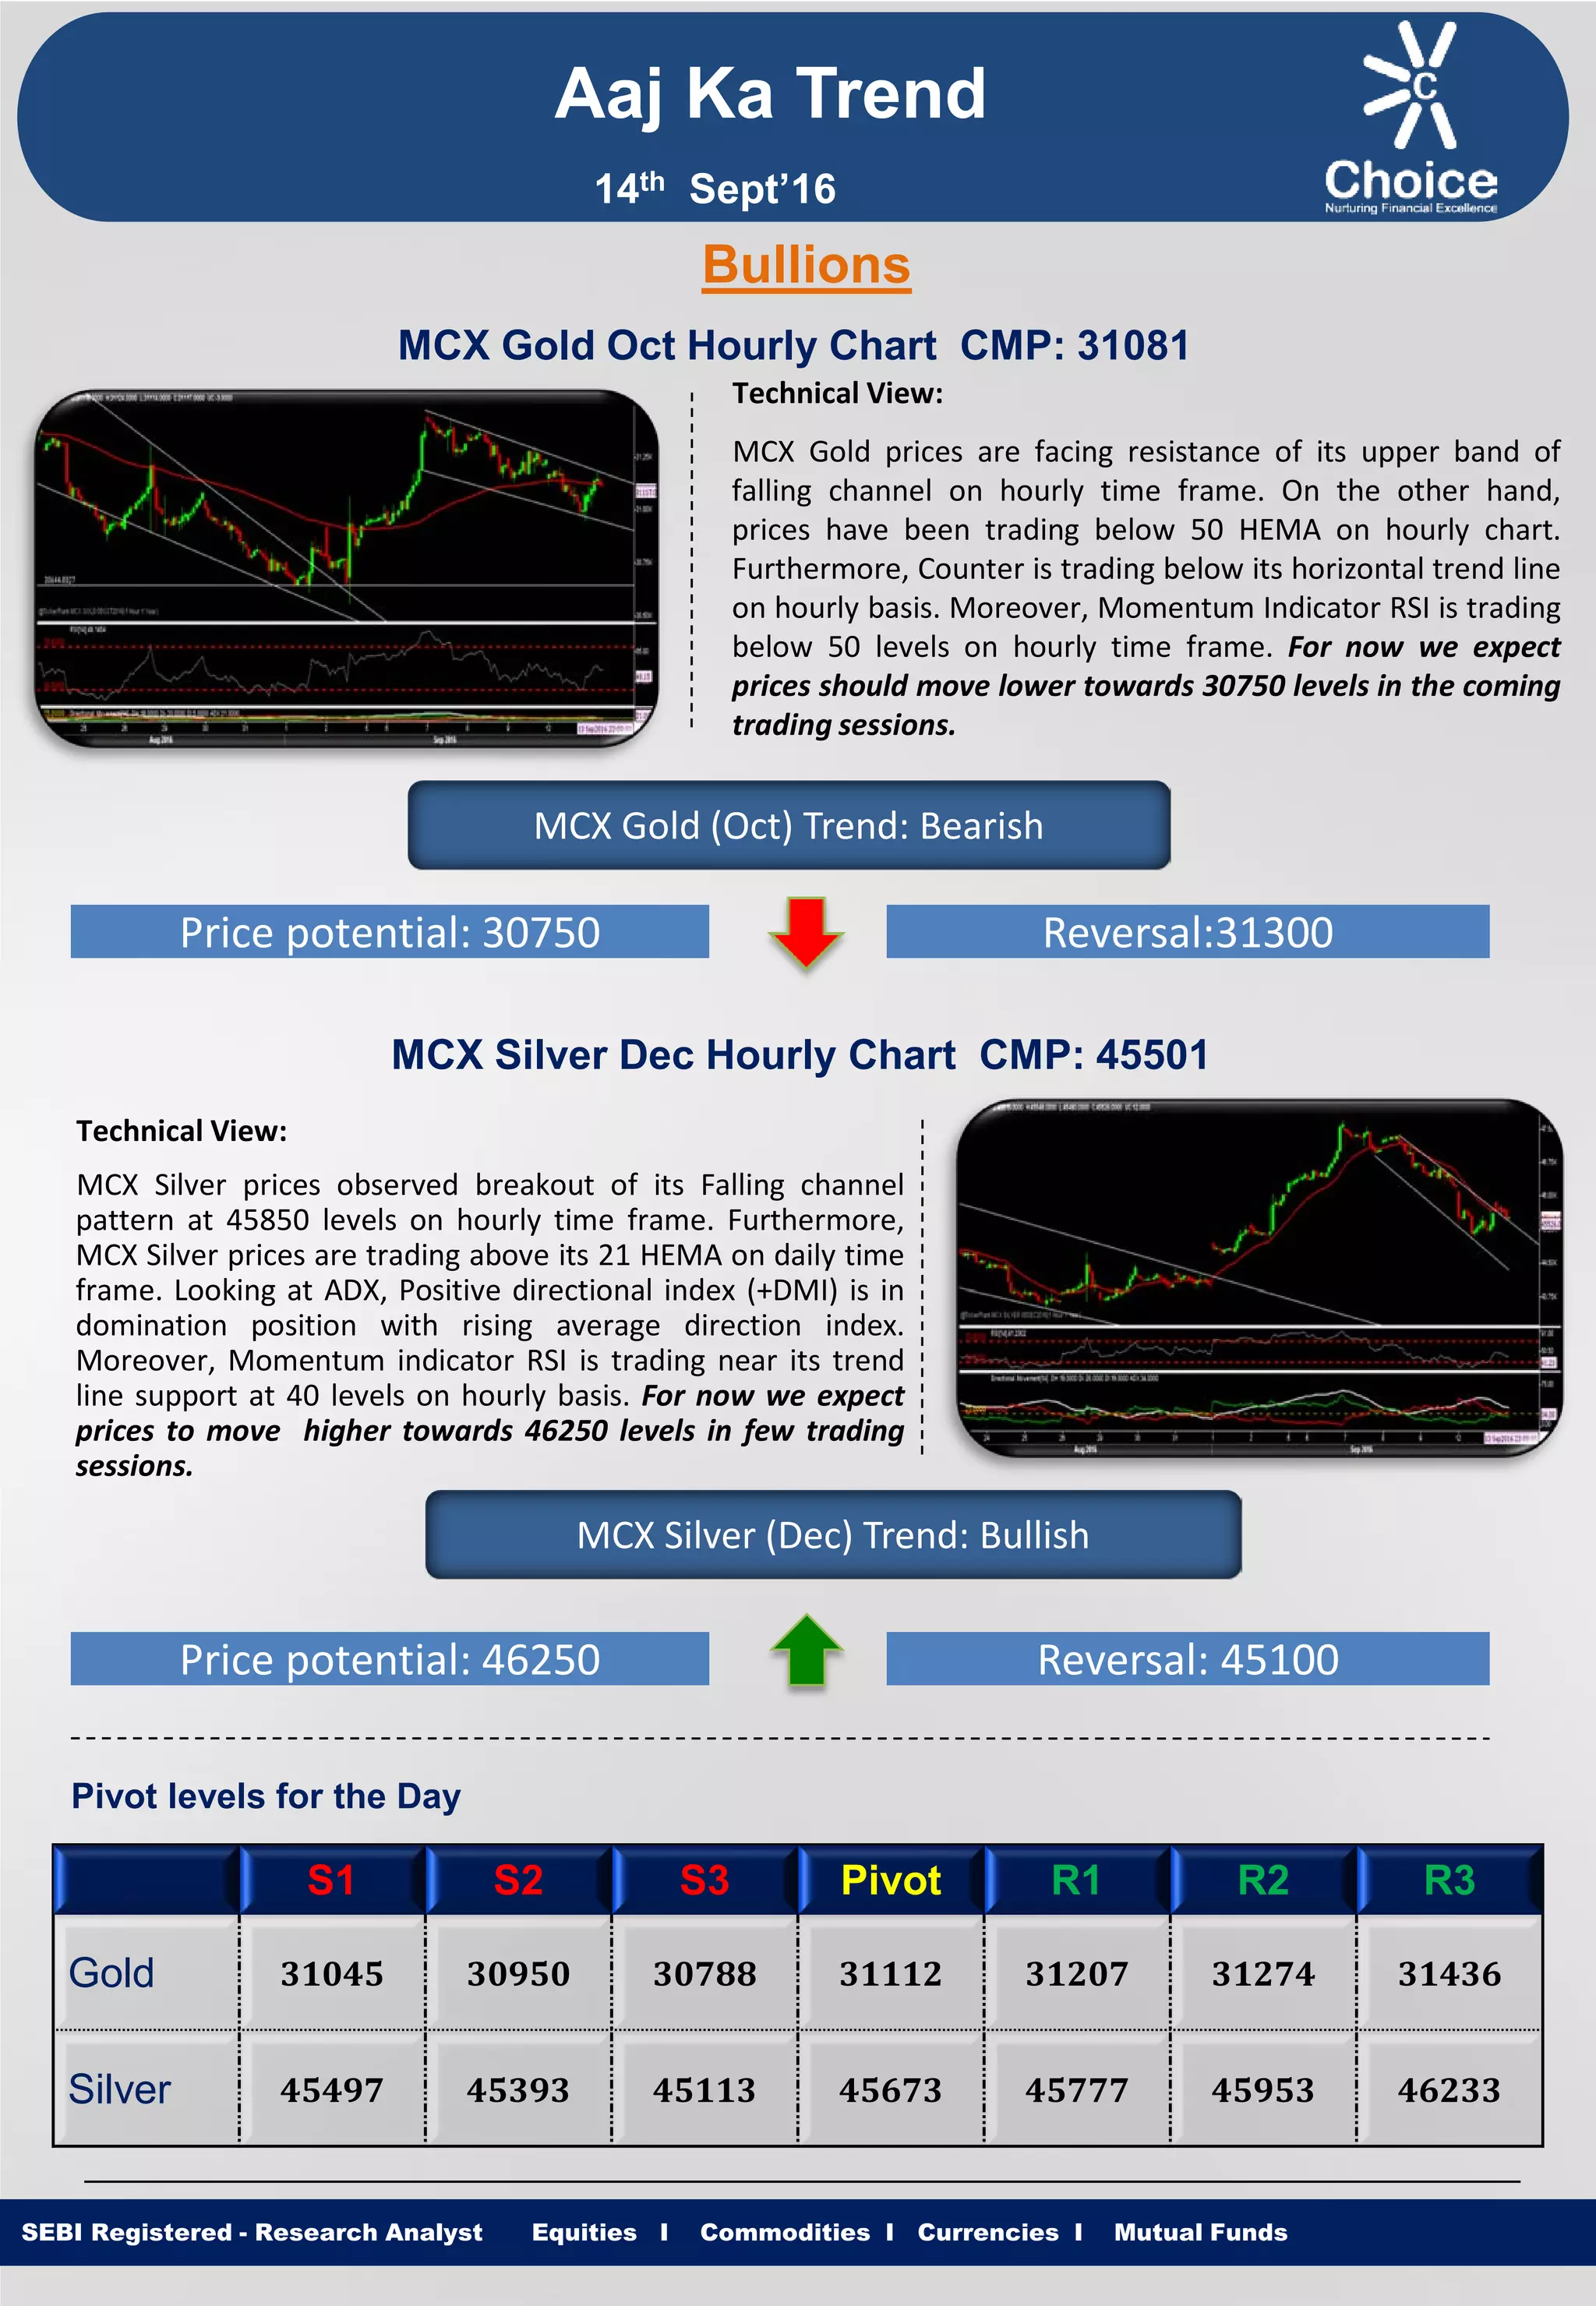
2) It finds that MCX gold is expected to move lower towards 30750 levels, while MCX silver is expected to move higher towards 46250 levels in the coming sessions.
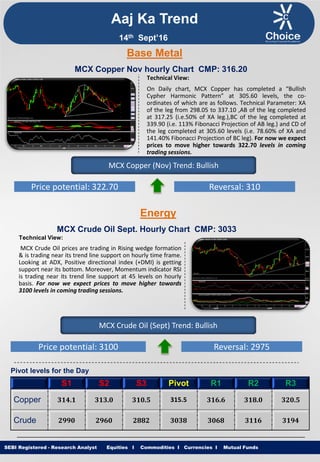
3) MCX copper has completed a bullish pattern and is expected to rise towards 32270 levels, while MCX crude oil is predicted to increase to 3100 levels.