The document presents a study on inventory management at Anantha PVC Pipes Pvt. Ltd. from 2015-16 to 2019-20, focusing on techniques such as Economic Order Quantity (EOQ) and ABC analysis to evaluate inventory efficiency. It highlights findings regarding inventory turnover ratios and suggests improvements to reduce costs and enhance performance. The study emphasizes the need for optimal ordering quantities and better management practices to improve inventory conversion rates.
![International Journal of Trend in Scientific Research and Development @ www.ijtsrd.com eISSN: 2456-6470
@ IJTSRD | Unique Paper ID – IJTSRD44968 | Volume – 5 | Issue – 5 | Jul-Aug 2021 Page 975
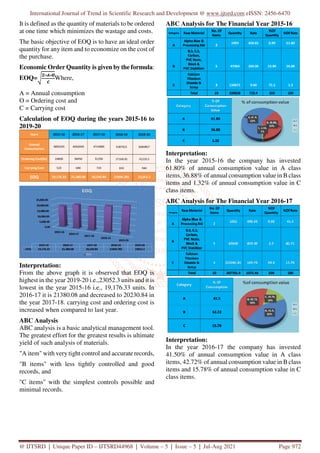
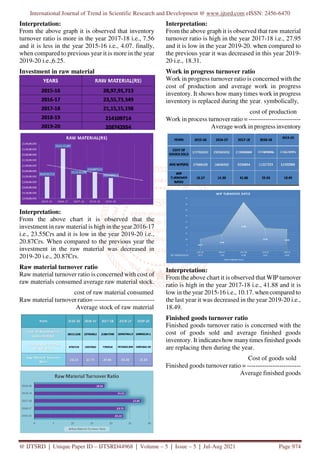
Interpretation:
From the above chart it is observed that finished
goods turnover ratio is high in the year 2019-20 i.e.,
134.73 and it is low in the year 2015-16 i.e., 34.13.
when compared to the last year it was increased in the
year 2019-20 i.e., 134.73.
Inventory conversion period
Formula: 365/ inventory turnover ratio
Inventory turnover ratios are calculated to
indicate whether inventories have been used
efficient or not.
Inventory conversion period may also be
calculated to find the average time taken to clear
the stock.
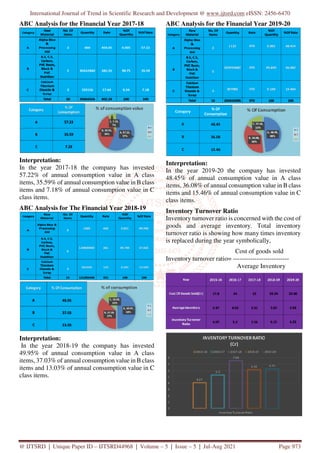
Interpretation:
From the above chart it is observed that the
conversion period high in the financial year 2015-16
i.e., 89 days and it is low in the year 2017-18 i.e., 48
days. when compared to previous year the conversion
period is less in the year 2019-20 i.e., 58days
Findings
EOQ is highest in the year 2019-20 i.e., 23,052.3
units and it is lowest in the year 2015-16 i.e.,
19,176.33 units.
The inventory conversion period is 48 days during the
year 2017-18, which indicates the inventory is
converted in to sales in a lesstime when compared to
other years. But in the following years it is increasing
it indicates company performance is not sufficient.
The ordering cost and carrying cost per unit is high
because of material transportation, insurance, tax and
storage cost is high.
Conclusion
A survey has been done to know about the inventory
management of the ANANTHA PVC PIPES PVT
LTD., with standard tools and techniques of inventory
management.
This study found out that the inventory management
of the company should concentrate on reduction of
different types of costs and also systematic
maintenance of inventory. Company has to reduce
inventory and it has to increase inventory turnover
ratio.
SUGGESTIONS
Company should order in optimum quantitywith help
of EOQ analysis so that carrying and ordering cost
should not go high.
The company can reduce carrying cost by following
proper inventory management techniques like JIT
(just in time).
The company inventory conversion period is more.it
indicates company, company performance is not
sufficient. The company is suggested to focus on
reducing the conversion period of inventory to
convert into sales.
Reference:
[1] I. M. Pandey: Financial Management
[2] Prasanna Chandra: Financial Management
[3] Ks Menon: Purchasing and Inventory Control
[4] Joseph G. Monks: Operations Management
[5] S. N. Charry: Production Management](https://image.slidesharecdn.com/127astudyoninventorymanagement-210916105512/85/A-Study-on-Inventory-Management-5-320.jpg)