The study investigates stress levels among 400 medical students in Ahmedabad, India, highlighting the relationship between stress and various lifestyle factors. Results indicate that many students experience moderate stress, primarily influenced by factors like physical activity and internet usage, while experiencing overall life satisfaction despite their stress levels. The study emphasizes the necessity for addressing stressors in medical education to promote better mental health among students.
![International Journal of Trend in Scientific Research and Development @ www.ijtsrd.com eISSN: 2456-6470
@ IJTSRD | Unique Paper ID – IJTSRD45054 | Volume – 5 | Issue – 5 | Jul-Aug 2021 Page 1386
broad research, in the clinical sciences there is a quick
extension in clinical information that medical students
are accepted to comprehend and have the option to
use in various conditions in their professional life
(Baig et al. 2016). By and large, the medical students
have elevated levels of pressure that could be because
of the day by day life stressors and the additional
worry of scholastic weight, absence of unwinding
time, expansiveness and profundity of material to be
learned, and repeated developmental and summative
assessments in a serious situation (Sohail 2013). One
of the research studies reported stress (62%) and
burnout (75%) in preclinical medical students (Fares
et al. 2016). Stress and burnout among medical
students are usual problem with probable severe
private and professional impacts (Bugaj et al. 2016).
The environment of medical education is considered
as troublesome and time-requesting, and greater
responsibility and commitment are required. All
around, various investigations have reported stress
among undergrad medical students to be 25.6% - 78%
(Fares et al. 2016, Sreedevi et al. 2016, Konjengbam
et al. 2015). A minor degree of stress is useful and
empowers the students to perform better. On the other
hand, significant levels of pressure may cause
impressive mental and physical glitches like poor
scholarly execution, stress-related anxiety,
depression, drug use, and even suicide (Gomathi et al.
2012, Dafalla et al. 2016, Siddiqui et al. 2016). There
are different sorts of stressors, which negativelyaffect
mentally, the learning procedure, and scholastic
advancement. Past reports have sorted stressors into
three significant groups: academic, psychosocial, and
health-related (Shah et al. 2010, Sreeramareddy et al.
2007). Many research articles have recognised
academics, gender, marital status, and age as
significant stressors (Sreedevi et al. 2016, Shah et al.
2010, Brahmbhatt et al. 2013, Yussuf et al. 2013).
A few investigations led in Arab nations, for example,
Egypt (60%) (Fawzy et al. 2017), Sudan [half]
(Dafaalla et al. 2016), Lebanon (62%) (Fares et al.
2016), and barely any examinations in Saudi Arabia
(72%) (Saniet et al. 2012), (53%) (Rahman et al.
2013), and (63%) (Abdulghani et al. 2011),
demonstrated significant levels of stress among
medical students. The present study investigated the
perceived stress level as well as reasons and sources
of stress among medical students at the different
medical colleges at Ahmedabad City, Gujarat, India.
Our results may help medical academicians, parents
of medical students to implement tactics that might
improve in relieving adaptable causes of stress and
stressors.
Materials and Methods
A cross sectional study was conducted in medical
colleges of Ahmedabad city. A total of 400 students
were enrolled or taken in the study using multistage
sampling. One college was selected from each zone
[east, west, north and south], conveniently. 100
medical students from each college were enrolled for
the study from last year i.e. 3rd year conveniently the
purpose of the study was disclosed before
participation and confidentiality was maintained
(Cigna’s Well Being Survey, 2018)
The following codes were used in the method below
to calculate the sample size.
p = expected prevalence of stress which equals 89%
(0.89)
L= allowable error and equals 10% of p (0.089)
So, the sample size was determined as below:
Therefore, the required sample size for the study was
47.48 ≈ 48. To round –off the sample size 320
students [80 from each college] were selected
randomly for formation of discriminant function and
remaining 20 for cross validation of discriminant
model formed.
The students who were willing to participate filled the
form. Students were asked to fill the self-administered
questionnaire consisting the questions regarding
socio-demographic profile, perceived stress scale
[PSS] developed by Cohen of al (The Perceived
Stress Scale, 1983). The PSS was designed to assess
the level of stress in individuals. The PSS is a 14-item
scale that consist of questions regarding participants
stressful thoughts or feelings associated to conditions
in their living in last month. Each element is
measured on a 5-point Likert scale from “0: never” to
“4: very often”. The PSS score ranged from 0 to 56,
the higher score the greater stress(The Perceived
Stress Scale, 1983).
To measure satisfaction level of medical students’
satisfaction with life scale was used. It is a 5-item
scale intended to measure the intellectual judgments
of one’s life satisfaction. Participants specify how
much they agree or disagree with each of the 5-item
using a 7-point scale that varies from 7-stronglyagree
to 1 strongly disagree. The higher the score, more the
person is satisfied with the life he/she is having.
(Diener 1985).
Subjective happiness scale [also known as General
Happiness Scale] was used to check happiness score
of the medical students. It is a 4-item scale designed](https://image.slidesharecdn.com/187stressanundetachableconditionoflife-210918051244/75/Stress-An-Undetachable-Condition-of-Life-2-2048.jpg)
![International Journal of Trend in Scientific Research and Development @ www.ijtsrd.com eISSN: 2456-6470
@ IJTSRD | Unique Paper ID – IJTSRD45054 | Volume – 5 | Issue – 5 | Jul-Aug 2021 Page 1387
to measure subjective happiness. Each item is rated
on a 7-point Likert scale varying from 1 to 7. The
elevated the score, happier the person. (Lyubomirsky
et al. 1999).
To find out, how much spiritual a person is, a
questionnaire was used, designed by Washington
University’s psychiatrist Robert Cloninger, author of
Feeling Good: The Science of Well-being. The
questionnaire consists of 20 questions, for which the
answer should be either true or false. The scoring is
done as ‘true: 1’& ‘false:0’. The higher the score the
more is spirituality. (Cloninger, Quiz: How Spiritual
Are You?)
Internet addiction was checked using ‘Internet
addiction Test (IAT)’ developed by Dr. Kimberly
Young. It is a dependable and legitimate measure of
addictive use of internet. It is a 20 item-scale that
measures mild, moderate and severe level of internet
addiction based on 6-point Likert scale, where ‘0:
Does not apply’, ‘1: Rarely’, ‘2: Occasionally’, ‘3:
Frequently’, ‘4: Often’, ‘5: Always’. Total scores
indicate the level of internet addiction. The higher is
score, the greater is level of addiction. (IAT; Young,
1998).
Other questions regarding socioeconomic and life-
style parameters were also included in the study. Data
were entered into MS Excel and analysed using IBM
SPSS Statistics for Windows, Version 20.0. Armonk,
NY: IBM Corp. For statistical significance, Cramer’s
V association was applied. Cramer’s V varies from 0
(corresponding to no association between the
variables) to 1 (complete association) and P values
were retrieved accordingly from Cramer’s V. P <
0.05 was considered as statistically significant
difference at 95% confidence level.
Results
TABLE I Descriptive Statistics & association between Explanatory variables and Perceived Stressed
Scale (PSS)
Variables
Perceived Stress Scale
categories Cramer's
V
[P-
Value]
Low Moderate High Total
No. No. No. No.
[%] [%] [%] [%]
Gender
Female
0 133 13 146
0.17
[0]
0 91.09 8.9 36.5
Male
12 242 0 254
4.7 95.27 0 63.5
Smoker
Yes
12 301 13 375
0.123
[0.05]
3.7 92.33 4 93.8
No
0 74 0 24
0 100 0 6
Occupation
(Working for
money/
Non-
working)
Only
studying
0 121 0 121
0.17
[0]
0 100 0 30.3
Studies + working
12 254 13 279
4.3 91.03 4.7 69.8
Place of Stay
during
College
Home
0 133 13 146
0.272
[0]
0 91.09 8.9 36.5
Hostel
12 242 0 254
4.7 95.27 0 63.5
Father's
Occupation
Business
0 96 0 96
0.341
[0]
0 100 0 24
Others
0 24 0 24
0 100 0 6
Govt. Service
0 73 0 73
0 100 0 18.3](https://image.slidesharecdn.com/187stressanundetachableconditionoflife-210918051244/75/Stress-An-Undetachable-Condition-of-Life-3-2048.jpg)
![International Journal of Trend in Scientific Research and Development @ www.ijtsrd.com eISSN: 2456-6470
@ IJTSRD | Unique Paper ID – IJTSRD45054 | Volume – 5 | Issue – 5 | Jul-Aug 2021 Page 1388
Doctors
12 132 0 144
8.3 91.66 0 36
Private Service
0 50 13 63
0 79.36 21 15.8
Mother's
Occupation
Business
0 12 0 12
0.094
[0.61]
0 100 0 3
Doctor
0 12 0 12
0 100 0 3
Govt. Service
0 24 0 24
0 100 0 6
Housewife
12 291 13 316
3.8 92.08 4.1 79
Others
0 24 0 24
0 100 0 6
Private Service
0 12 0 12
0 100 0 3
Average
Internet
Usage per
day
0-3 hours
0 144 0 144
0.165
[0.01]
0 100 0 36
4-6 hours
12 195 13 220
5.5 88.63 5.9 55
7-10 hours
0 24 0 24
0 100 0 6
11 hours and more
0 12 0 12
0 100 0 3
Commonest
place of
Internet
Usage
College
0 73 0 73
0.13
[0.05]
0 100 0 18.3
Home
12 241 13 266
4.5 90.6 4.9 66.5
Library/Lab
0 12 0 12
0 100 0 3
Others
0 49 0 49
0 100 0 12.3
Most
Common
Gadget for
Internet
Usage
Cell phone
12 351 13 376
0.046
[1]
3.2 93.35 3.5 94
Laptop
0 12 0 12
0 100 0 3
Tablet
0 12 0 12
0 100 0 3
Usual Login
Status
always online
12 121 13 146
0.241
[0]
8.2 82.87 8.9 36.5
cannot say
0 72 0 72
0 100 0 18
logged in and off occasionally
0 182 0 182
0 100 0 45.5
Commonest
mode of
internet
access
Broadband
0 12 0 12
0.57
[0.59]
0 100 0 3
Mobile Data
12 339 13 364
3.3 93.13 3.6 91](https://image.slidesharecdn.com/187stressanundetachableconditionoflife-210918051244/75/Stress-An-Undetachable-Condition-of-Life-4-2048.jpg)
![International Journal of Trend in Scientific Research and Development @ www.ijtsrd.com eISSN: 2456-6470
@ IJTSRD | Unique Paper ID – IJTSRD45054 | Volume – 5 | Issue – 5 | Jul-Aug 2021 Page 1389
Wi-Fi
0 24 0 24
0 100 0 6
Commonest
purpose for
using internet
Academics
0 98 0 98
0.232
[0]
0 100 0 24.5
Entertainment
0 120 13 133
0 90.22 9.8 33.3
Social Media
12 157 0 169
7.1 92.89 0 42.3
Average
monthly
expenditure
on internet
> Rs. 401
0 60 13 73
0.305
[0]
0 82.19 18 18.3
Rs. 151 – 400
12 170 0 182
6.6 93.4 0 45.5
up to Rs. 150
0 145 0 145
0 100 0 36.3
Internet
Addiction
Yes
12 339 0 351
0.493
[0]
3.4 96.58 0 87.8
No
0 36 13 49
0 73.46 27 12.3
Physical
Activity
1.Active
12 218 13 243
0.208
[0]
4.9 89.71 5.3 60.8
2. Non-Active
0 157 0 157
0 100 0 39.3
Satisfaction
with Life
Scale
Extremely Dissatisfied
0 12 0 12
0.532
[0]
0 100 0 3
Dissatisfied
0 12 0 12
0 100 0 3
Neutral
0 13 13 26
0 50 50 6.5
Slightly satisfied
0 109 0 109
0 100 0 27.3
Satisfied
0 133 0 133
0 100 0 33.3
Extremely satisfied
12 96 0 108
11 88.88 0 27
Spirituality
[Category]
Highly skeptical, resistant to
developing spiritual awareness
0 12 0 12
0.167
[0.02]
0 100 0 3
A practical empiricist lacking self-
transcendence
0 12 0 12
0 100 0 3
Spiritually average; could develop
more spiritual life if desired
0 134 0 134
0 100 0 33.5
Spiritually aware, easily lost in the
moment
0 24 0 24
0 100 0 6
Highly spiritual a real mystic
12 193 13 218
5.5 88.53 6 54.5
Table 1 indicates the bifurcation based on prevalence of the perceived stressed scale (PSS) in variables. Males
(95.27%) were moderately more stressed than females (91.09%), but none of the males were highly stressed
while 8.9% females were highly stressed. Most of the students (93.75%) were non-smokers. 69.75% of the
students used to study and work. 63.5% medical students were hostelites. Most of the student’s fathers were
doctors (36%), 24% student’s fathers were businessman, 18.25% were government employees, 15.75 % were](https://image.slidesharecdn.com/187stressanundetachableconditionoflife-210918051244/75/Stress-An-Undetachable-Condition-of-Life-5-2048.jpg)
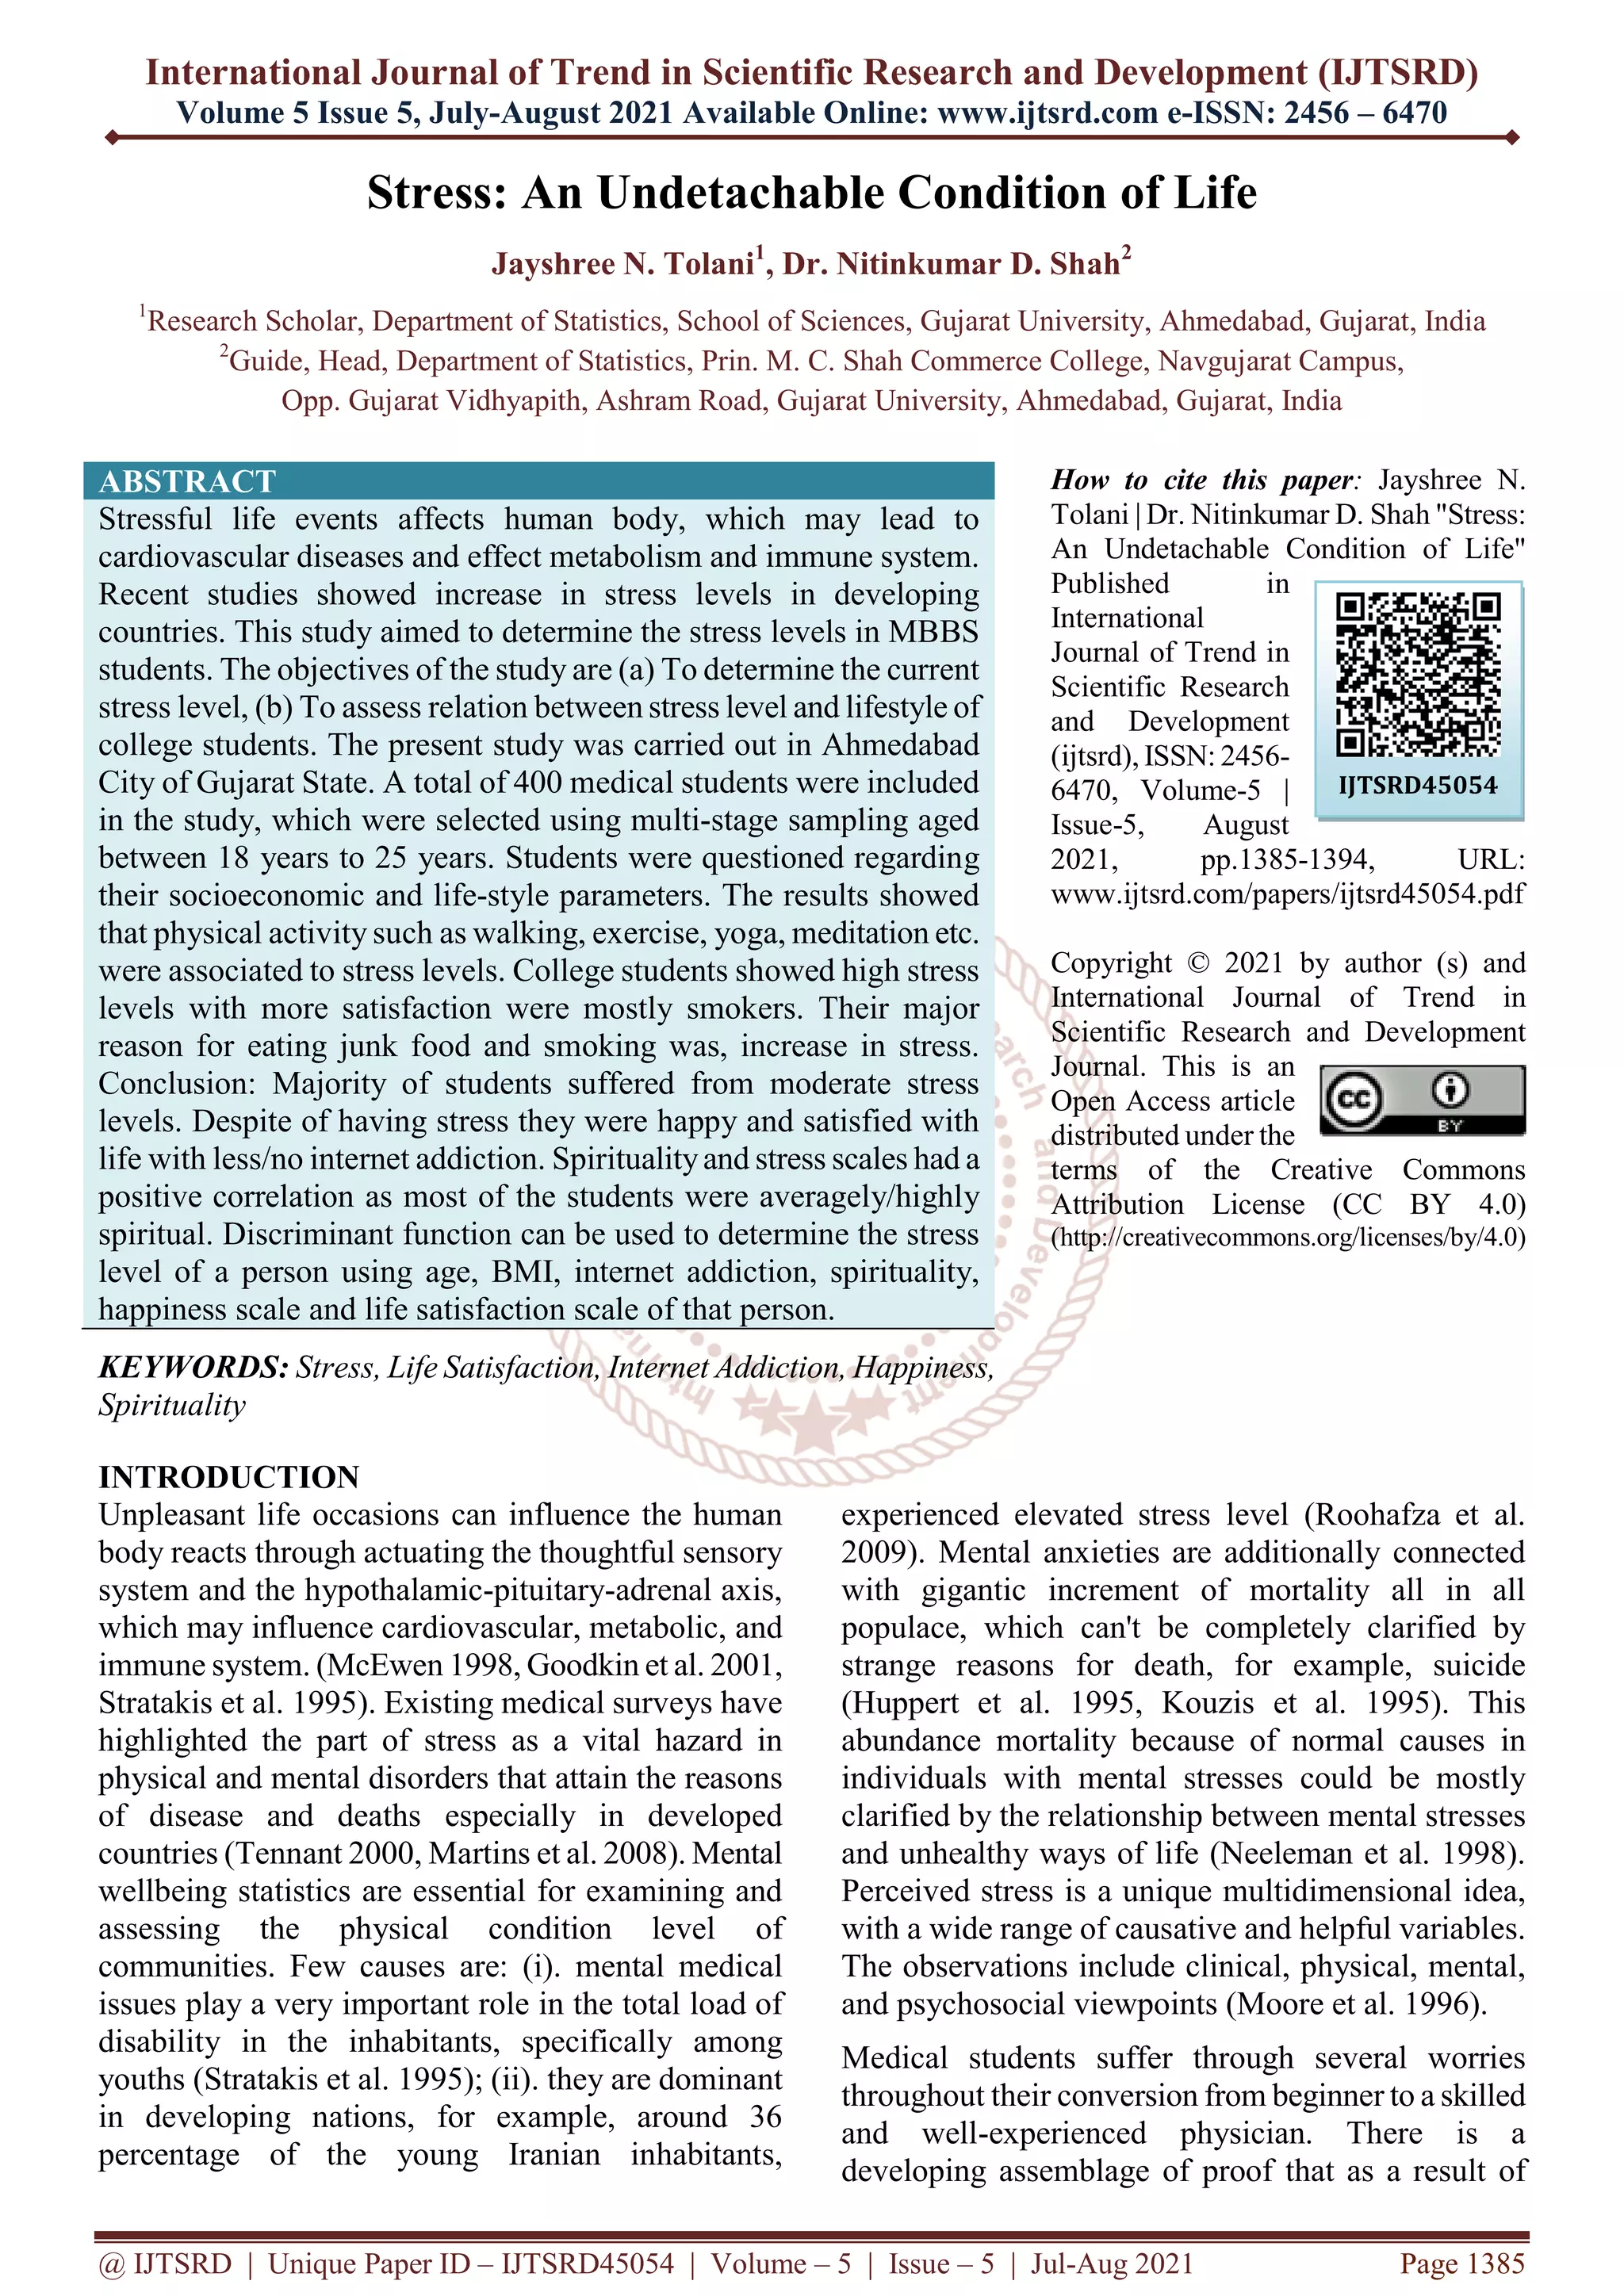
![International Journal of Trend in Scientific Research and Development @ www.ijtsrd.com eISSN: 2456-6470
@ IJTSRD | Unique Paper ID – IJTSRD45054 | Volume – 5 | Issue – 5 | Jul-Aug 2021 Page 1390
private sector employees and remaining 6% worked as real estate brokers, farmers, online traders, and children
of single mothers. While many student’s mothers were housewives (79%), 3% were doctors, 3%
businesswomen, 6% belonged to government sector, 3% to private sector and 6% were doing various works like
sewing, painting, Zumba trainers, home-based beauty parlors for earning. 55% of the students used on an
average 4 - 6 hours internet daily. From the tabulated data, most common place for students (66.5%) was home,
with cellphone (94%) as the most common gadget for using internet. Most of the students (45.5%) preferred to
log-in and log-off occasionally depending on the type of website and work for which they are using internet,
may be the reason is for security purpose. 91% of the students used mobile data for internet usage with the
commonest purpose being social media (42.25%). Highest number of students i.e. 45.5% spent approximately
Rs. 151 - 400/month on internet recharges. 87.75% students were found Internet Addicted (Young’s Internet
Addiction Test was used to measure the addiction). 48.25% students self-rated that their health as ‘very good’.
60.75 % students were physically active. 48.25% of the students self-rated that they were very satisfied with the
quality of life they lived, on the other hand only 27% of the students were found to be extremely satisfied
depending on the Satisfaction with Life Scale. 54.5% students were found to be highly spiritual, while 33.5%
were found averagely spiritual.
Gender, Occupation, place of stay during college, father’s occupation, average internet usage per day, usual log-
in status, average monthly expenditure on internet, internet addiction, self-rated health, physical activity, self-
rated life satisfaction, Satisfaction with Life Scale, Spirituality were found statistically significantly associated
Perceived Stress Scale; while smokers, mother’s occupation, commonest place of internet usage and most
common gadget for internet usage were not found statistically significantly associated with Perceived Stress
Scale using Cramer’s V test at 5% level of significance using SPSS.
TABLE II Correlation of Stress with Age, BMI, Internet Addiction, Happiness Scale, Life Satisfaction
and Spirituality
Spearman's rho Correlation
Correlations Correlation Coefficient P-Value
Age * Stress Total -0.150 0.007
BMI * Stress Total 0.112 0.046
Number of other family members using internet * Stress Total -0.038 0.496
Internet Addiction * Stress Total 0.160 0.004
Subjective Happiness Scale * Stress Total 0.022 0.006
SWLS [Life Satisfaction] * Stress Total 0.119 0.033
Spirituality Total * Stress Total 0.192 0.001
Table 2 shows Correlation of Stress with Age, BMI, Internet Addiction, Happiness Scale, Life Satisfaction and
Spirituality. Spearman’s rho correlation was used to calculate the correlation as the variables used were scale
parameters developed by different scientists. From table 2 it can be observed that as the obesity (BMI), Internet
Addiction, Subjective Happiness, Life Satisfaction and Spirituality increases; stress increases at 5% level of
significance. And number of family members using internet does not correlate with stress level.
TABLE III Discriminant Function for the Stress Determination.
Independent Variables
Function
P-Value
1 2
Age [completed years] 0.122 0.063
0.000*
BMI -0.036 0.096
Number of other family members using internet [number only] -0.635 0.255
Internet Addiction -0.015 0.064
Subjective Happiness Scale 0.157 0.143
SWLS -0.017 -0.031
Spirituality Total 0.071 0.067
[Constant] -3.609 -9.469](https://image.slidesharecdn.com/187stressanundetachableconditionoflife-210918051244/75/Stress-An-Undetachable-Condition-of-Life-6-2048.jpg)

![International Journal of Trend in Scientific Research and Development @ www.ijtsrd.com eISSN: 2456-6470
@ IJTSRD | Unique Paper ID – IJTSRD45054 | Volume – 5 | Issue – 5 | Jul-Aug 2021 Page 1392
Conclusion
This study showed the new face of the medical
college students of Ahmedabad city, Gujarat.
Majority of the students suffered from moderate
stress levels. Physical activity such as walking,
exercise, yoga, meditation etc. were negatively
associated to stress levels. Their major reason for
smoking was, increase in stress, due to family
conflicts, academics, and surrounding atmosphere.
Despite of having stress theywere happyand satisfied
with life with less/no internet addiction and obesity.
Spirituality and stress scales had a positive correlation
as most of the students were averagely/highly
spiritual.
For the data used, we have applied discriminant
analysis technique to classify stress levels based on
these independent variables viz. Age, BMI, Internet
Addiction, Happiness Scale, Life Satisfaction and
Spirituality and found 87.8% were correctly classified
and for the new data, the same model was fitted, and
it classified 88.75% observations correctly. So, from
this study it can be recommended; Discriminant
function fits good & can be used to determine the
stress level of a person using age, BMI, internet
addiction, spirituality, happiness scale and life
satisfaction scale of that person.
References
[1] McEwen, Bruce S. "Protective and damaging
effects of stress mediators." New England
journal of medicine 338.3 (1998): 171-179..
[2] Goodkin, Karl, et al. "Physiological effects of
bereavement and bereavement support group
interventions." Handbook of bereavement
research: Consequences, coping, and care..
American Psychological Association, 2001.
671-703.
[3] Stratakis, Constantine A., and George P.
Chrousos. "Neuroendocrinology and
pathophysiology of the stress system." Annals
of the New York Academy of Sciences 771.1
(1995): 1-18.
[4] Tennant, Christopher. "Work stress and
coronary heart disease." European Journal of
Cardiovascular Prevention & Rehabilitation 7.4
(2000): 273-276.
[5] Coetzee, Melinde, and Nico Martins.
"Organisational culture, employee satisfaction,
perceived leader emotional competency and
personality type: An exploratory study in a
South African engineering company." SA
Journal of Human Resource Management 5.2
(2007): 20-32.
[6] Roohafza, Hamidreza, et al. "Association of
socioeconomic status and life-style factors with
coping strategies in Isfahan Healthy Heart
Program, Iran." Croatian medical journal 50.4
(2009): 380-386.
[7] Huppert, Felicia A., and Joyce E. Whittington.
"Symptoms of psychological distress predict 7-
year mortality." Psychological medicine 25.5
(1995): 1073-1086.
[8] Kouzis, A., William W. Eaton, and P. J. Leaf.
"Psychopathology and mortality in the general
population." Social Psychiatry and Psychiatric
Epidemiology 30.4 (1995): 165-170.
[9] Adams, Henry E., and Patricia B. Sutker,
eds. Comprehensive handbook of
psychopathology. Springer Science & Business
Media, 2007.
[10] Moore, Kathleen A., and Cary L. Cooper.
"Stress in mental health professionals: A](https://image.slidesharecdn.com/187stressanundetachableconditionoflife-210918051244/75/Stress-An-Undetachable-Condition-of-Life-8-2048.jpg)
![International Journal of Trend in Scientific Research and Development @ www.ijtsrd.com eISSN: 2456-6470
@ IJTSRD | Unique Paper ID – IJTSRD45054 | Volume – 5 | Issue – 5 | Jul-Aug 2021 Page 1393
theoretical overview." International journal of
social psychiatry 42.2 (1996): 82-89.
[11] Baig, Mukhtiar, et al. "Perceptions, perceived
barriers, and practices of physicians’ towards
evidence-based medicine." Pakistan journal of
medical sciences 32.1 (2016): 49.
[12] Sohail, Nudrat. "Stress and academic
performance among medical students." J Coll
Physicians Surg Pak 23.1 (2013): 67-71.
[13] Fares, Jawad, et al. "Extracurricular activities
associated with stress and burnout in preclinical
medical students." Journal of epidemiologyand
global health 6.3 (2016): 177-185.
[14] Bugaj, T. J., et al. "Psychosocial burden in
medical students and specific prevention
strategies." Mental Health & Prevention 4.1
(2016): 24-30.
[15] Sreedevi, Arepalli, et al. "Study on stress
among first-year medical students of Kurnool
Medical College, Kurnool." Int J Med Sci Pub
Health 5 (2016): 852-855.
[16] Konjengbam, Shantibala, et al. "Psychological
morbidity among undergraduate medical
students." Indian journal of public health 59.1
(2015): 65.
[17] Gomathi, Kadayam G., Soofia Ahmed, and
Jayadevan Sreedharan. "Psychological health of
first-year health professional students in a
medical university in the United Arab
Emirates." Sultan Qaboos University Medical
Journal 12.2 (2012): 206.
[18] Dafaalla, Mohamed, et al. "Depression, anxiety,
and stress in sudanese medical students: a cross
sectional study on role of quality of life and
social support." Am J Educ Res 4.13 (2016):
937-42.
[19] Jahan, Firdous, et al. "Perception of stress,
anxiety, depression and coping strategies
among medical students at Oman Medical
College." World Family Medicine Journal:
Incorporating the Middle East Journal of
Family Medicine 99.3719 (2016): 1-8.
[20] Sharifirad, Gholamreza, et al. "Stress among
Isfahan medical sciences students." Journal of
research in medical sciences: the official
journal of Isfahan University of Medical
Sciences 17.4 (2012): 402-406.
[21] Shah, Mohsin, et al. "Perceived stress, sources
and severity of stress among medical
undergraduates in a Pakistani medical
school." BMC medical education 10.1 (2010):
1-8.
[22] Sreeramareddy, Chandrashekhar T., et al.
"Psychological morbidity, sources of stress and
coping strategies among undergraduate medical
students of Nepal." BMC Medical
education 7.1 (2007): 1-8.
[23] Brahmbhatt, Krutarth R., et al. "Perceived
stress and sources of stress among medical
undergraduates in a private medical college in
Mangalore, India." Int J Biomed Adv Res 4.2
(2013): 133-5.
[24] Yussuf, A. D., et al. "The correlates of stress,
coping styles and psychiatric morbidity in the
first year of medical education at a Nigerian
University." African Journal of Psychiatry 16.3
(2013): 206-215.
[25] Fawzy, Mohamed, and Sherifa A. Hamed.
"Prevalence of psychological stress, depression
and anxiety among medical students in
Egypt." Psychiatry research 255 (2017): 186-
194.
[26] Sani, M., et al. "Prevalence of stress among
medical students in Jizan University, Kingdom
of Saudi Arabia." Gulf Med J 1.1 (2012): 19-
25.
[27] Rahman, AG Abdel, et al. "Stress among
medical Saudi students at college of medicine,
King Faisal University." Journal of Preventive
Medicine and Hygiene 54.4 (2013): 195.
[28] Abdulghani, Hamza M., et al. "Stress and its
effects on medical students: a cross-sectional
study at a college of medicine in Saudi
Arabia." Journal of health, population, and
nutrition 29.5 (2011): 516.
[29] The Perceived Stress Scale (PSS) by State of
New Hampshire Employee Assistance
Program, 1983
https://das.nh.gov/wellness/docs/percieved%20
stress%20scale.pdf
[30] Diener, E. D., et al. "The satisfaction with life
scale." Journal of personality assessment 49.1
(1985): 71-75.
[31] Lyubomirsky, Sonja, and Heidi S. Lepper. "A
measure of subjective happiness: Preliminary
reliability and construct validation." Social
indicators research 46.2 (1999): 137-155.
[32] Quiz: How Spiritual Are You? by C. Robert
Cloninger, Sansone family Center for
Wellbeing, Washington University, St. Louis,](https://image.slidesharecdn.com/187stressanundetachableconditionoflife-210918051244/75/Stress-An-Undetachable-Condition-of-Life-9-2048.jpg)
![International Journal of Trend in Scientific Research and Development @ www.ijtsrd.com eISSN: 2456-6470
@ IJTSRD | Unique Paper ID – IJTSRD45054 | Volume – 5 | Issue – 5 | Jul-Aug 2021 Page 1394
Mo.
http://web.pdx.edu/~tothm/religion/Spiritual%2
0Quiz.pdf.
[33] Internet Addiction Test, Dr. Kimberly Young,
1998. http://cyberpsy.ru/wp-
content/uploads/2018/02/iat-manual.pdf
[34] Cigna’s 360 Well Being survey, 2018.](https://image.slidesharecdn.com/187stressanundetachableconditionoflife-210918051244/75/Stress-An-Undetachable-Condition-of-Life-10-2048.jpg)


![“Morbidity profile of children [6-11 years] attending Municipal Corporation P...](https://cdn.slidesharecdn.com/ss_thumbnails/w014111118122-151205110846-lva1-app6892-thumbnail.jpg?width=640&height=640&fit=bounds)