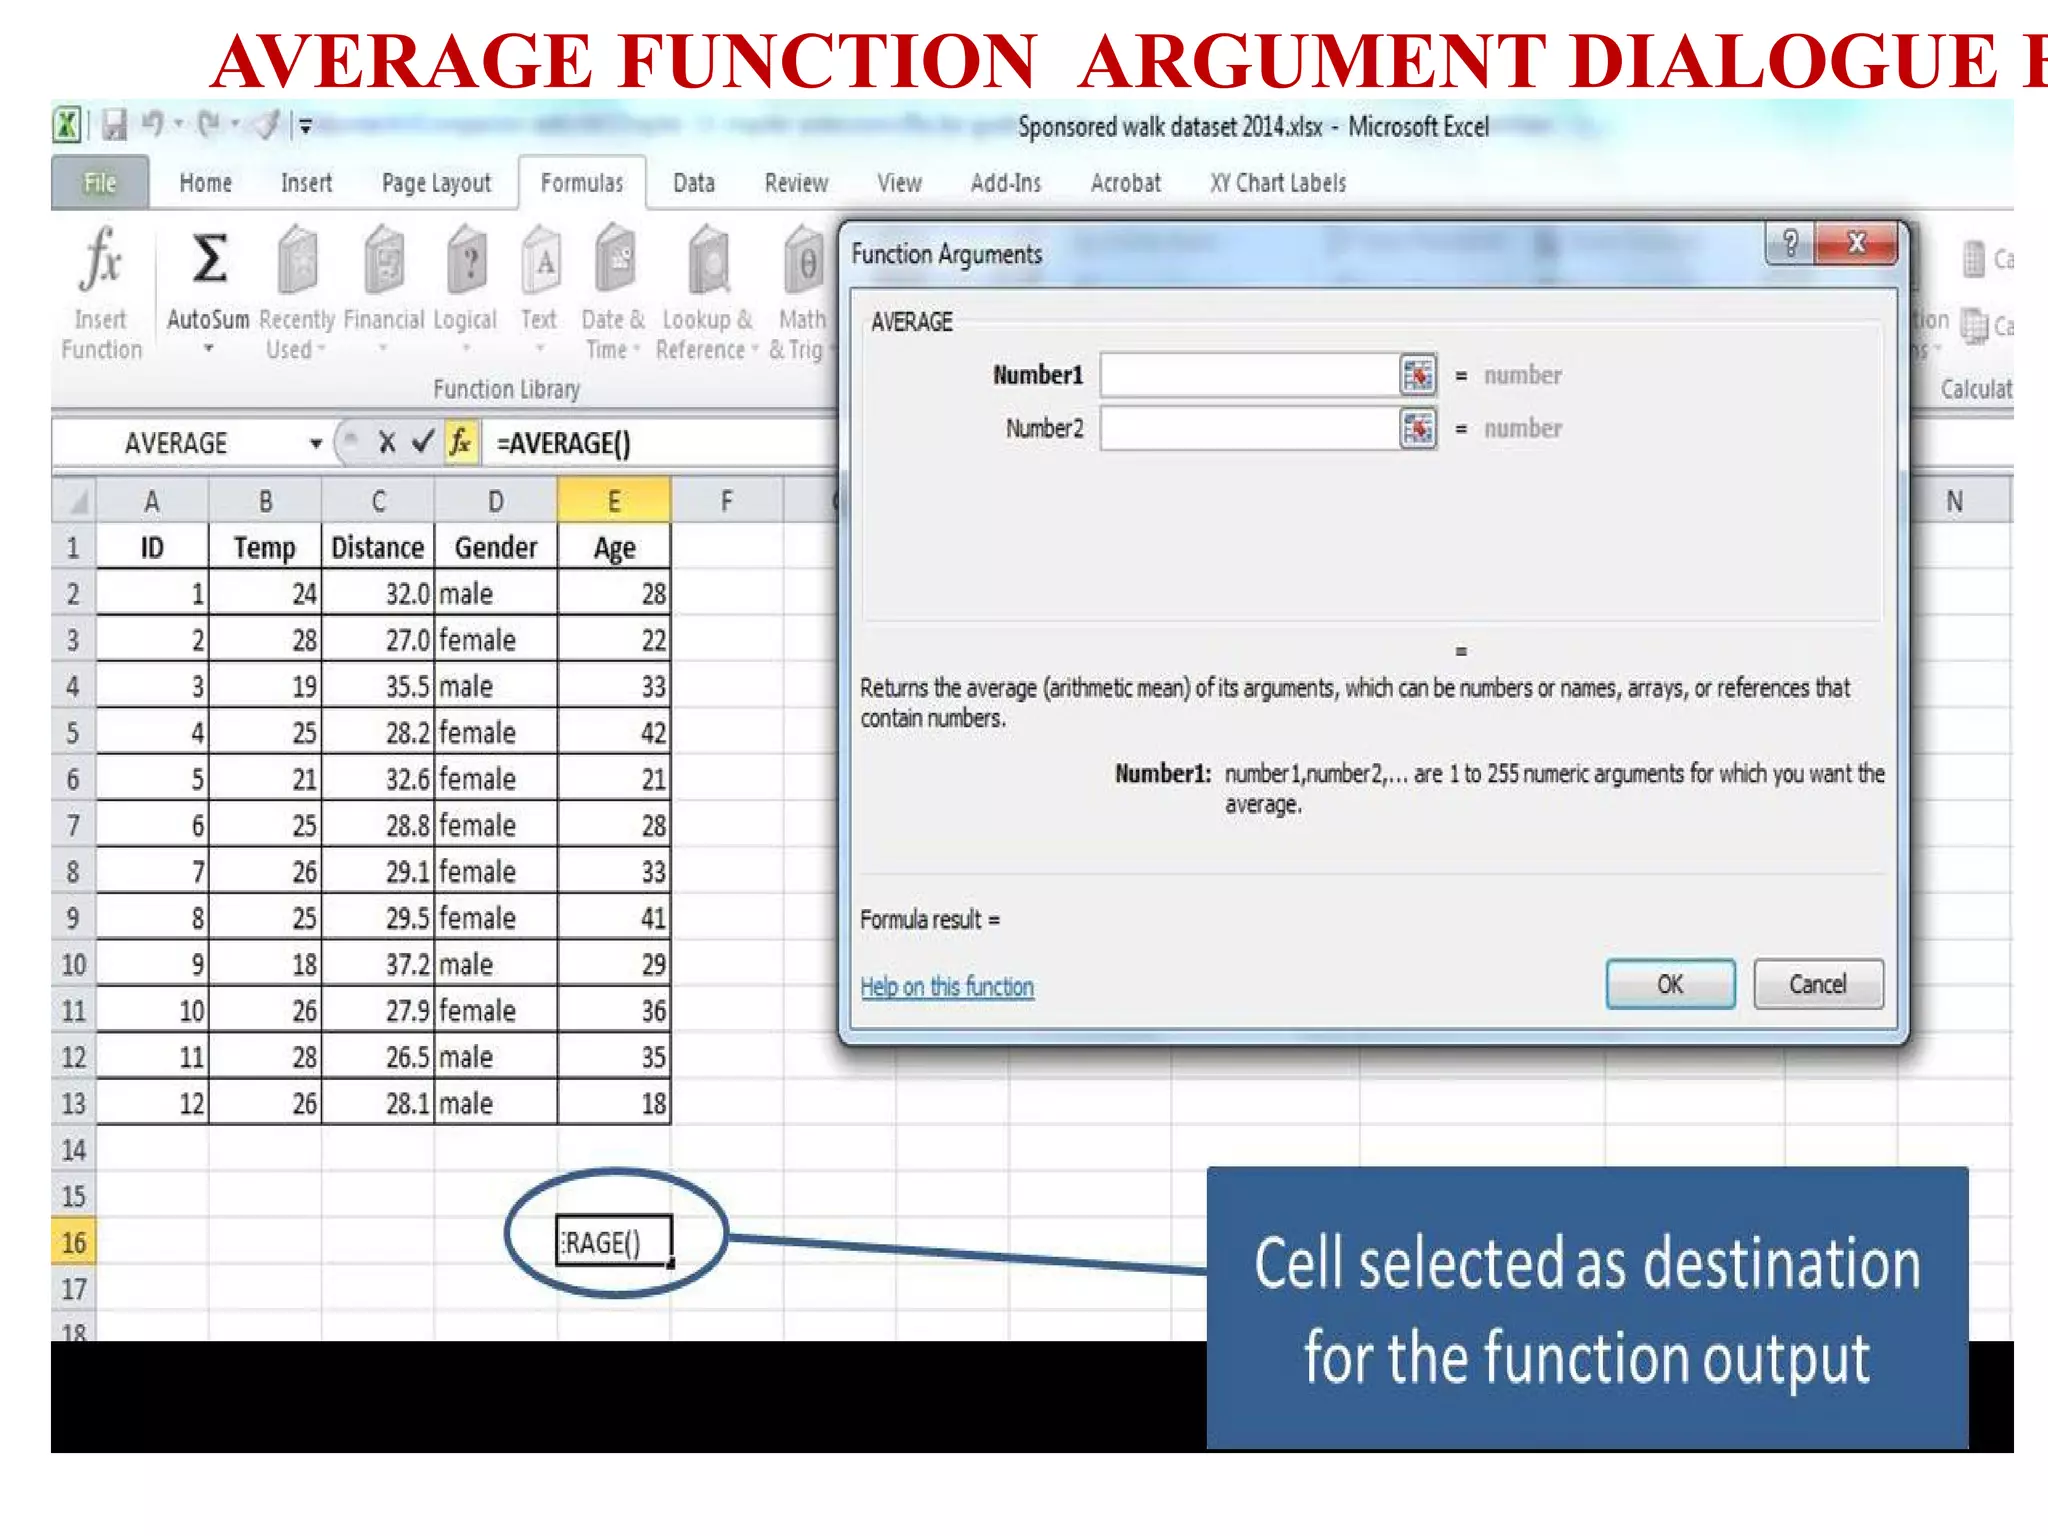
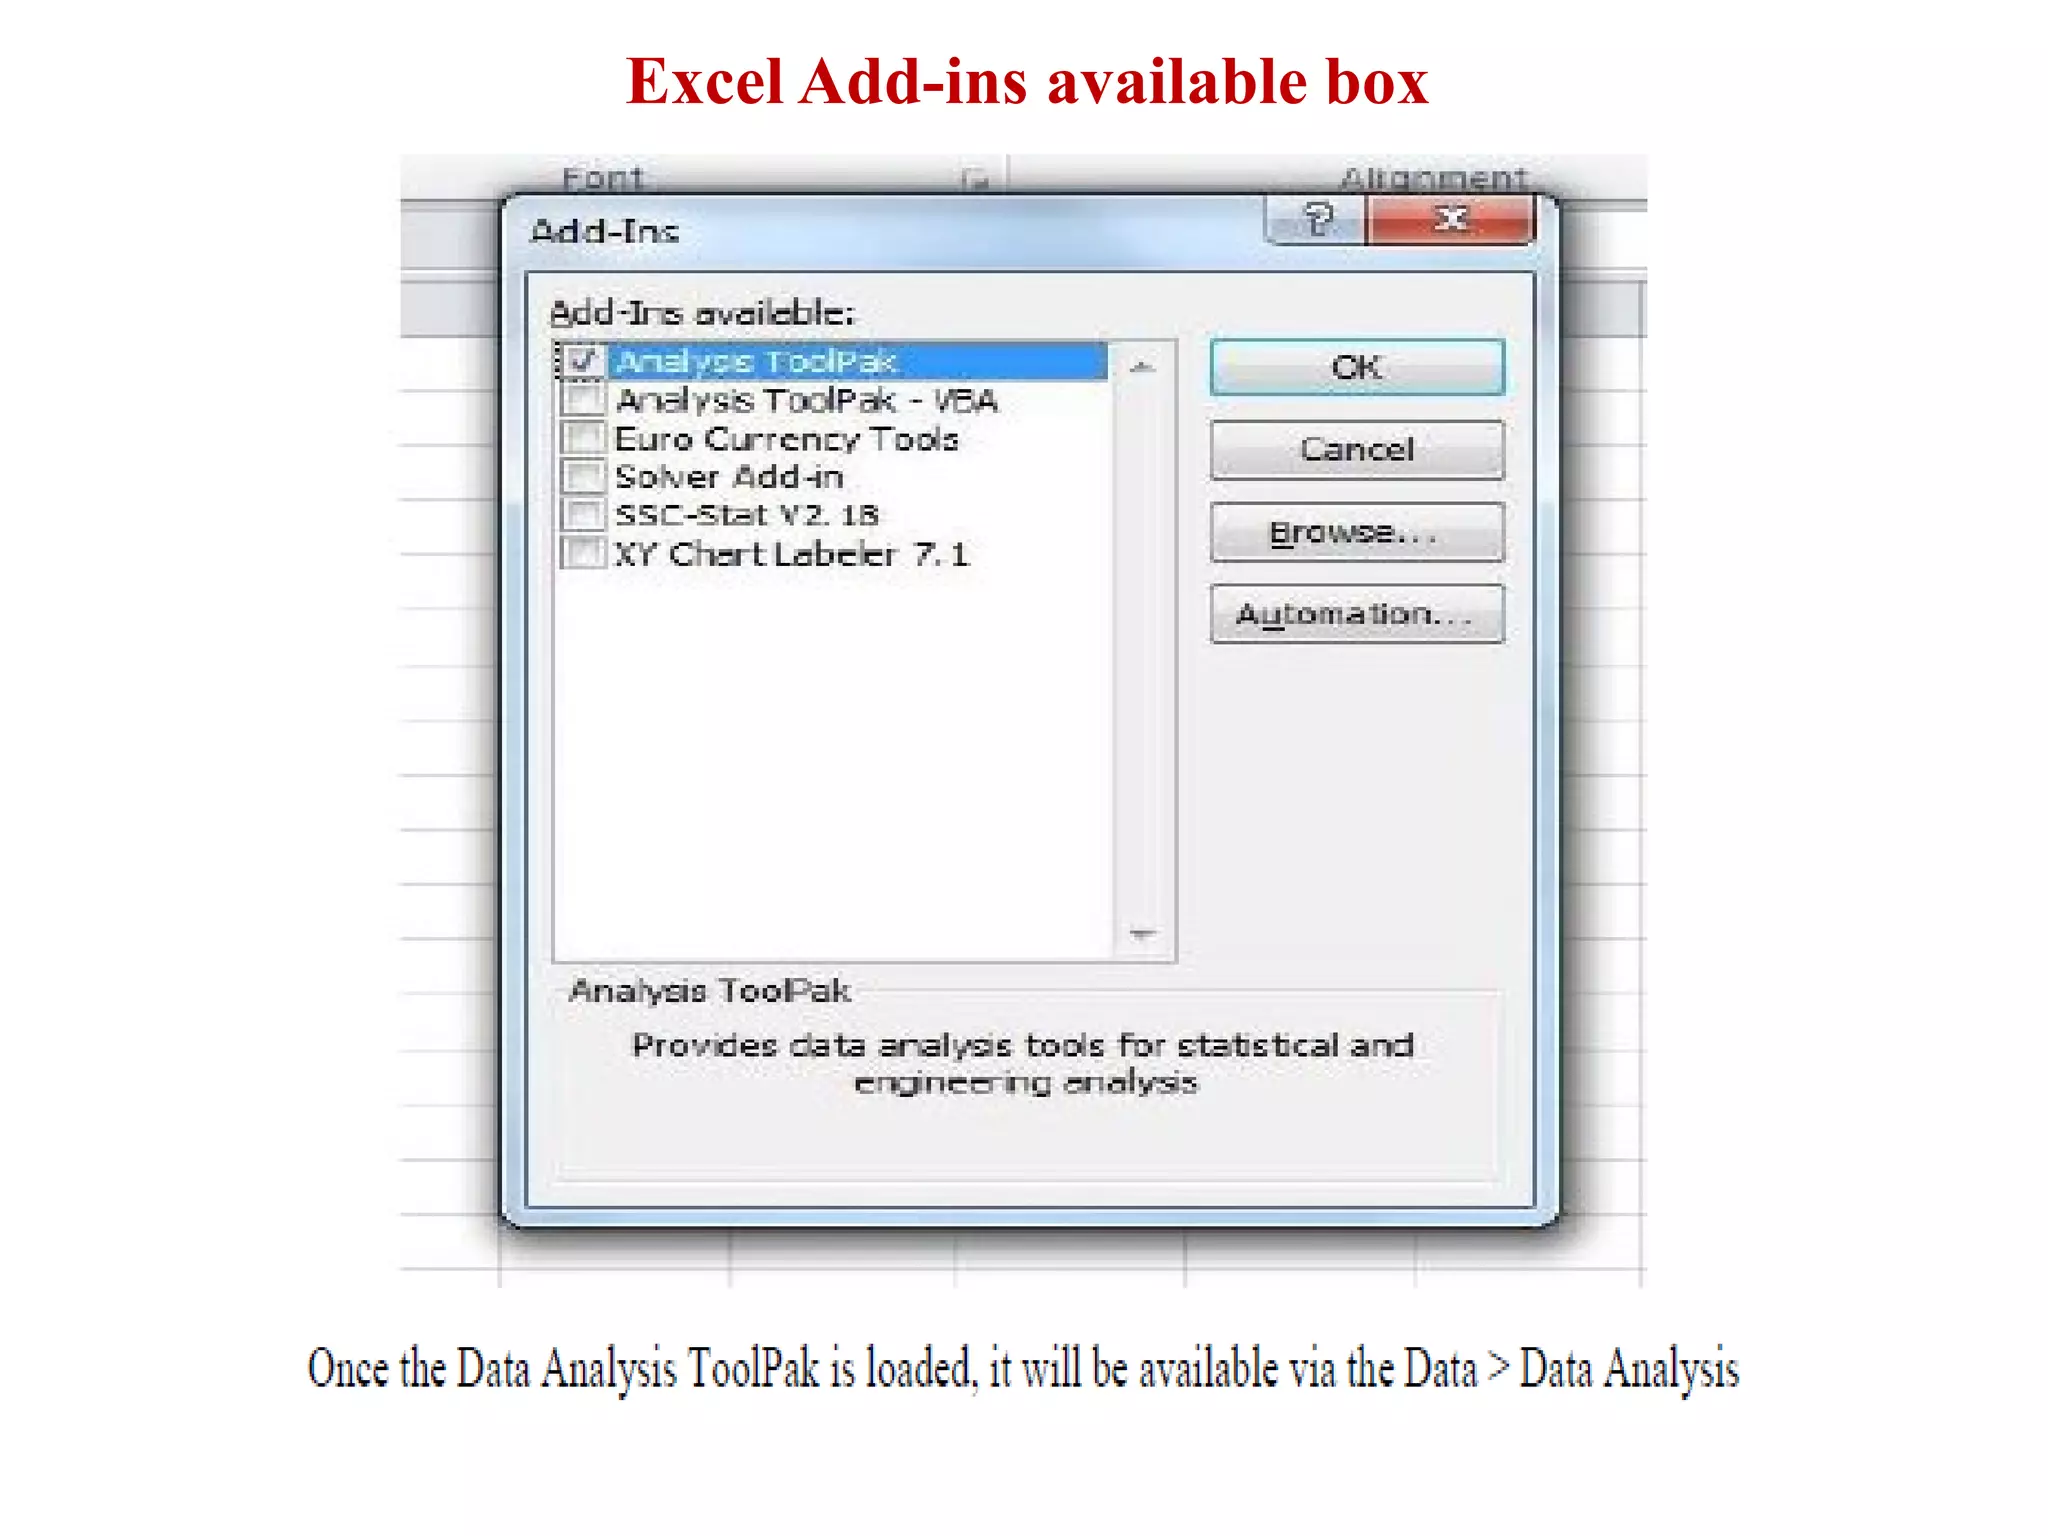
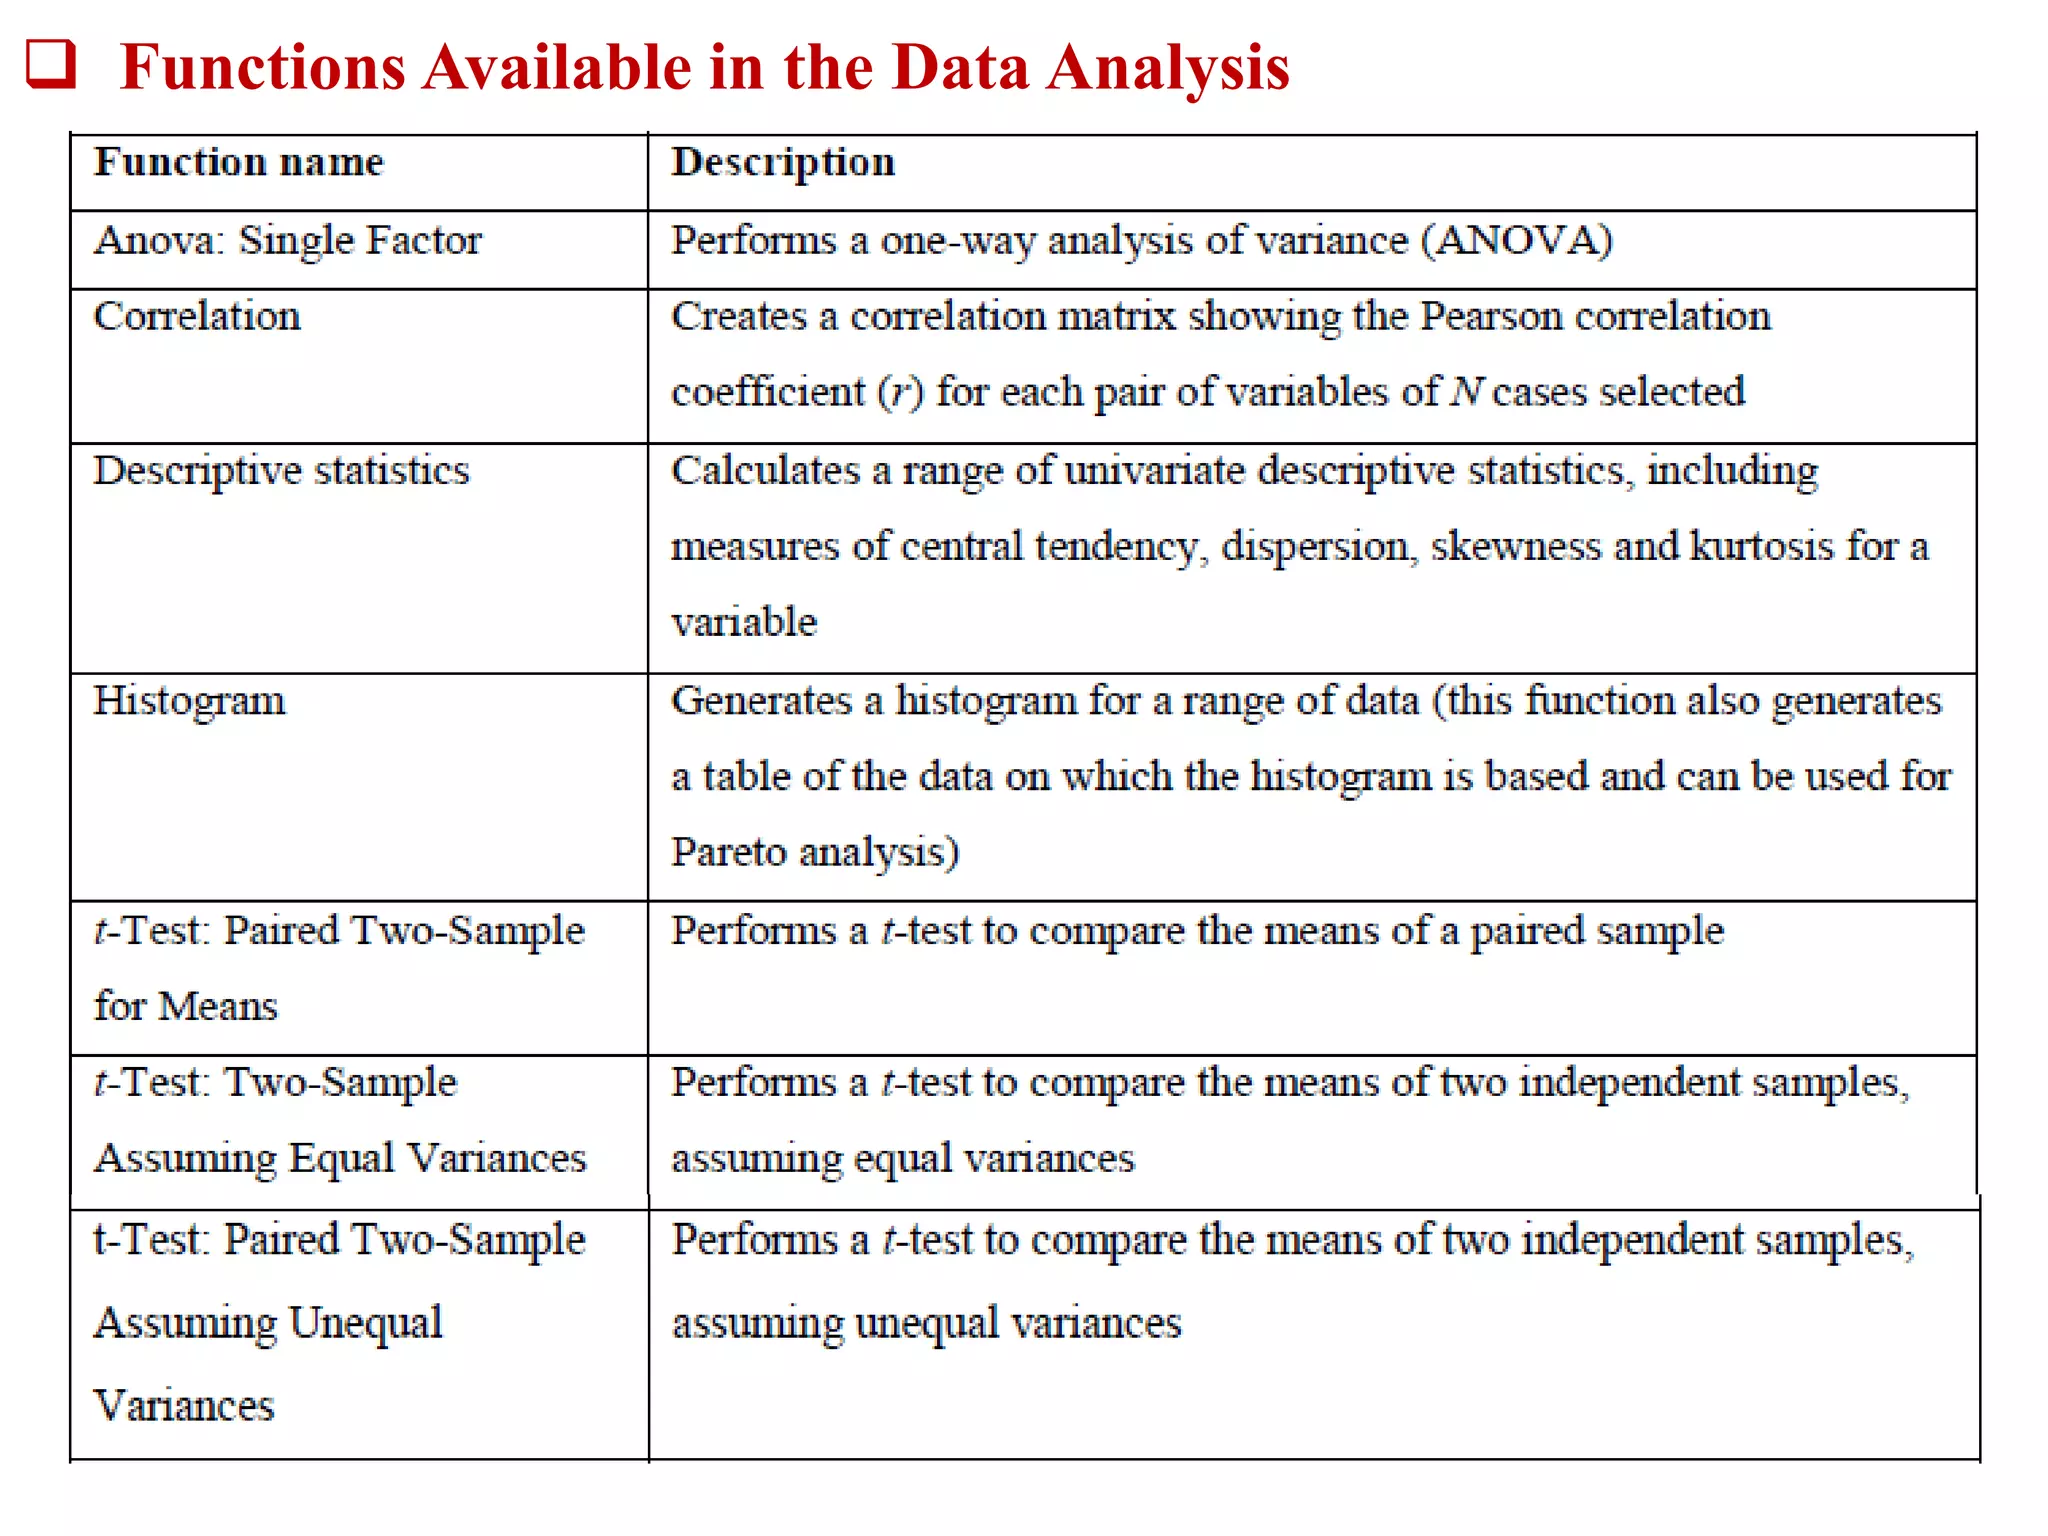
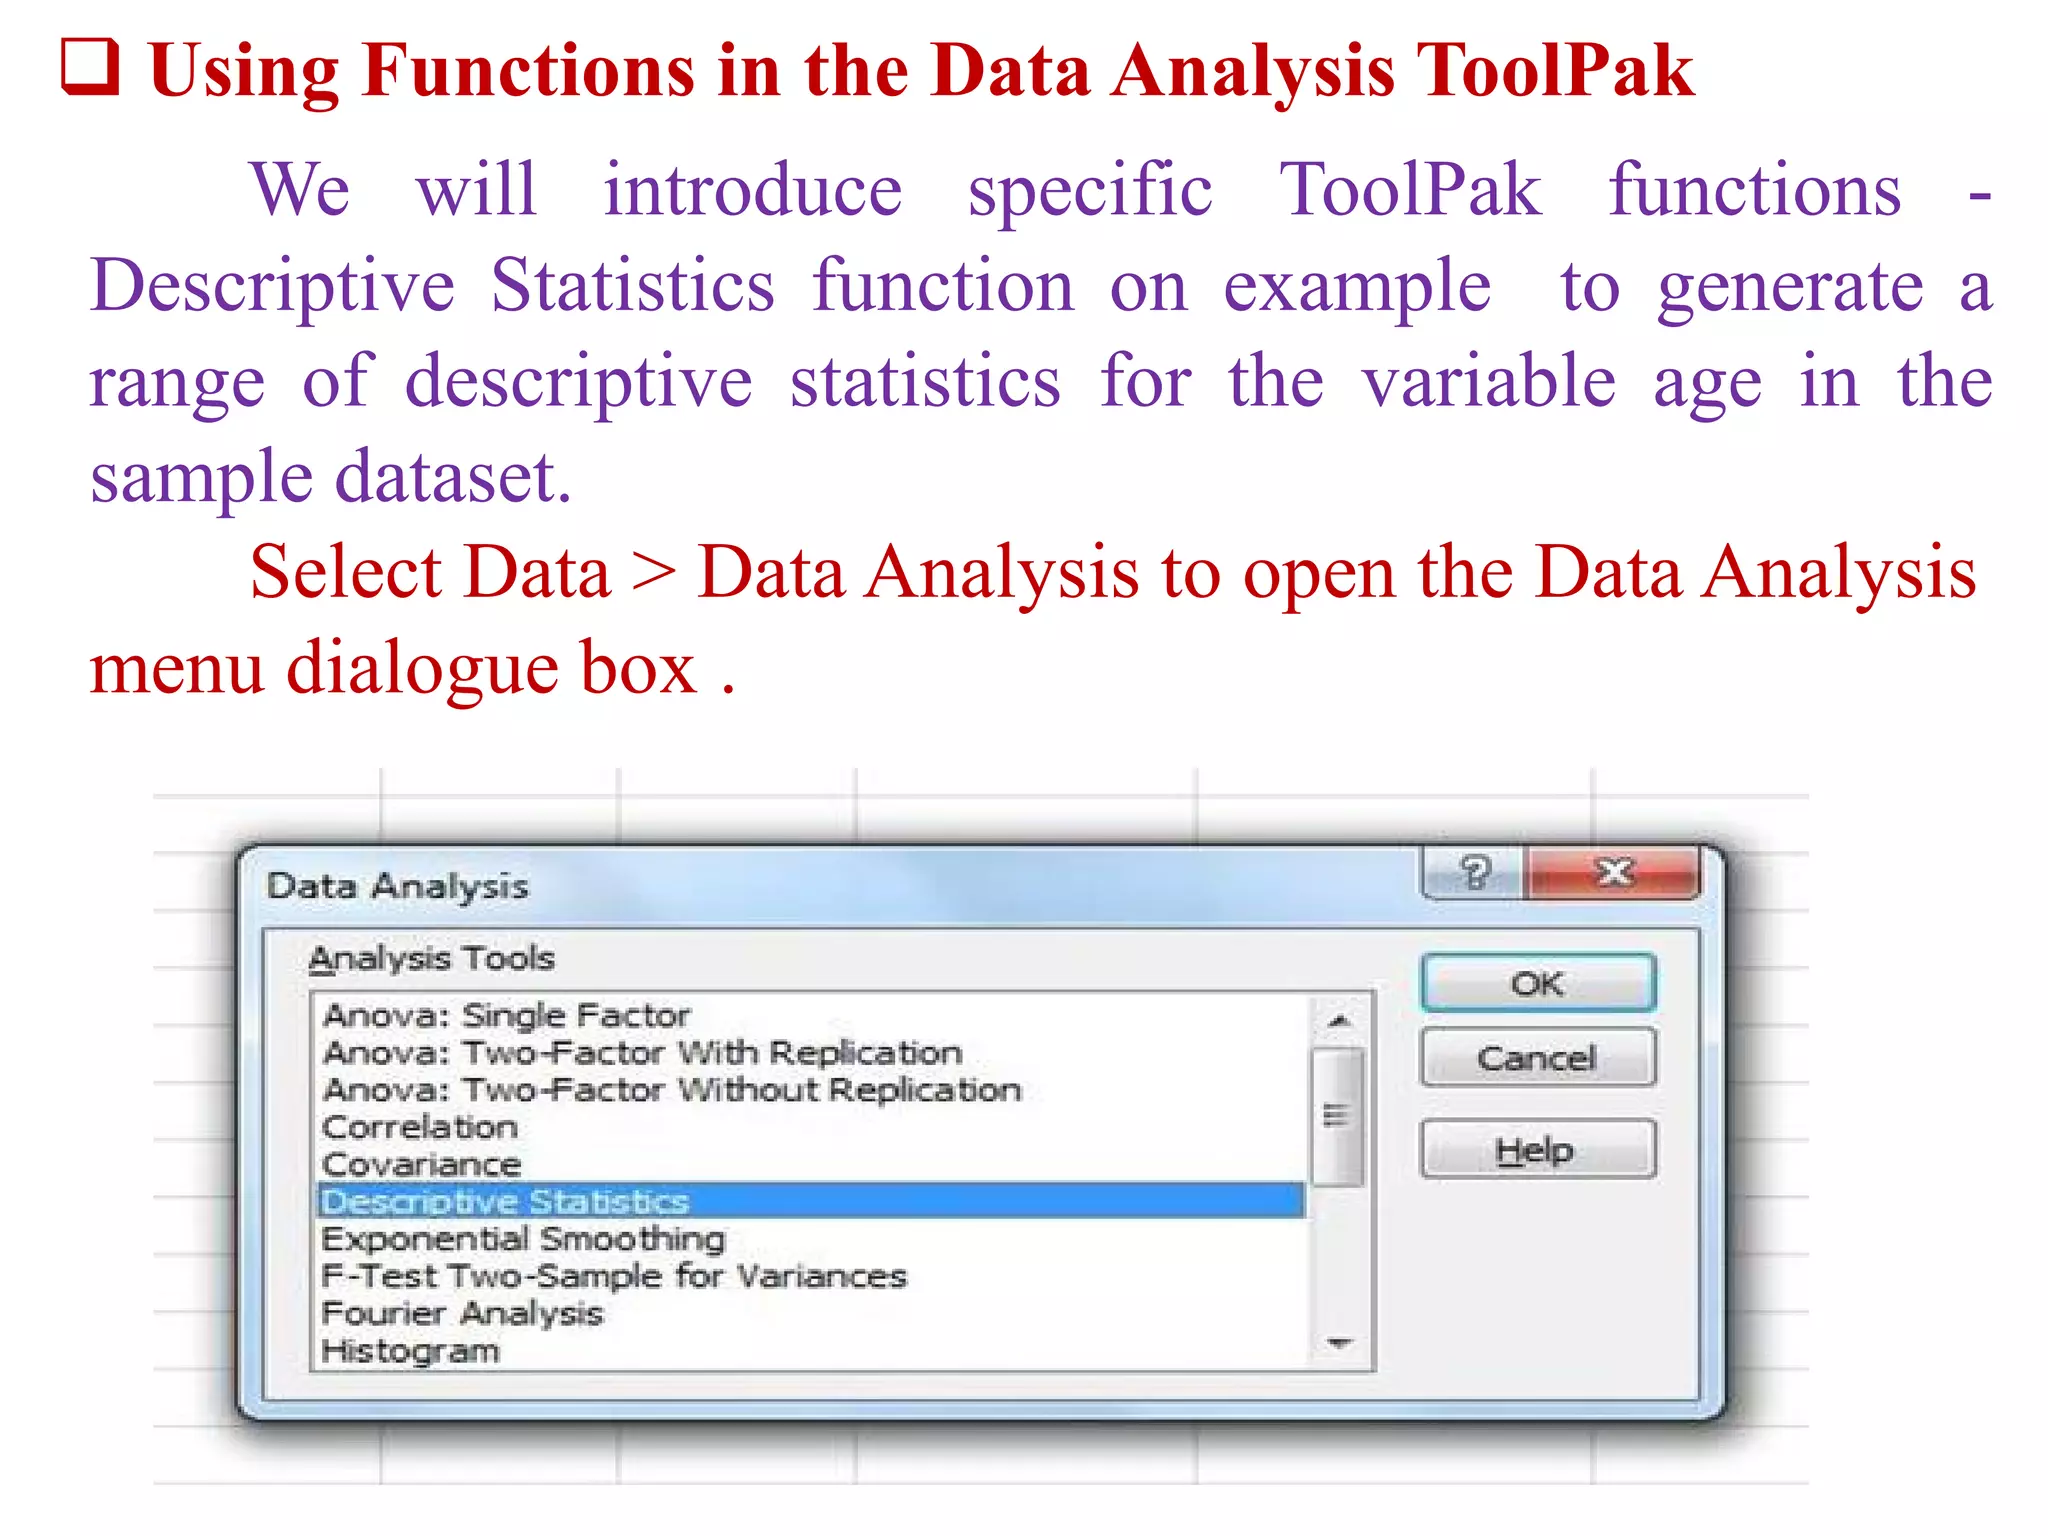
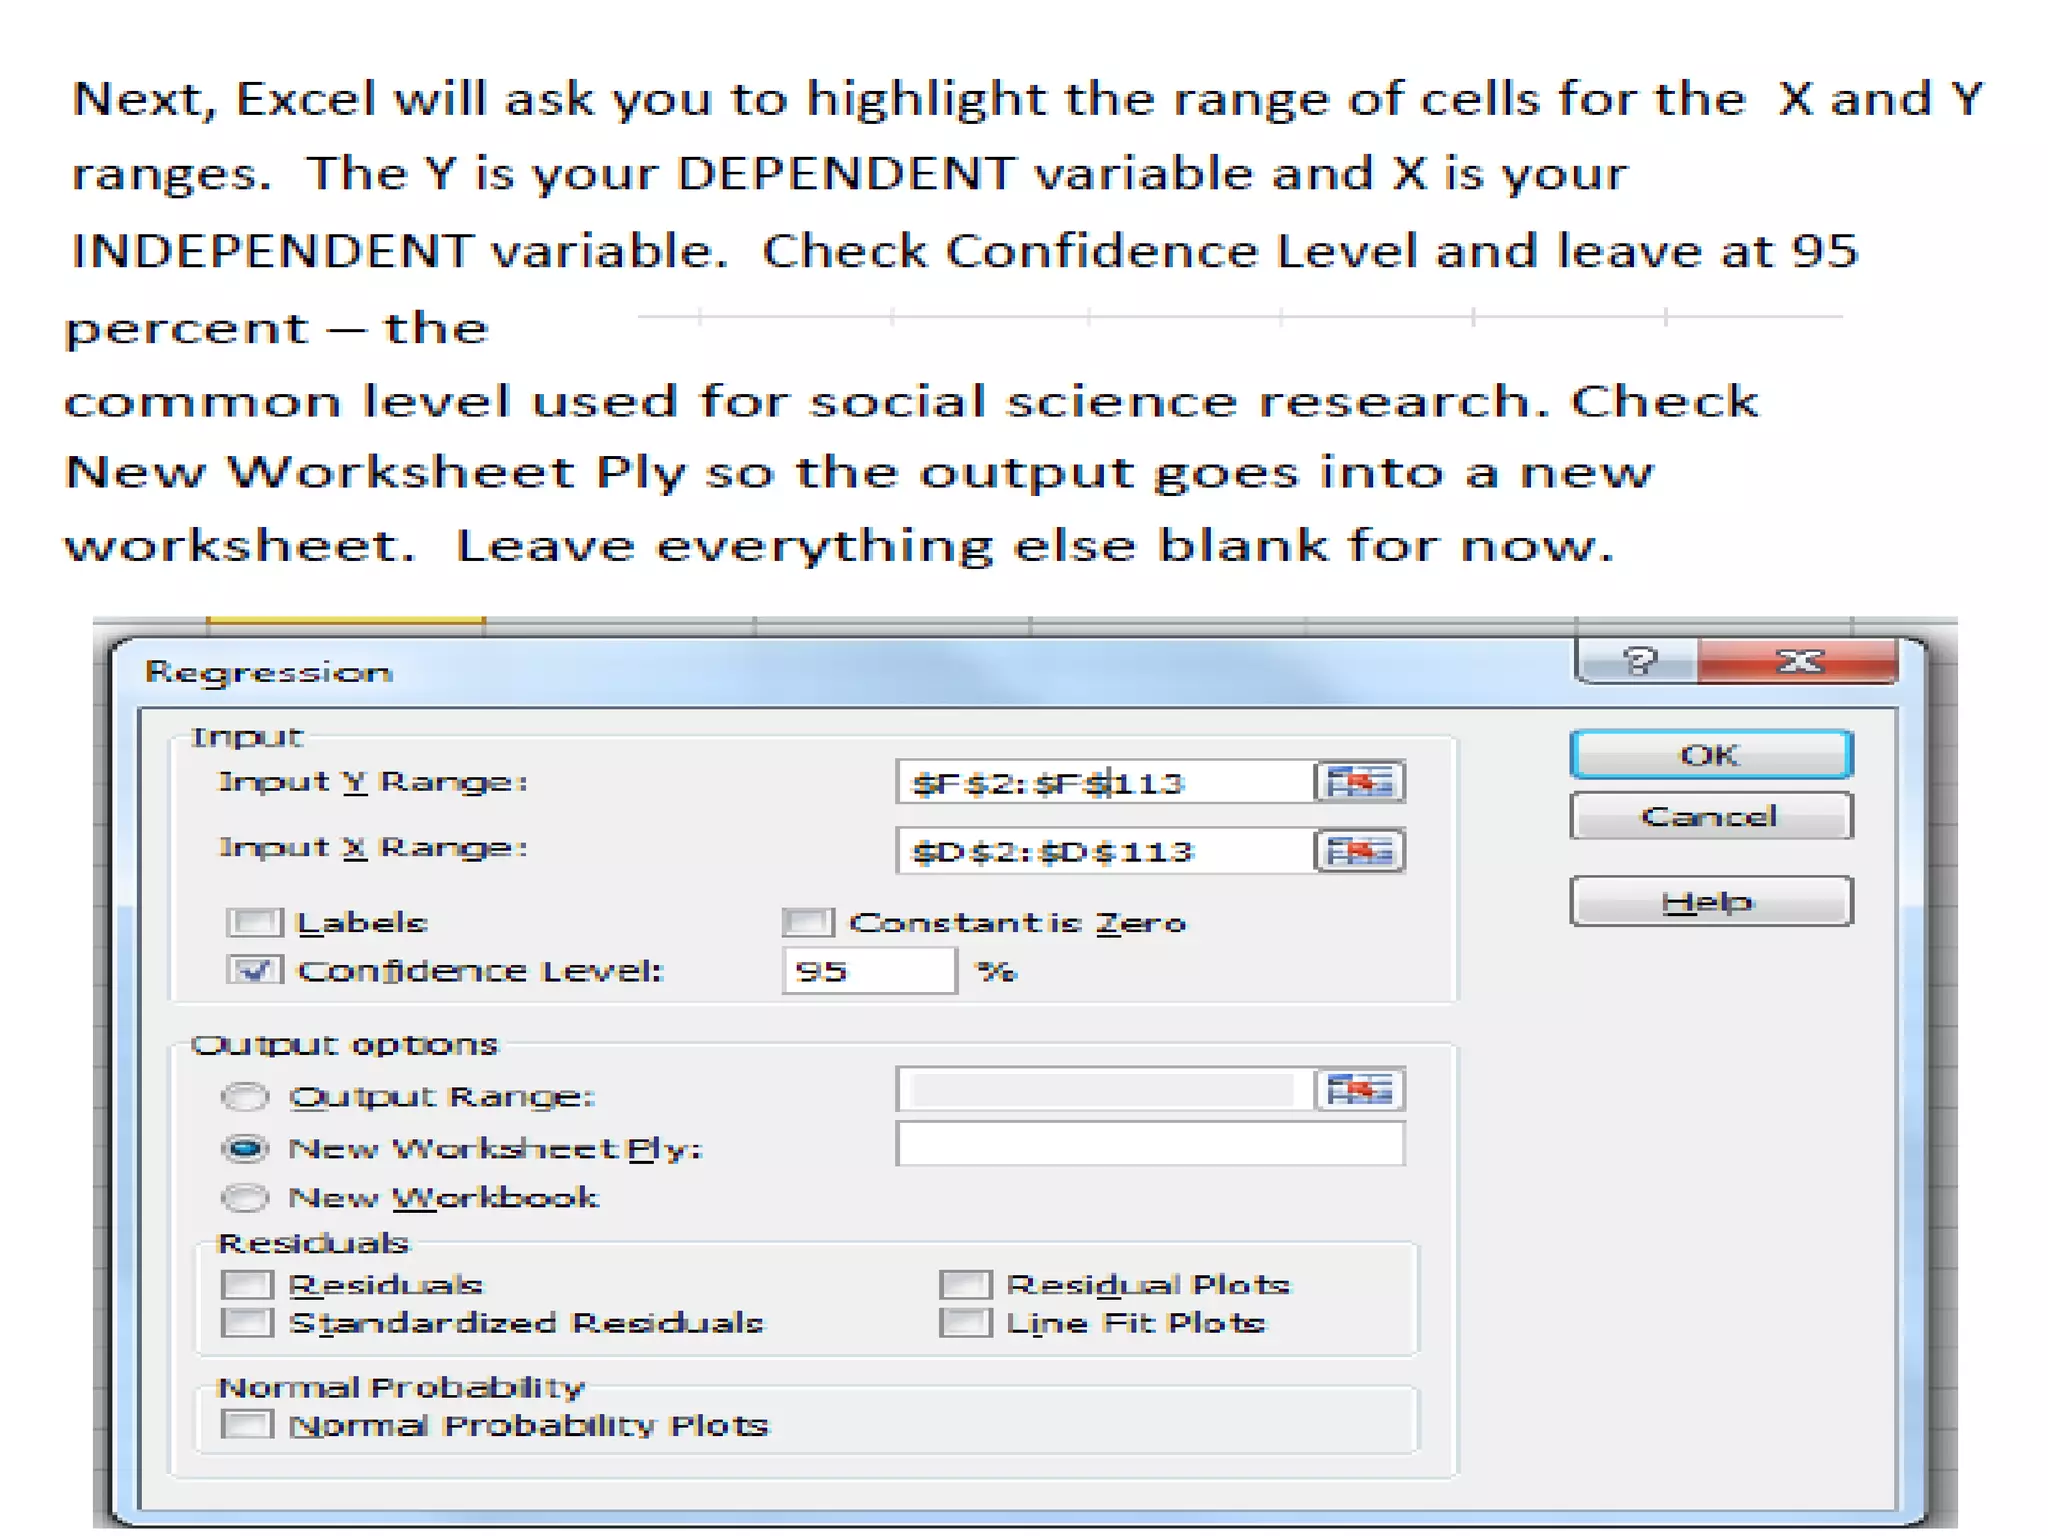
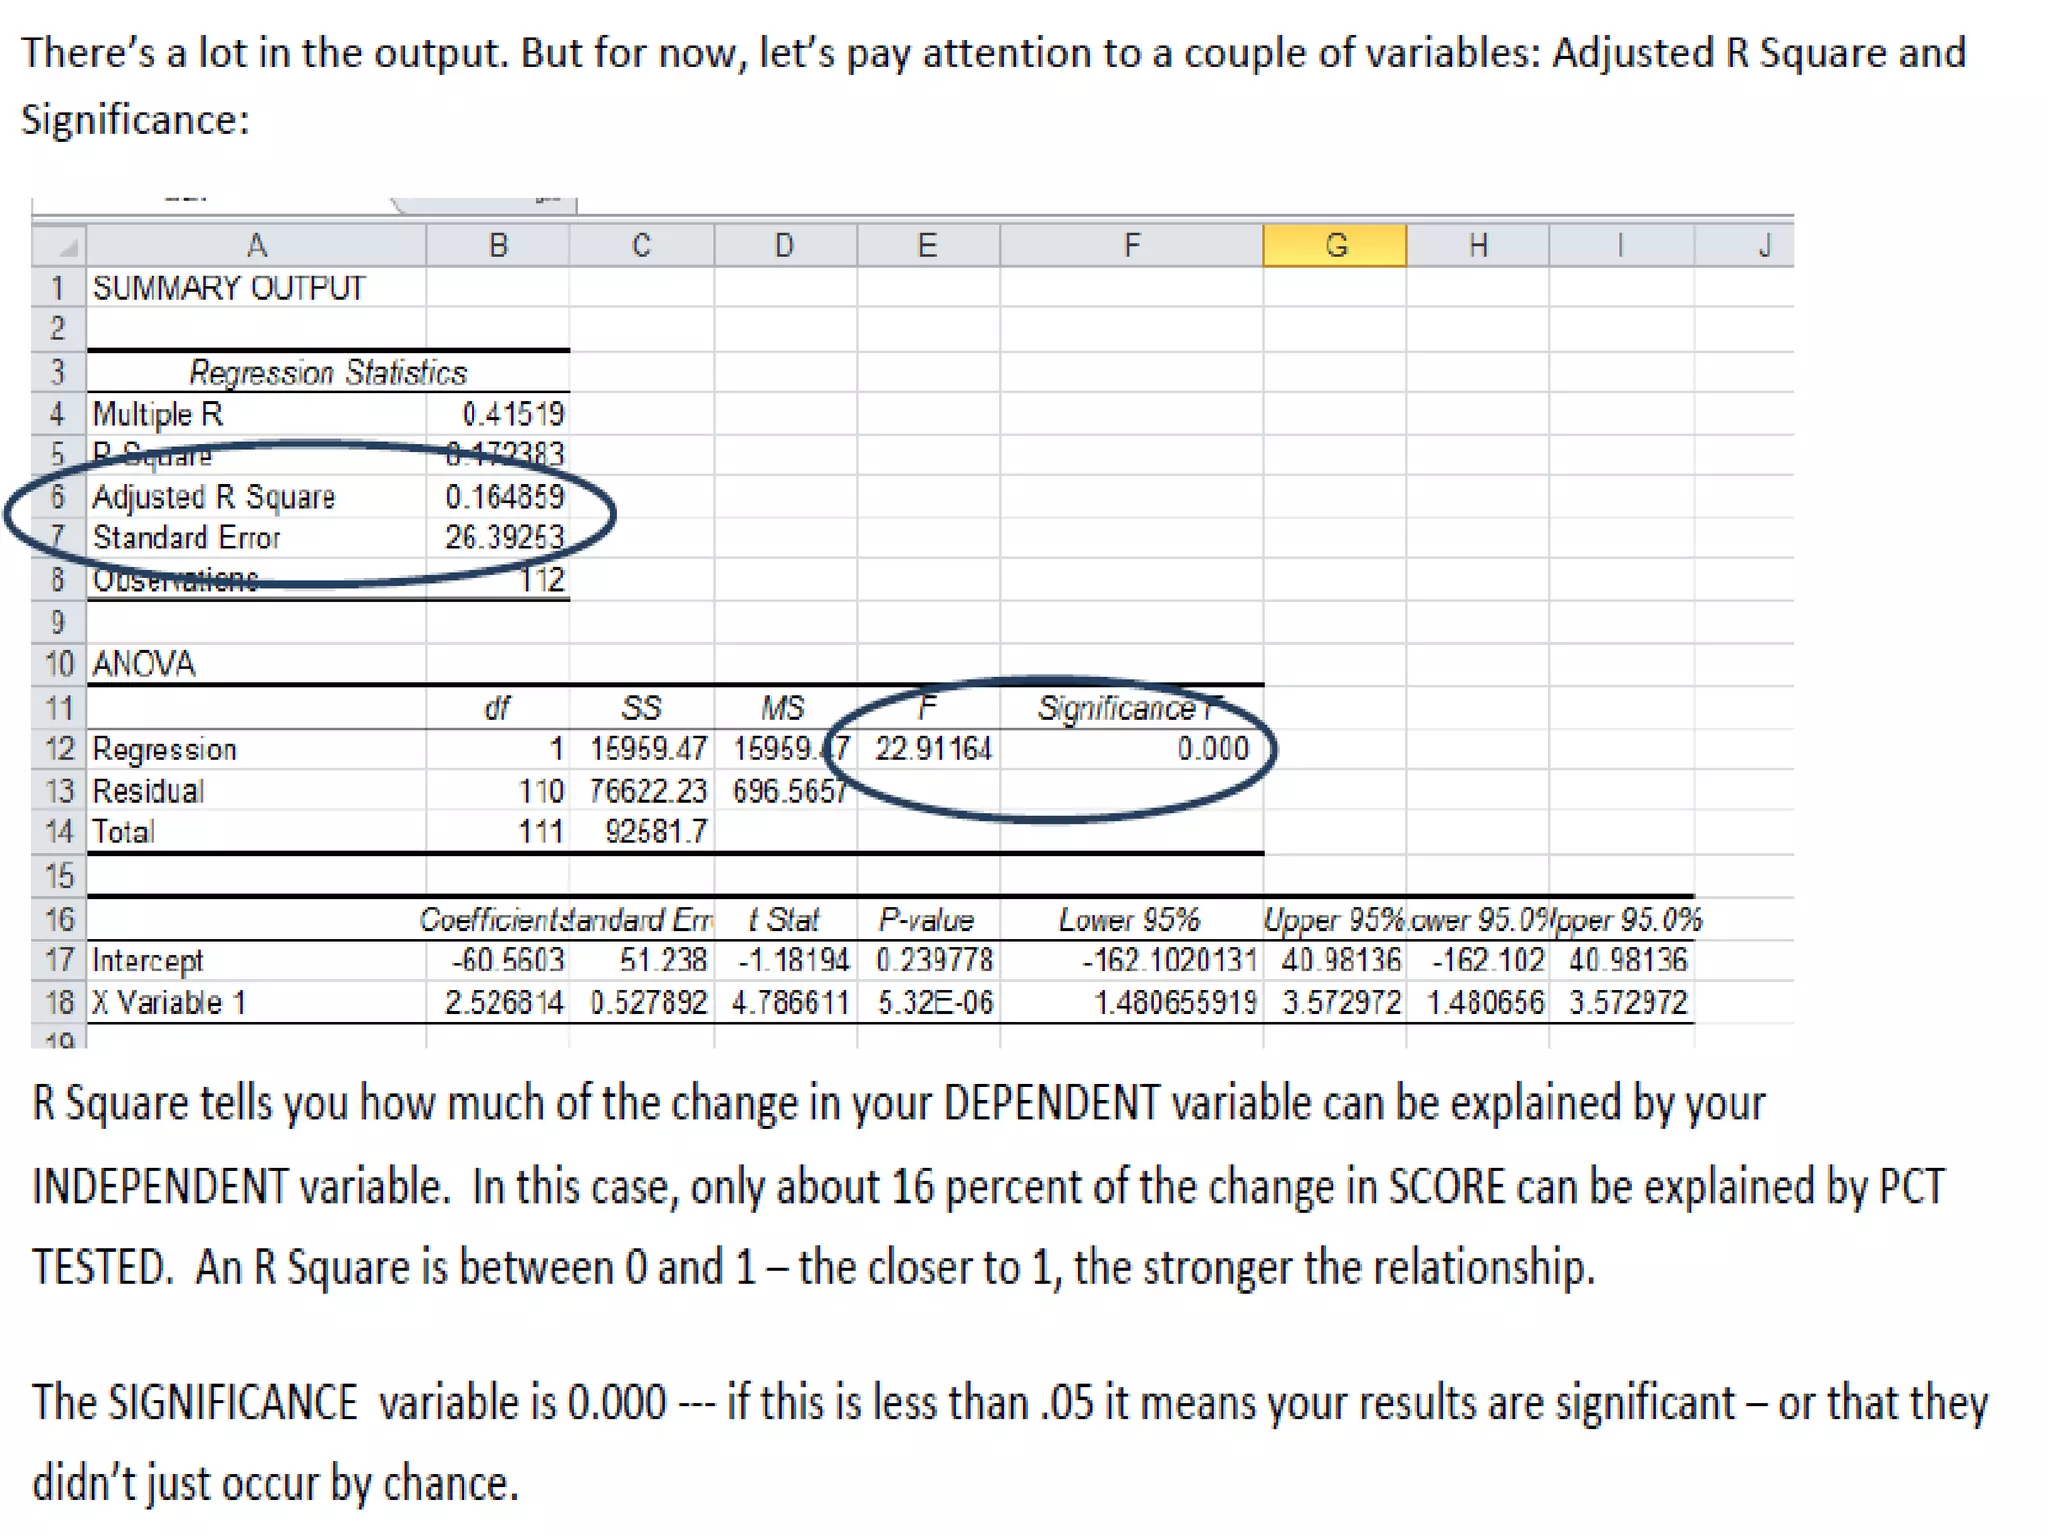
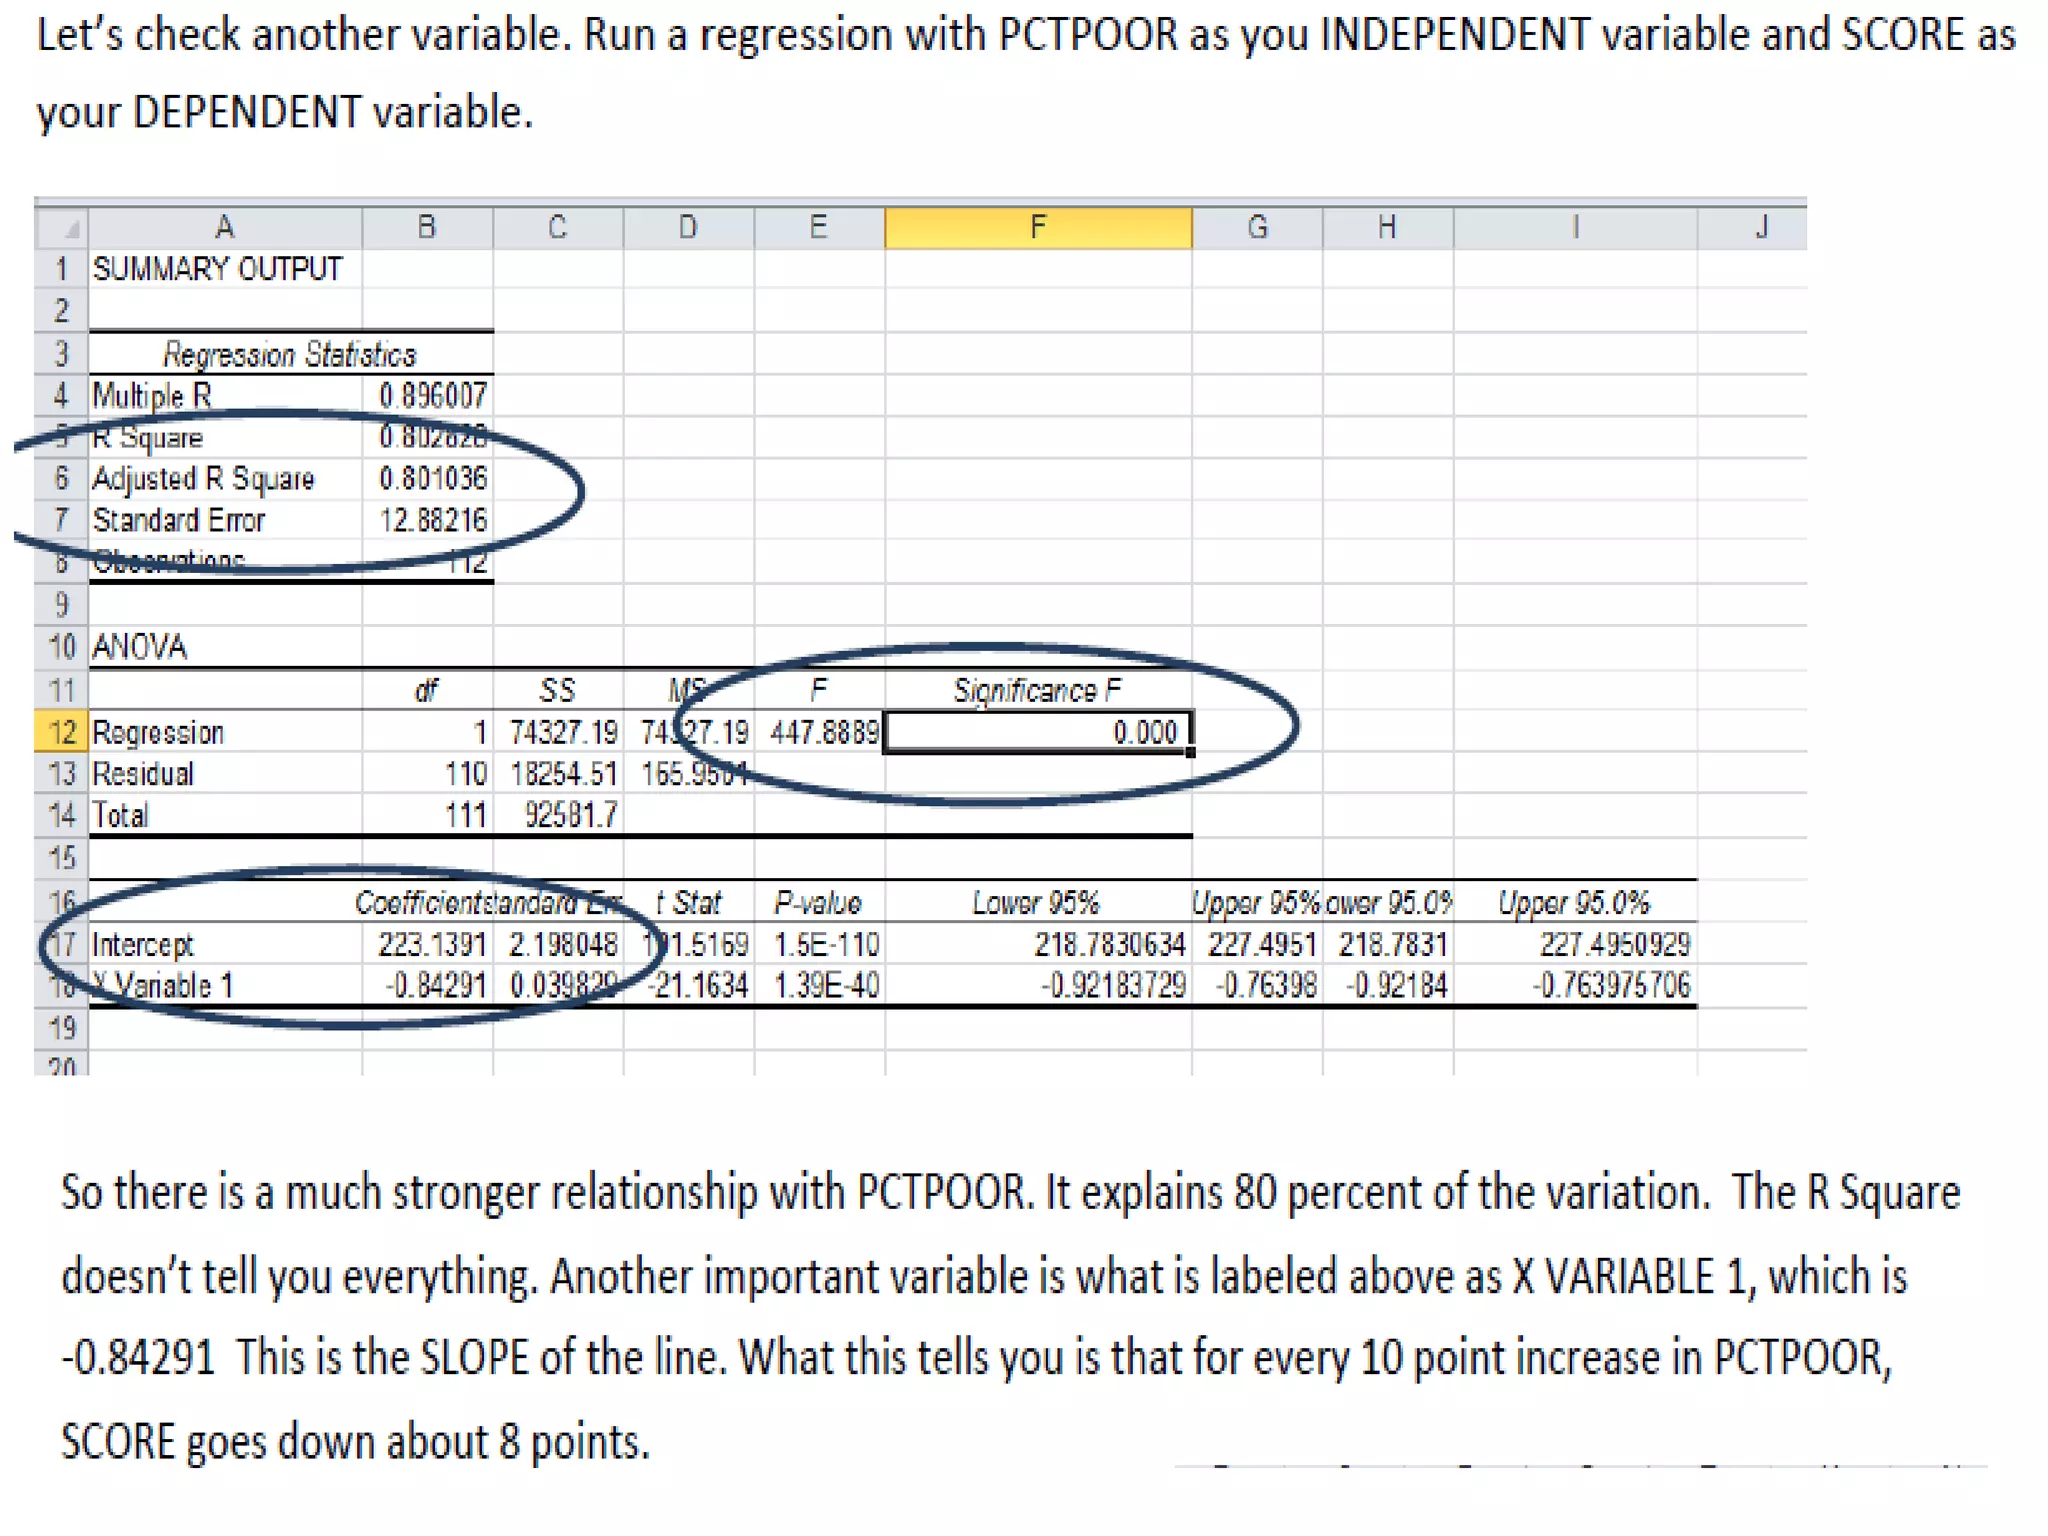
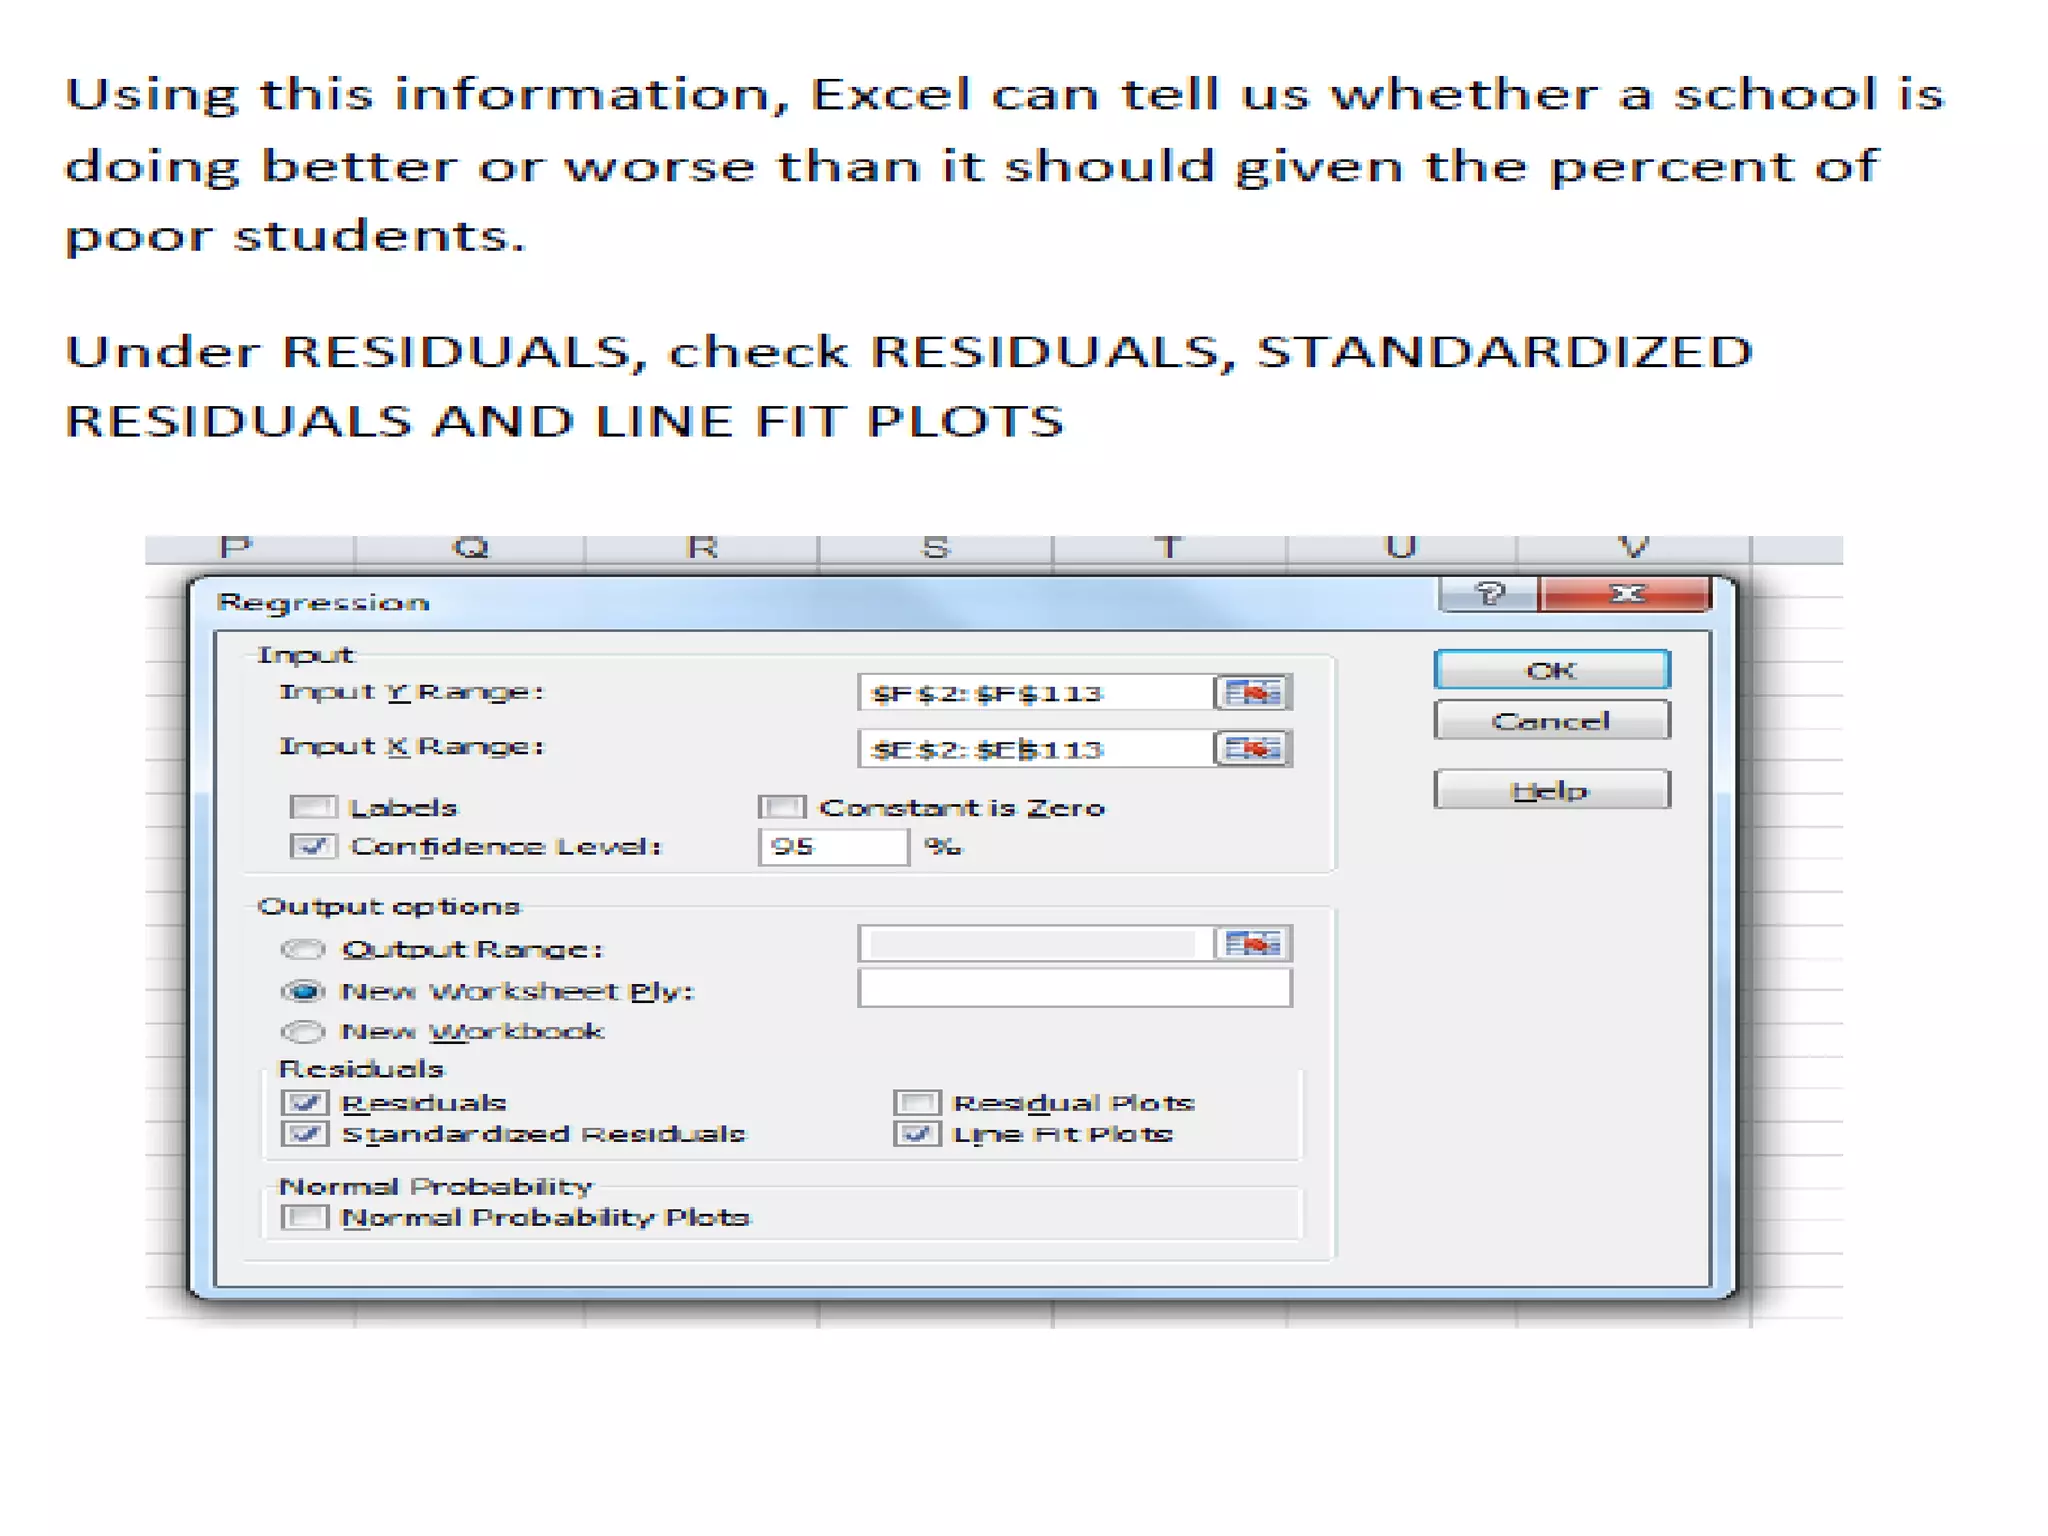
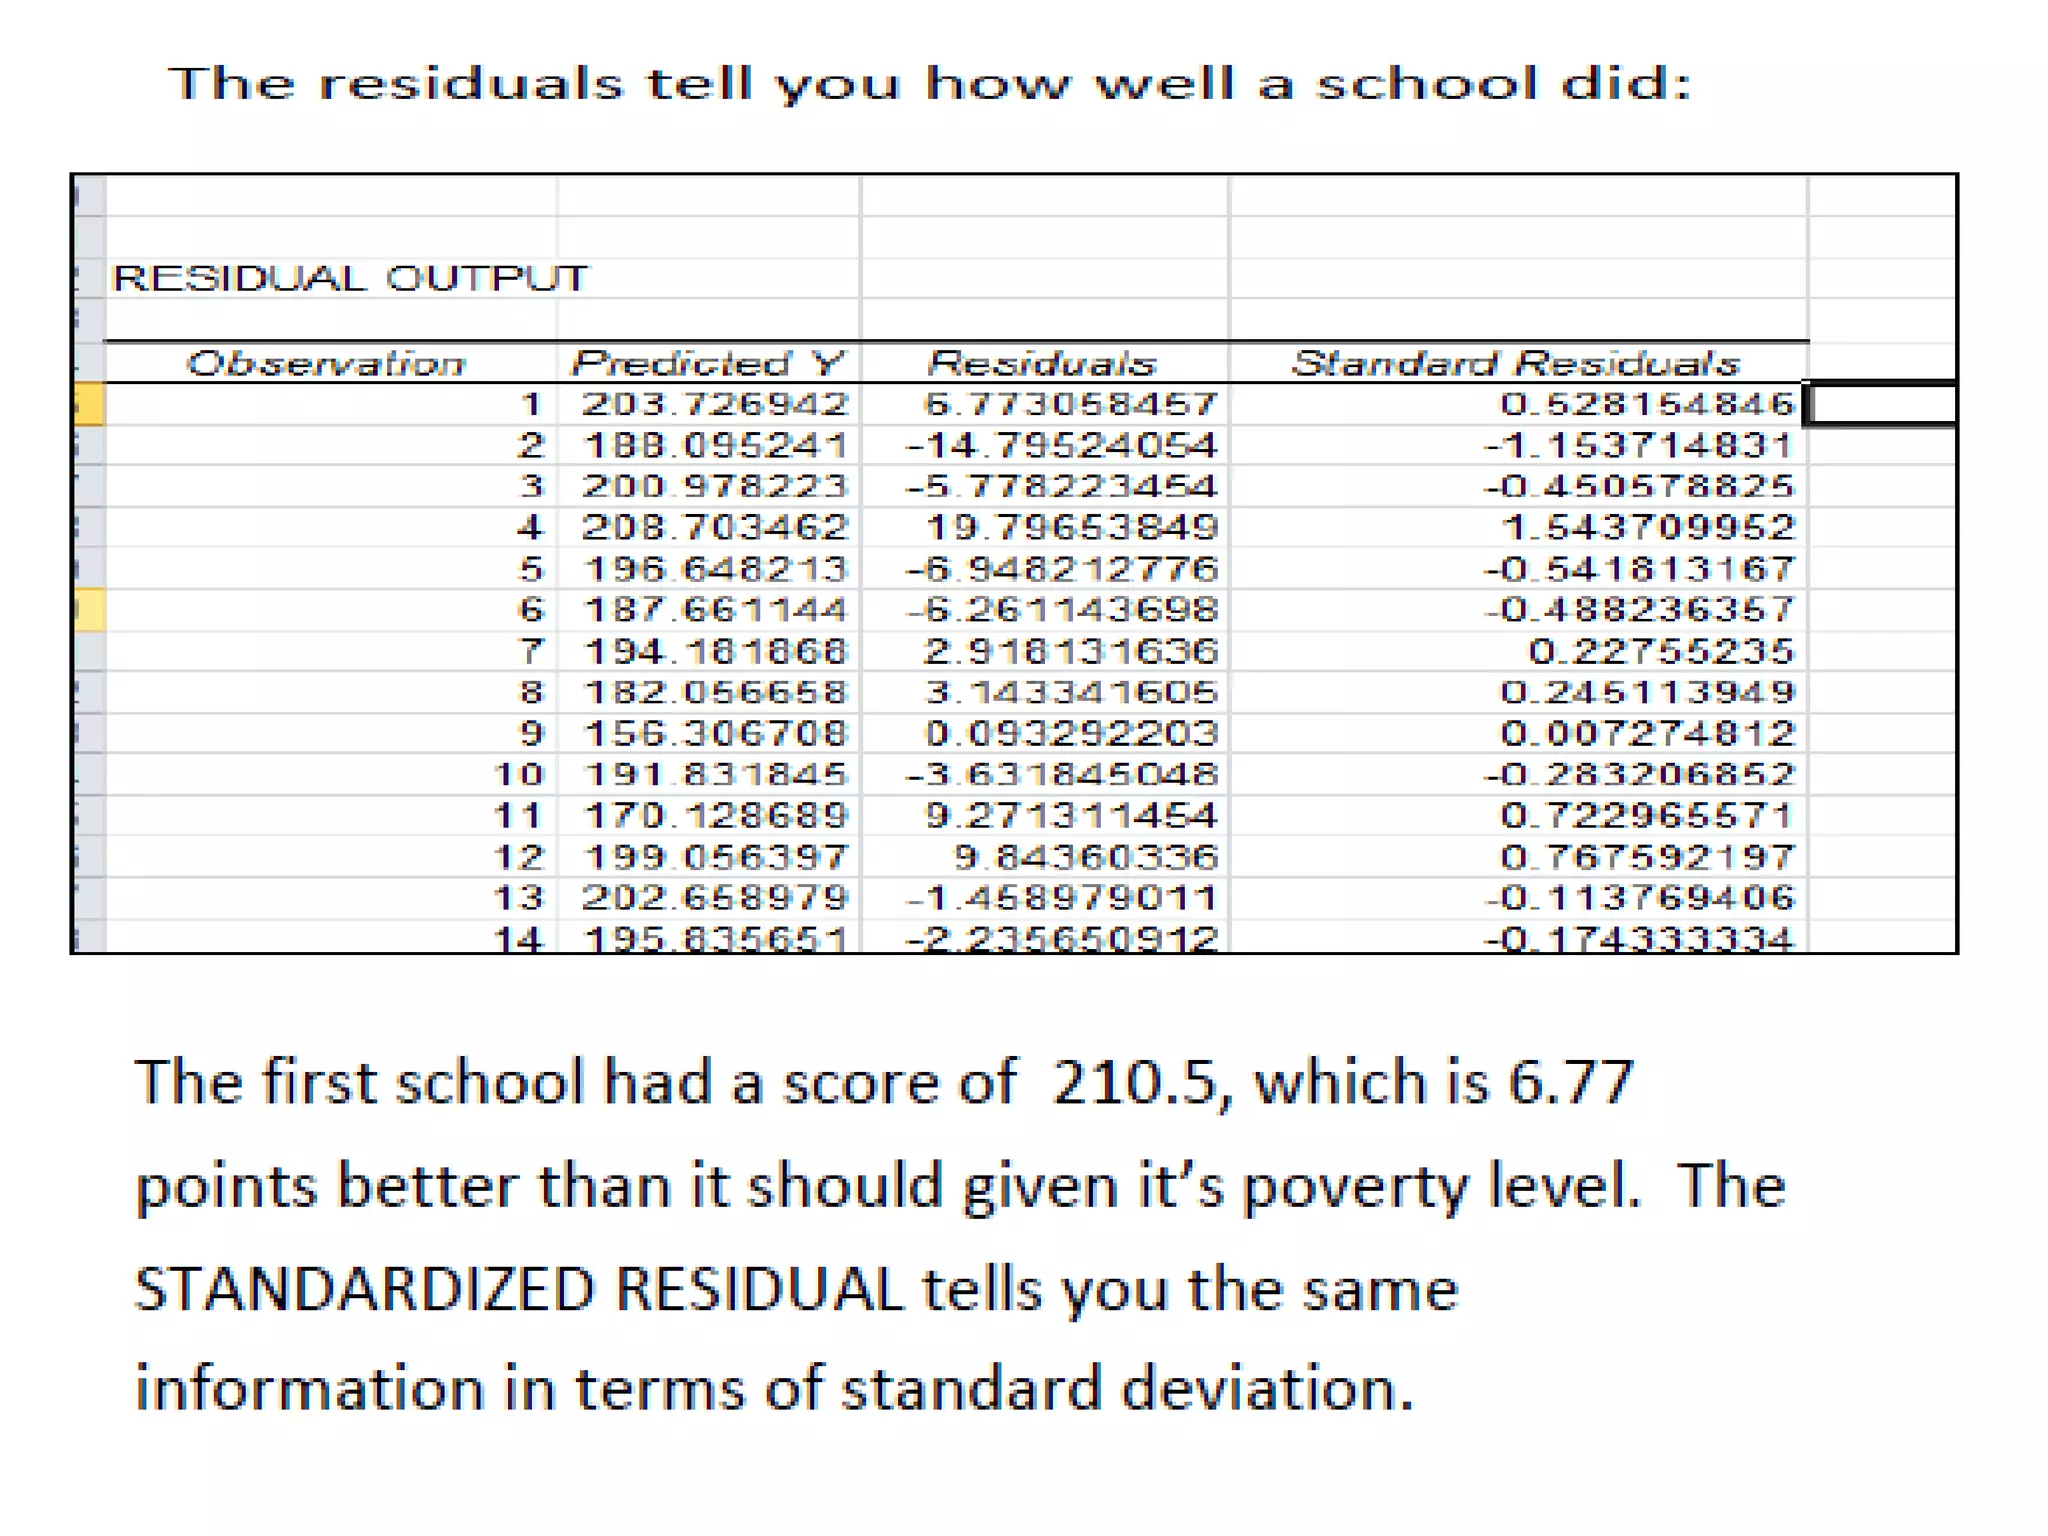
This document provides an introduction to using Microsoft Excel for quantitative data analysis. It discusses key features in Excel that are useful for research projects, including statistical functions, charts, pivot tables, and the Data Analysis ToolPak add-in. The document explains how to set up data in Excel, calculate summaries and descriptive statistics using functions, load and use the Data Analysis ToolPak to run inferential statistics, and presents some limitations of Excel for statistical analysis.