Mastering Microsoft Excel — From Basics to Brilliance.pptx
1.
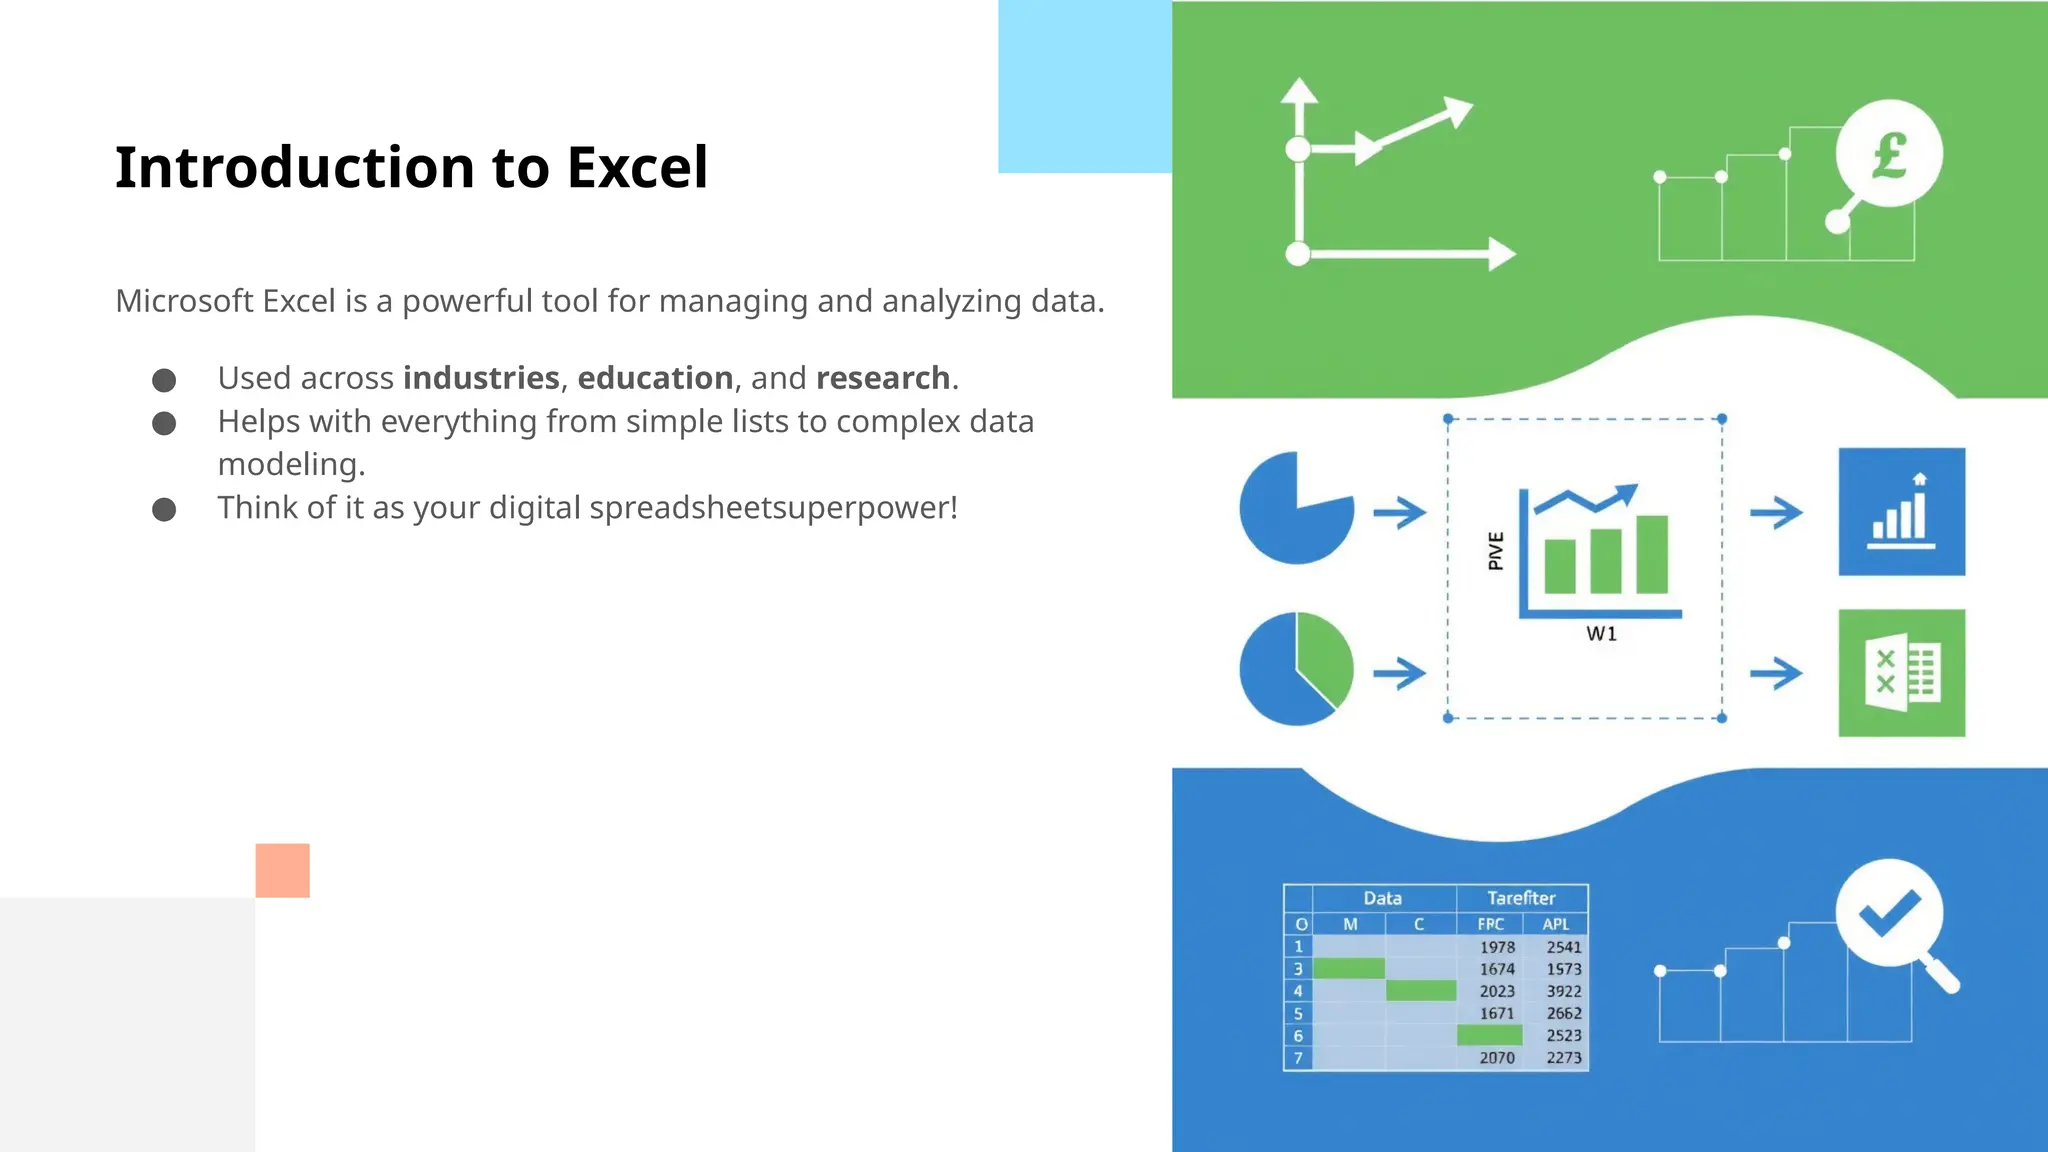
Introduction to Excel
MicrosoftExcel is a powerful tool for managing and analyzing data.
● Used across industries, education, and research.
● Helps with everything from simple lists to complex data
modeling.
● Think of it as your digital spreadsheetsuperpower!
2.
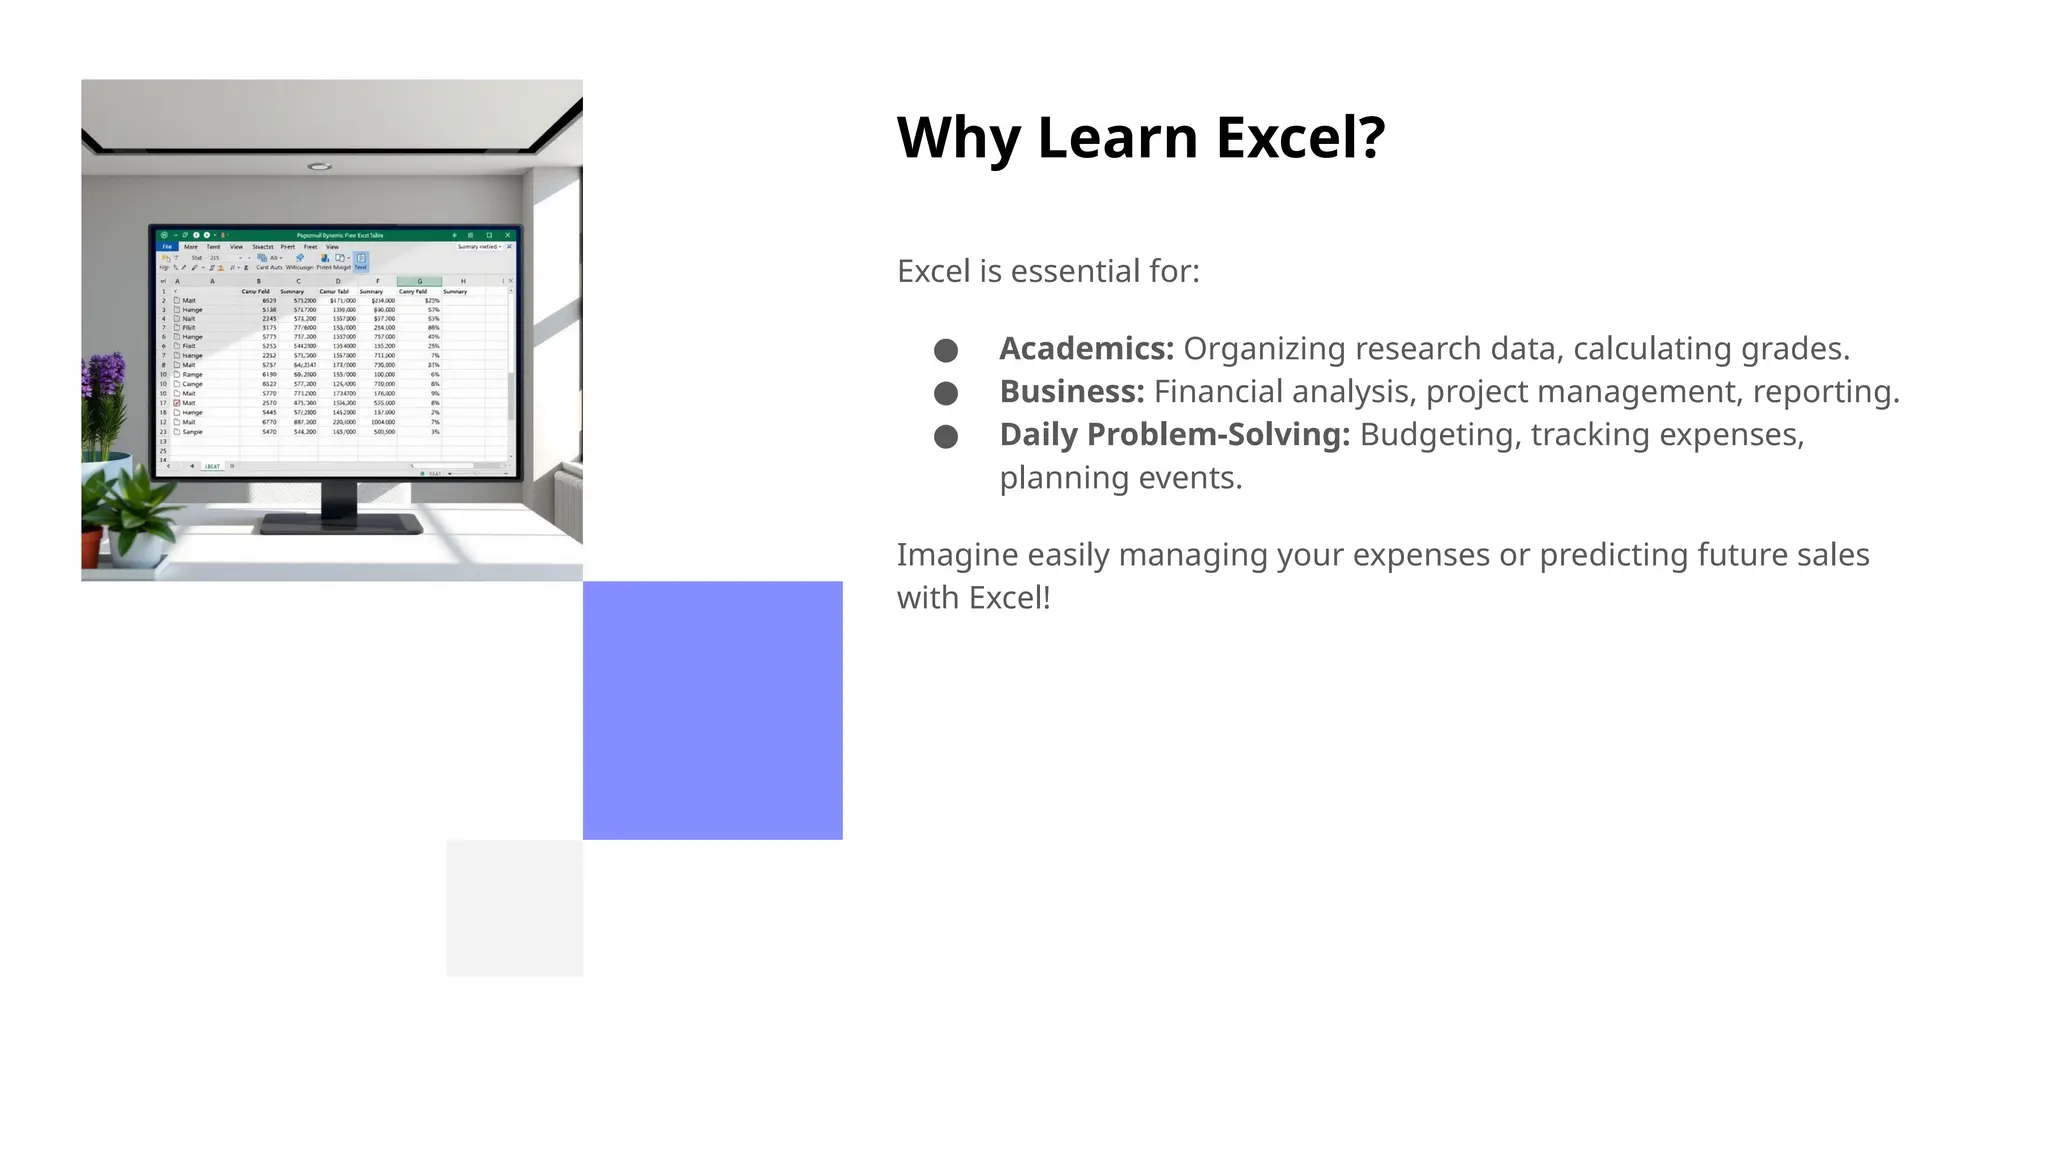
Why Learn Excel?
Excelis essential for:
● Academics: Organizing research data, calculating grades.
● Business: Financial analysis, project management, reporting.
● Daily Problem-Solving: Budgeting, tracking expenses,
planning events.
Imagine easily managing your expenses or predicting future sales
with Excel!
3.
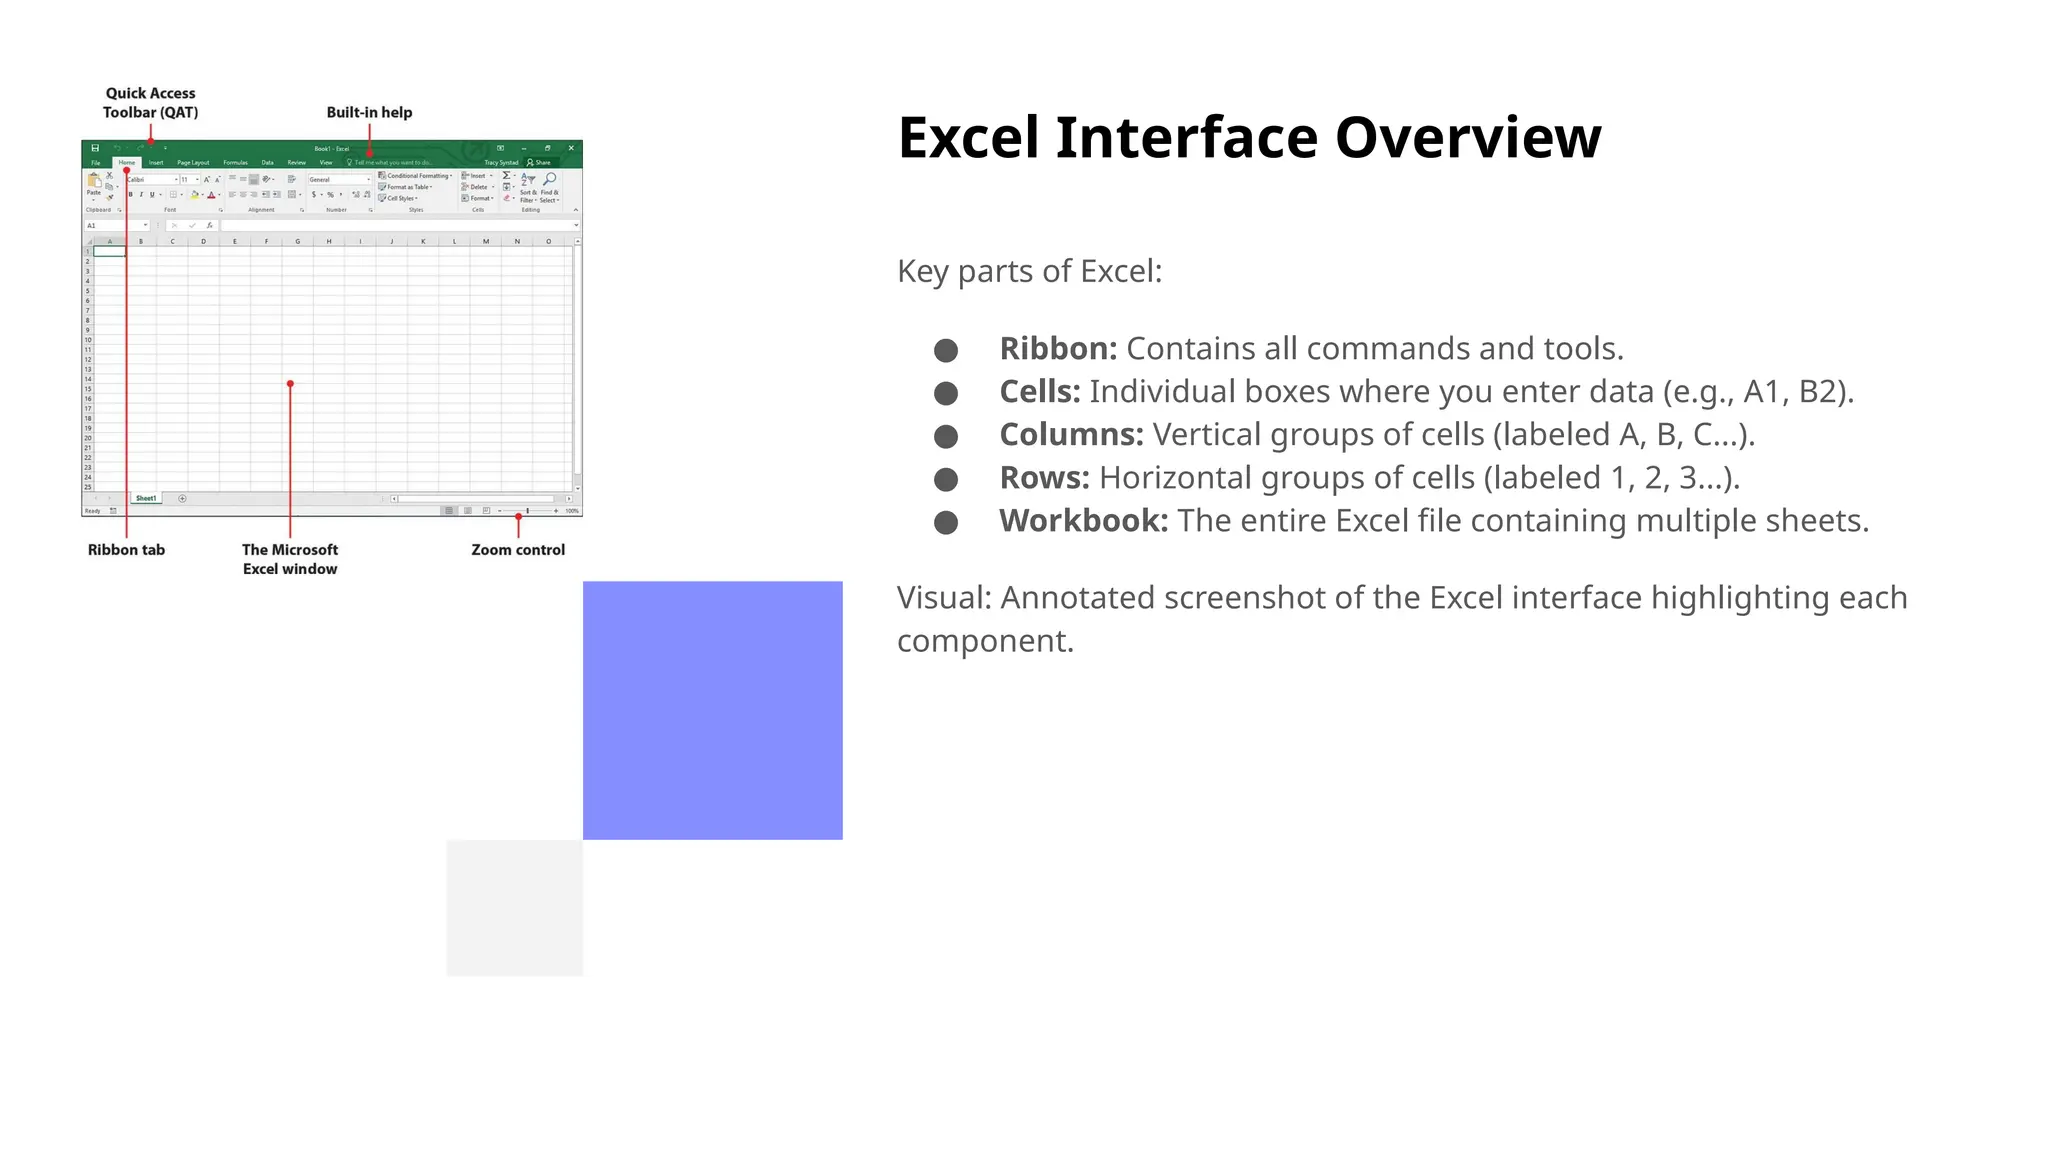
Excel Interface Overview
Keyparts of Excel:
● Ribbon: Contains all commands and tools.
● Cells: Individual boxes where you enter data (e.g., A1, B2).
● Columns: Vertical groups of cells (labeled A, B, C...).
● Rows: Horizontal groups of cells (labeled 1, 2, 3...).
● Workbook: The entire Excel file containing multiple sheets.
Visual: Annotated screenshot of the Excel interface highlighting each
component.
4.
Creating and SavingWorkbooks
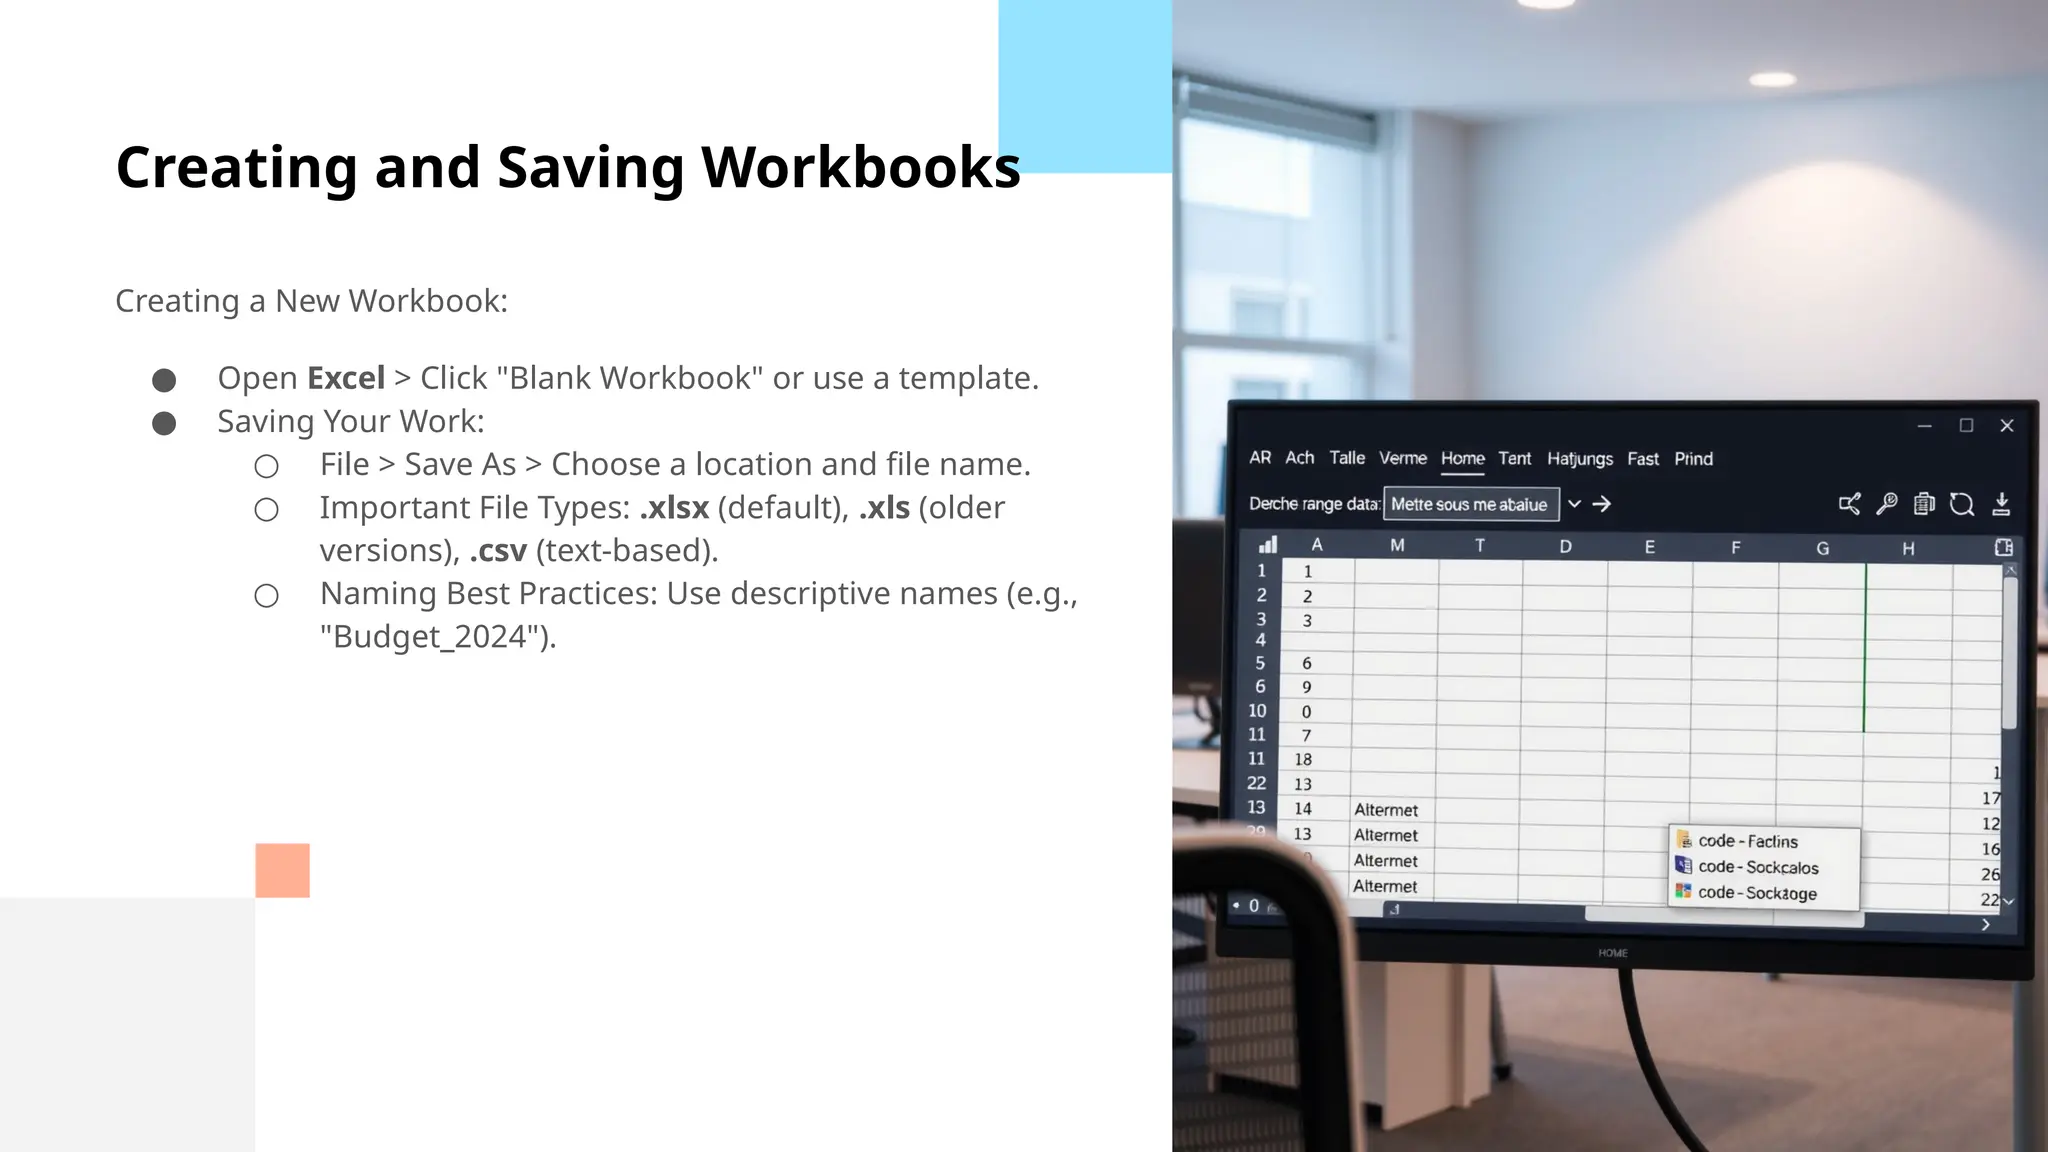
Creating a New Workbook:
● Open Excel > Click "Blank Workbook" or use a template.
● Saving Your Work:
○ File > Save As > Choose a location and file name.
○ Important File Types: .xlsx (default), .xls (older
versions), .csv (text-based).
○ Naming Best Practices: Use descriptive names (e.g.,
"Budget_2024").
5.
Basic Data Entry
EnteringData:
● Click a cell and start typing.
● Data Types: Text, Numbers, Dates.
● Difference Between Data and Formulas:
○ Data: Raw information you input.
○ Formulas: Instructions that perform calculations (=A1+B1).
6.
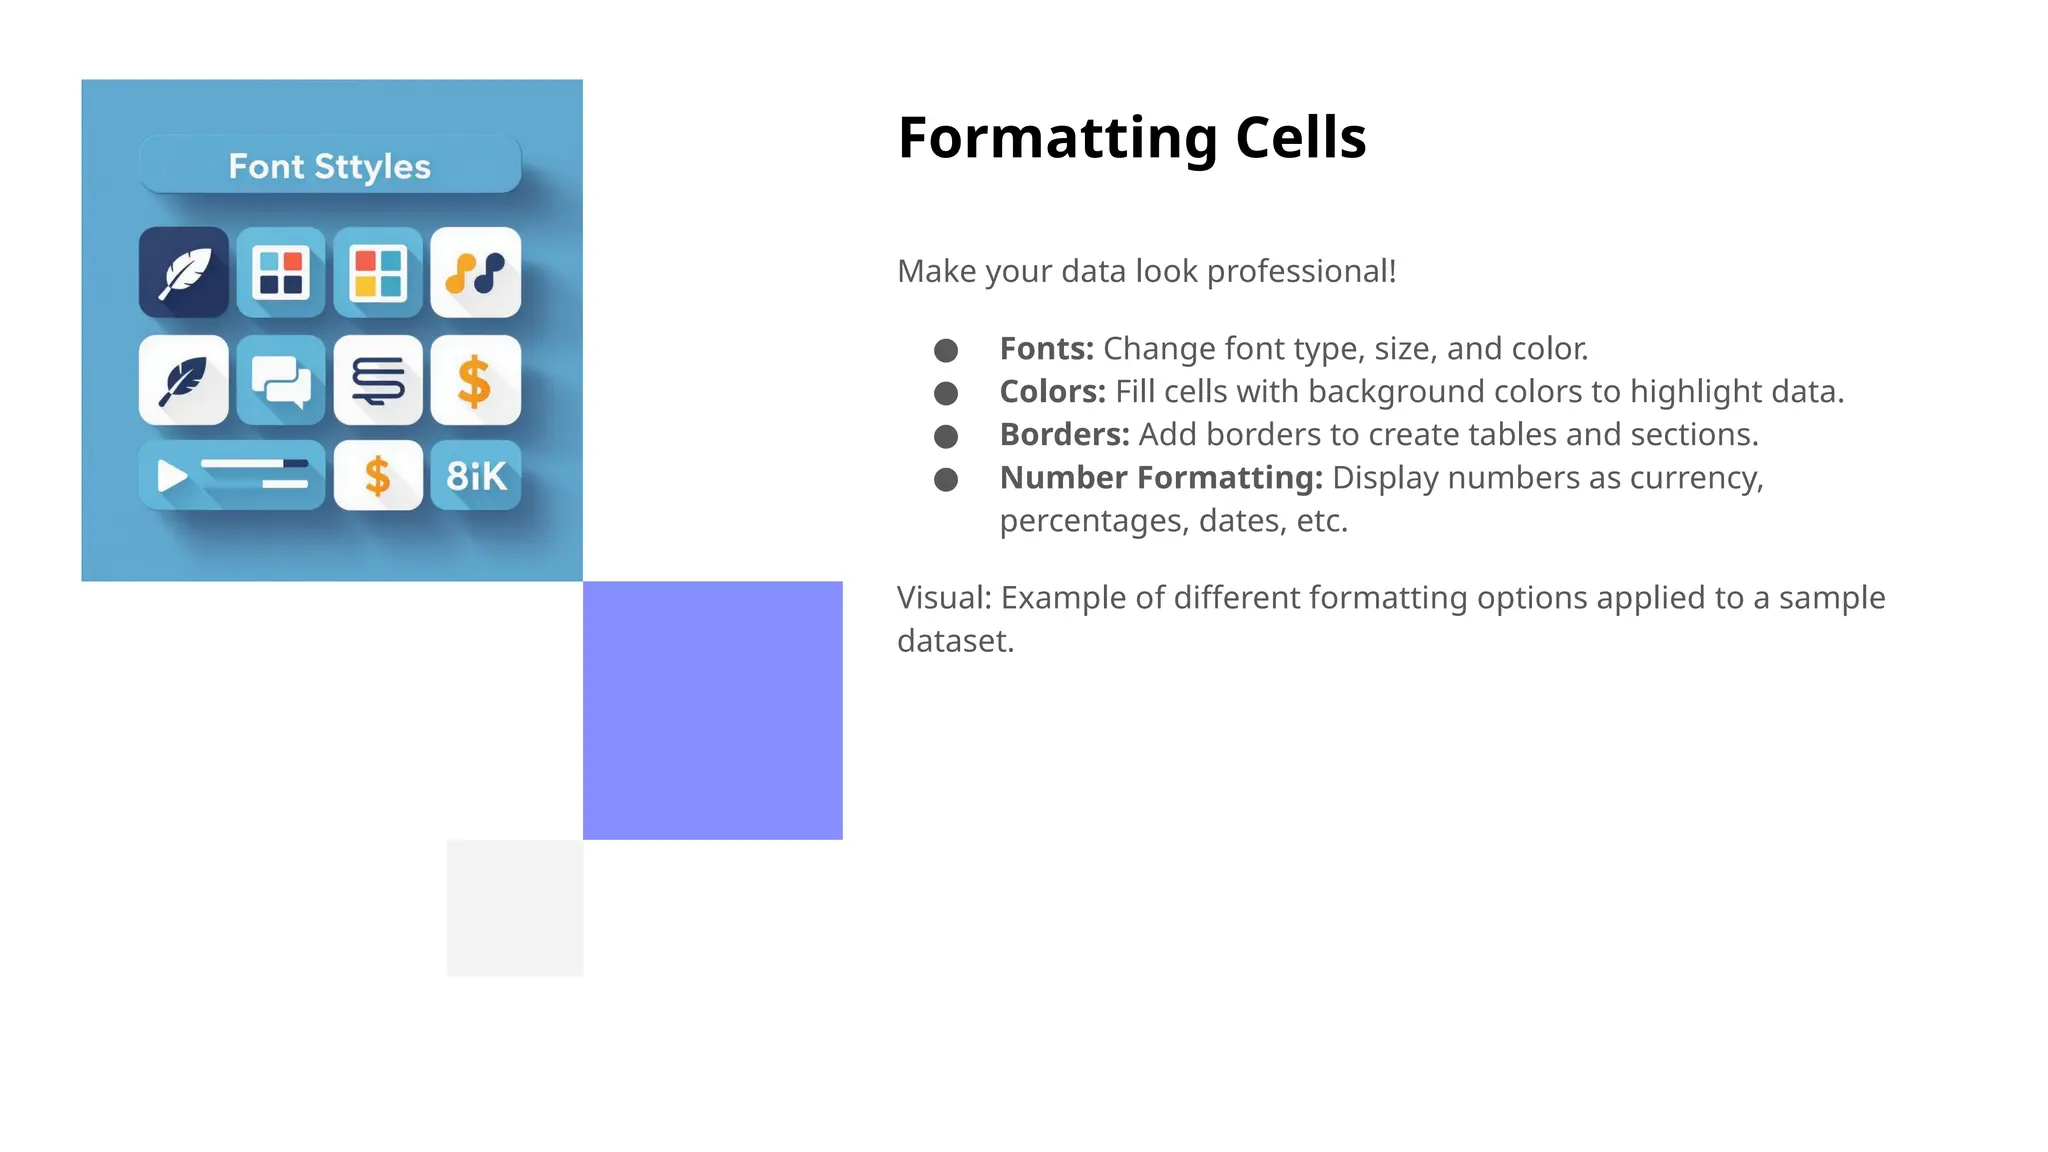
Formatting Cells
Make yourdata look professional!
● Fonts: Change font type, size, and color.
● Colors: Fill cells with background colors to highlight data.
● Borders: Add borders to create tables and sections.
● Number Formatting: Display numbers as currency,
percentages, dates, etc.
Visual: Example of different formatting options applied to a sample
dataset.
7.
Using Basic Formulas
Simplebut powerful formulas:
● SUM: Adds numbers together (=SUM(A1:A10))
● AVERAGE: Calculates the average (=AVERAGE(A1:A10))
● MIN: Finds the smallest number (=MIN(A1:A10))
● MAX: Finds the largest number(=MAX(A1:A10))
Live Example: Demonstrate these formulas in a simple spreadsheet.
8.
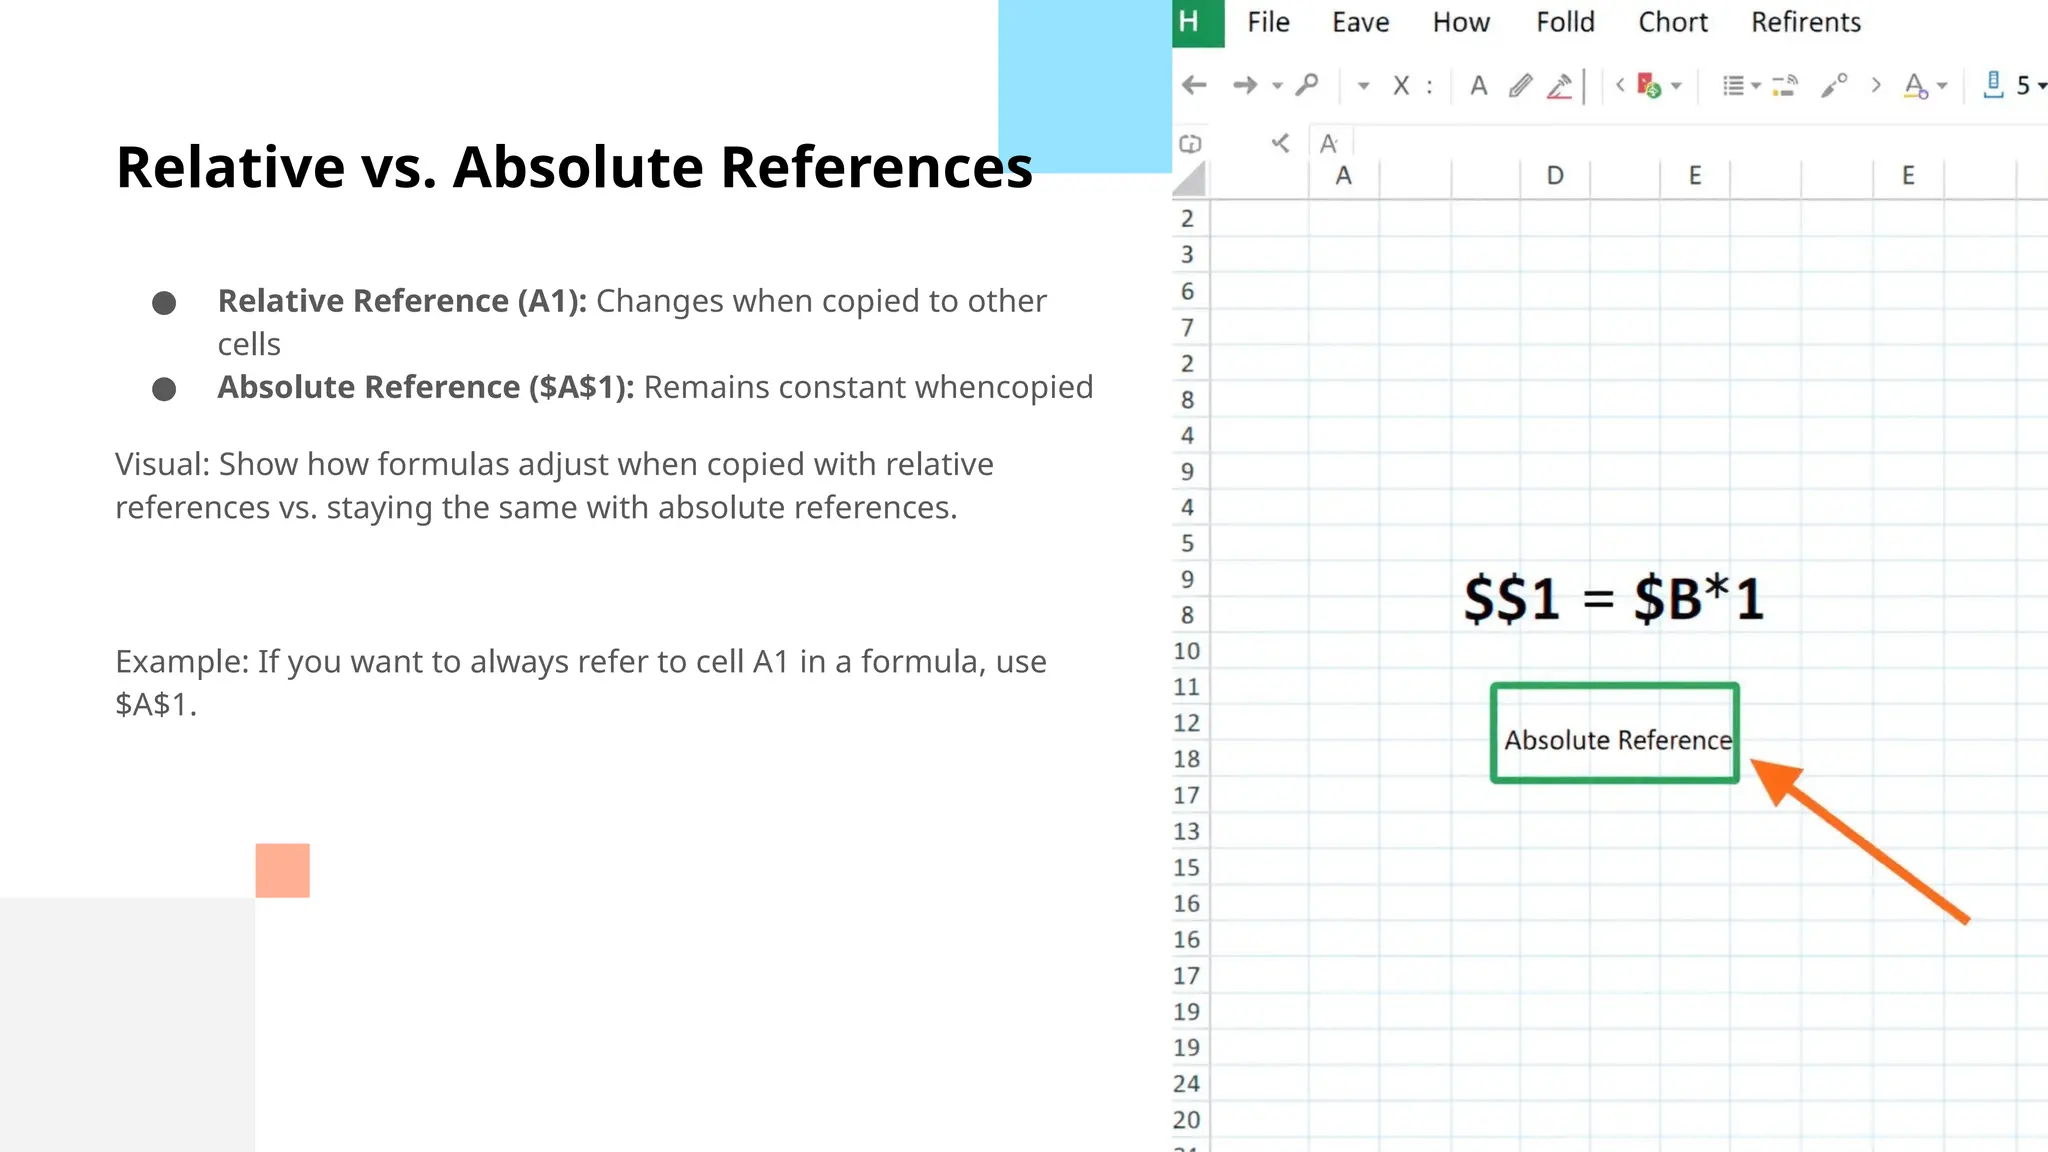
Relative vs. AbsoluteReferences
● Relative Reference (A1): Changes when copied to other
cells
● Absolute Reference ($A$1): Remains constant whencopied
Visual: Show how formulas adjust when copied with relative
references vs. staying the same with absolute references.
Example: If you want to always refer to cell A1 in a formula, use
$A$1.
9.
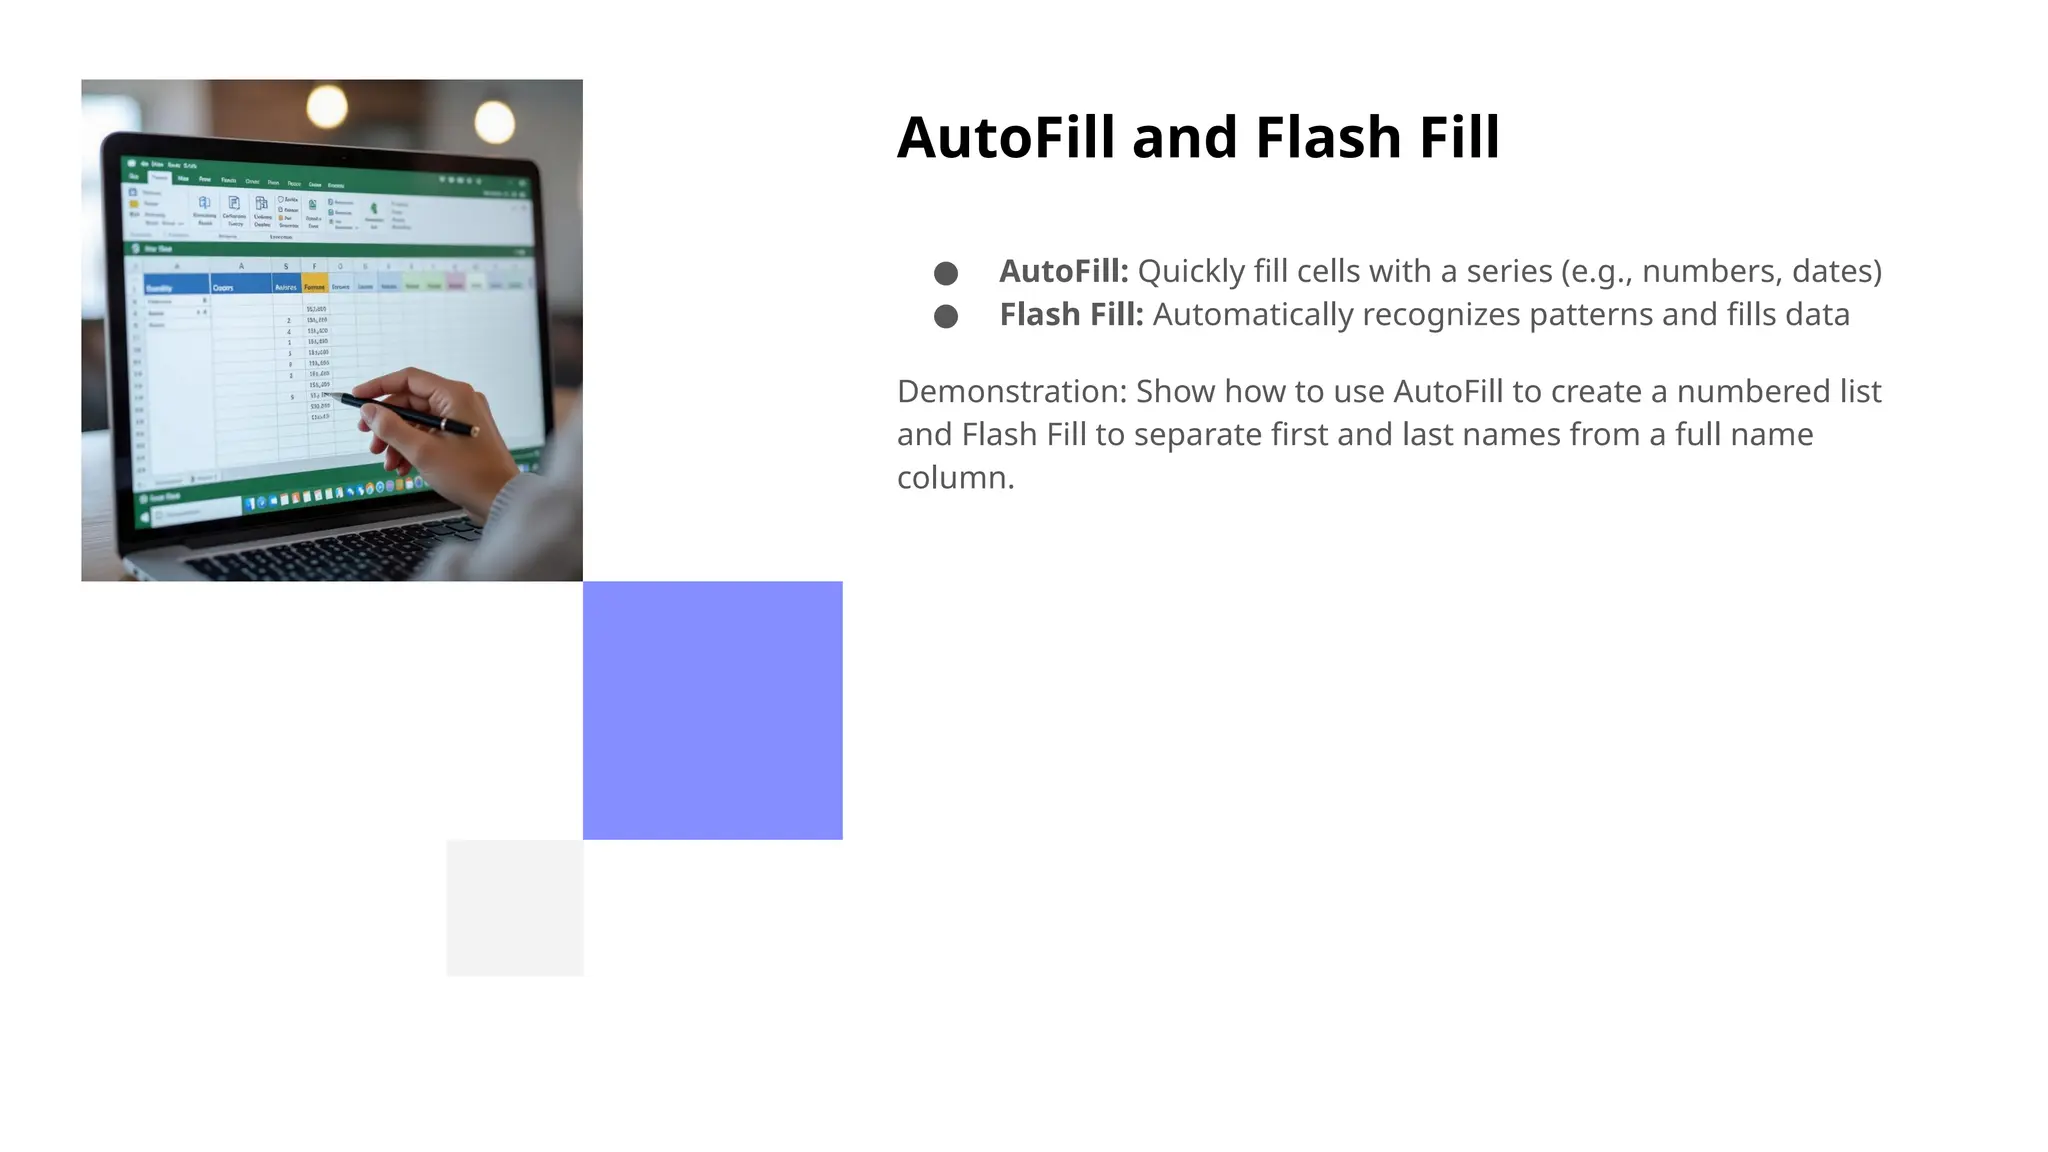
AutoFill and FlashFill
● AutoFill: Quickly fill cells with a series (e.g., numbers, dates)
● Flash Fill: Automatically recognizes patterns and fills data
Demonstration: Show how to use AutoFill to create a numbered list
and Flash Fill to separate first and last names from a full name
column.
10.
Sorting and FilteringData
● Sorting: Arrange data alphabetically, numerically, or by date.
● Filtering: Display only the rows that meet specific criteria.
Example: Sort a list of students by last name or filter to show only
students in a specific major.
11.
Conditional Formatting
Highlight datatrends visually:
● Colors: Color scales to show high and low values.
● Icons: Use arrows or symbols to indicate performance.
● Data Bars: Show the relative size of values within a range.
Visual: Show a dataset with conditional formatting applied to highlight
top performers or overdue tasks.
12.
Working with MultipleSheets
● Add sheets by clicking the "+" button.
● Reference data from other sheets using the sheet name
(e.g., Sheet2!A1).
● Organize your data logically across multiple sheets.
13.
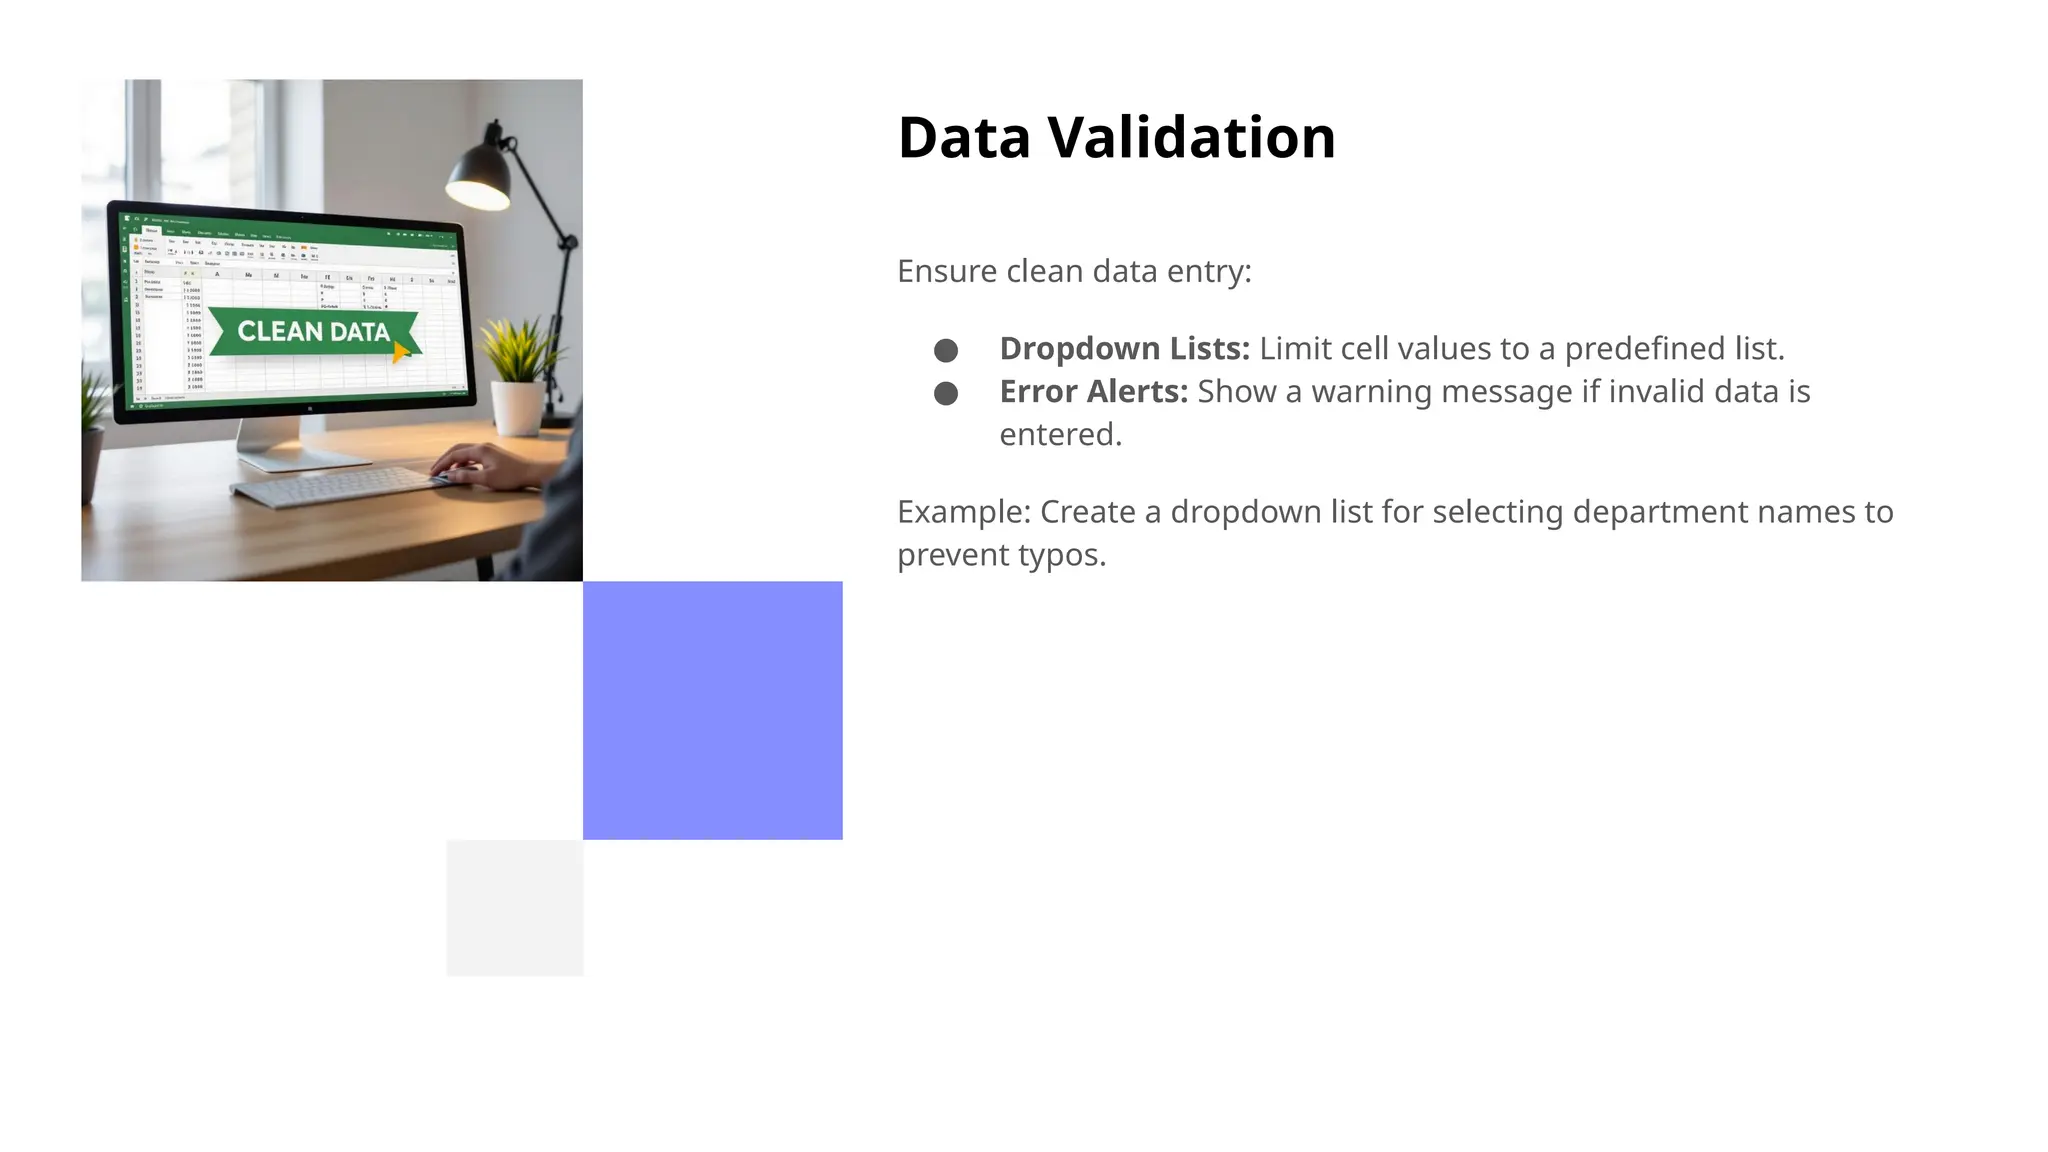
Data Validation
Ensure cleandata entry:
● Dropdown Lists: Limit cell values to a predefined list.
● Error Alerts: Show a warning message if invalid data is
entered.
Example: Create a dropdown list for selecting department names to
prevent typos.
14.
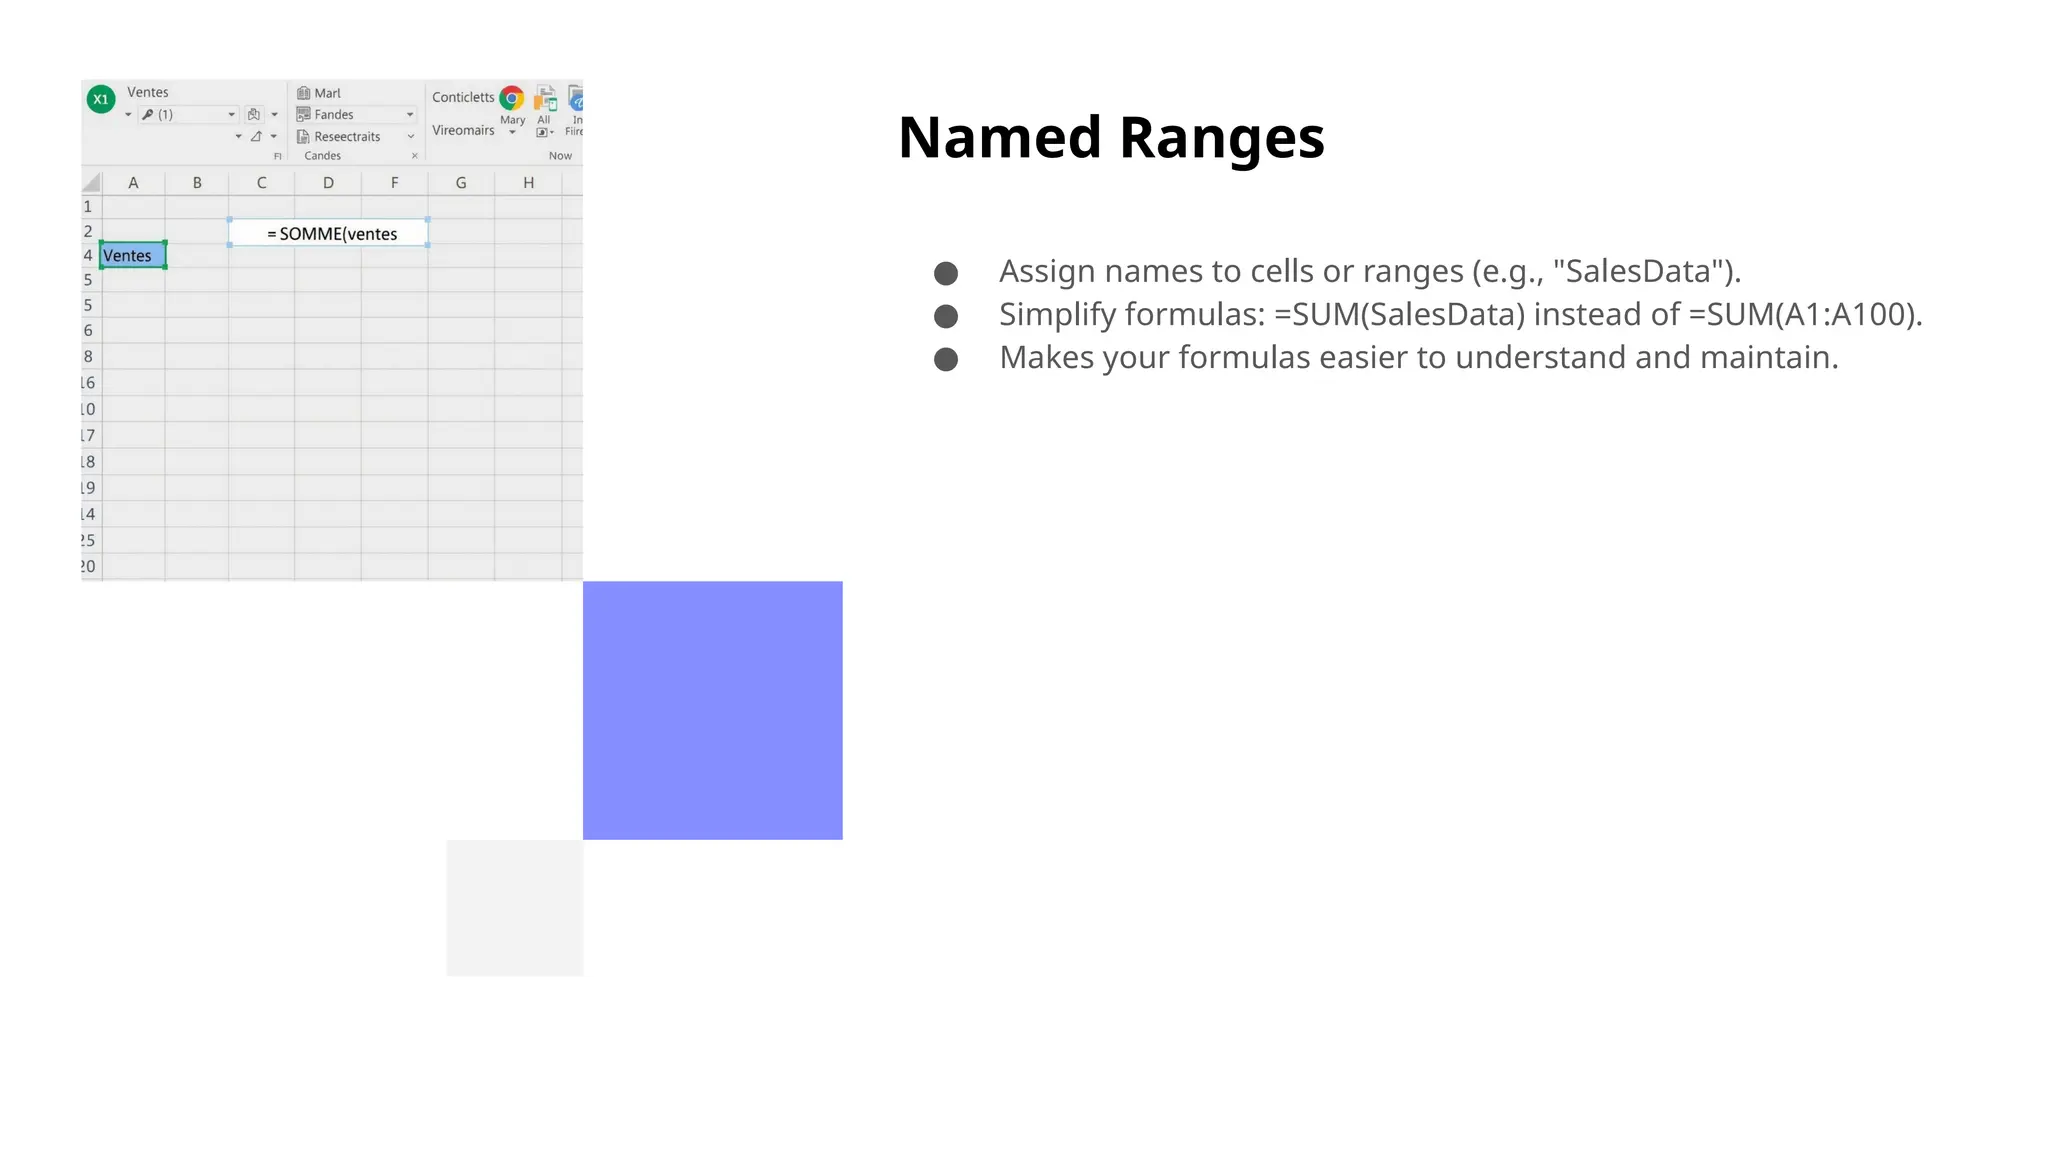
Named Ranges
● Assignnames to cells or ranges (e.g., "SalesData").
● Simplify formulas: =SUM(SalesData) instead of =SUM(A1:A100).
● Makes your formulas easier to understand and maintain.
15.
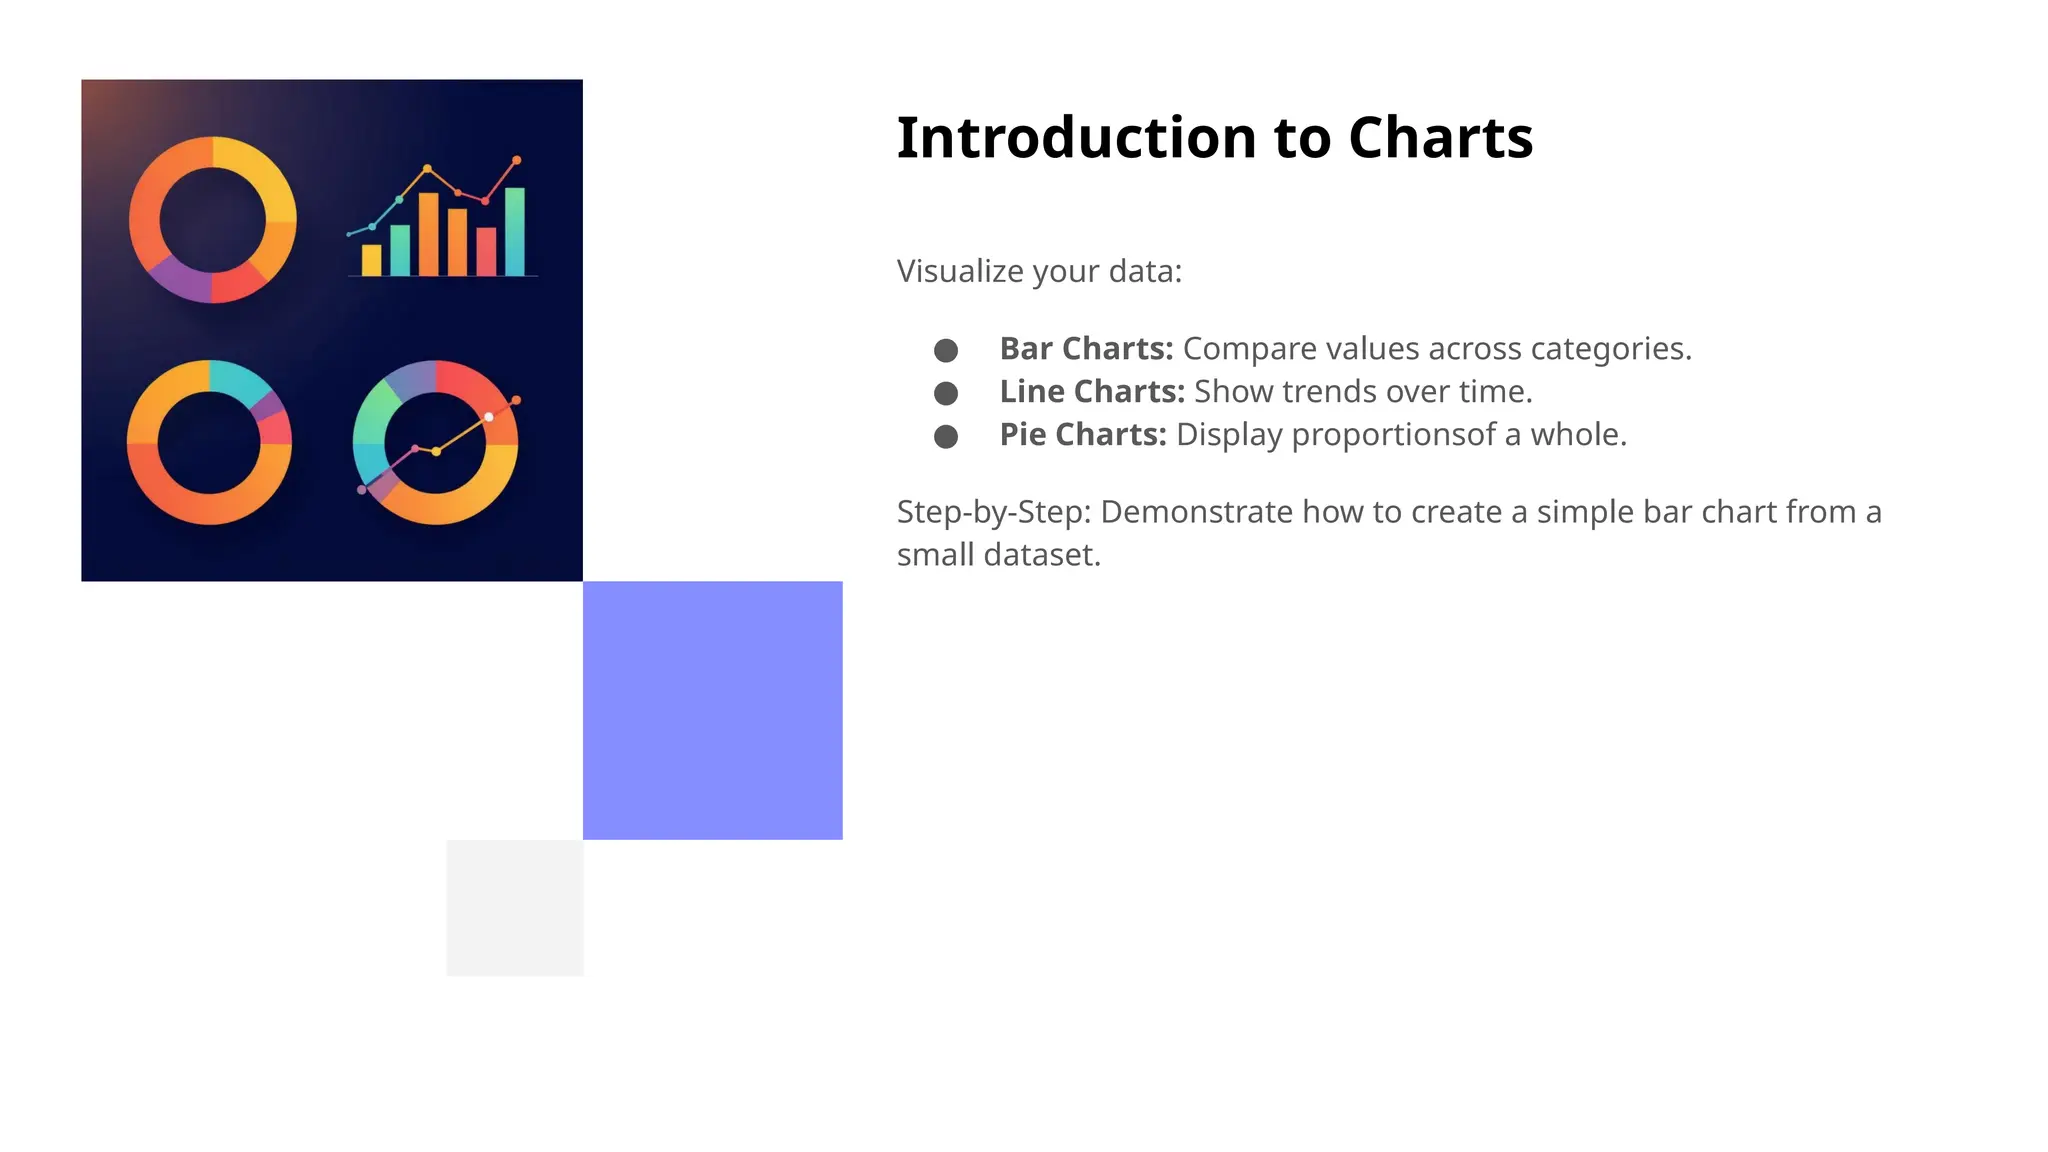
Introduction to Charts
Visualizeyour data:
● Bar Charts: Compare values across categories.
● Line Charts: Show trends over time.
● Pie Charts: Display proportionsof a whole.
Step-by-Step: Demonstrate how to create a simple bar chart from a
small dataset.
16.
Chart Customization
Make yourcharts tell a story:
● Titles: Clearly label your chart and axes.
● Labels: Display data values on the chart.
● Legends: Explain what each color or category represents.
● Colors: Use colors to highlight key information.
17.
Advanced Chart Types
●Combo Charts: Combine different chart types (e.g., bars and lines).
● Sparklines: Tiny charts within a cell to show trends.
● Waterfall Charts: Illustrate the cumulative effect of positive and negative values.
Visual Examples: Show examples of each chart type and their applications.
18.
Functions Deep Dive
Essentialfunctions for data analysis:
● IF: Perform different actions based on a condition.
● COUNTIF: Count cells that meet a specific criteria.
● VLOOKUP: Find data in a table based on a lookup value.
● HLOOKUP: Similar to VLOOKUP, but looks horizontally.
● INDEX & MATCH: More flexible alternativeto VLOOKUP/HLOOKUP.
19.
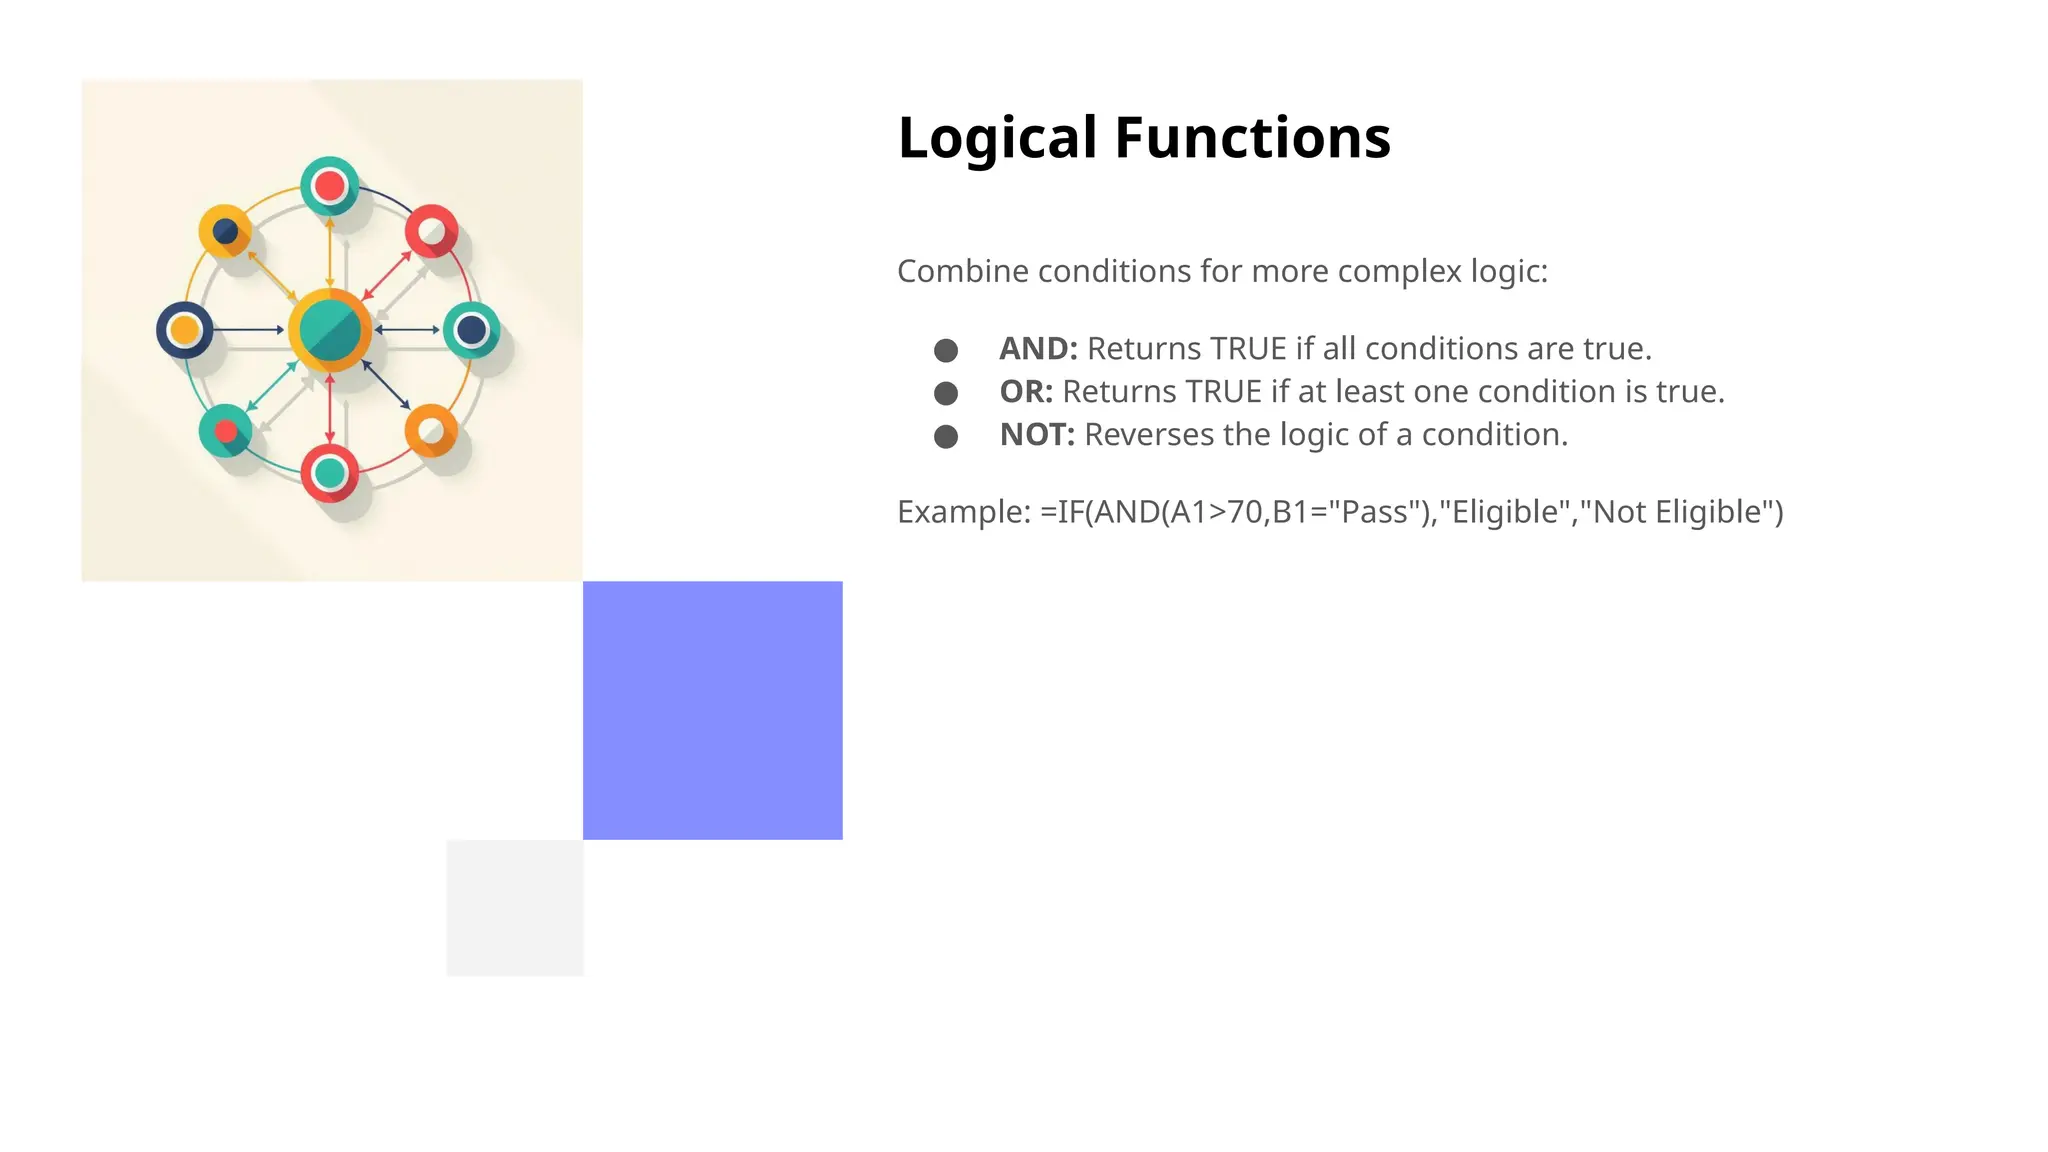
Logical Functions
Combine conditionsfor more complex logic:
● AND: Returns TRUE if all conditions are true.
● OR: Returns TRUE if at least one condition is true.
● NOT: Reverses the logic of a condition.
Example: =IF(AND(A1>70,B1="Pass"),"Eligible","Not Eligible")
20.
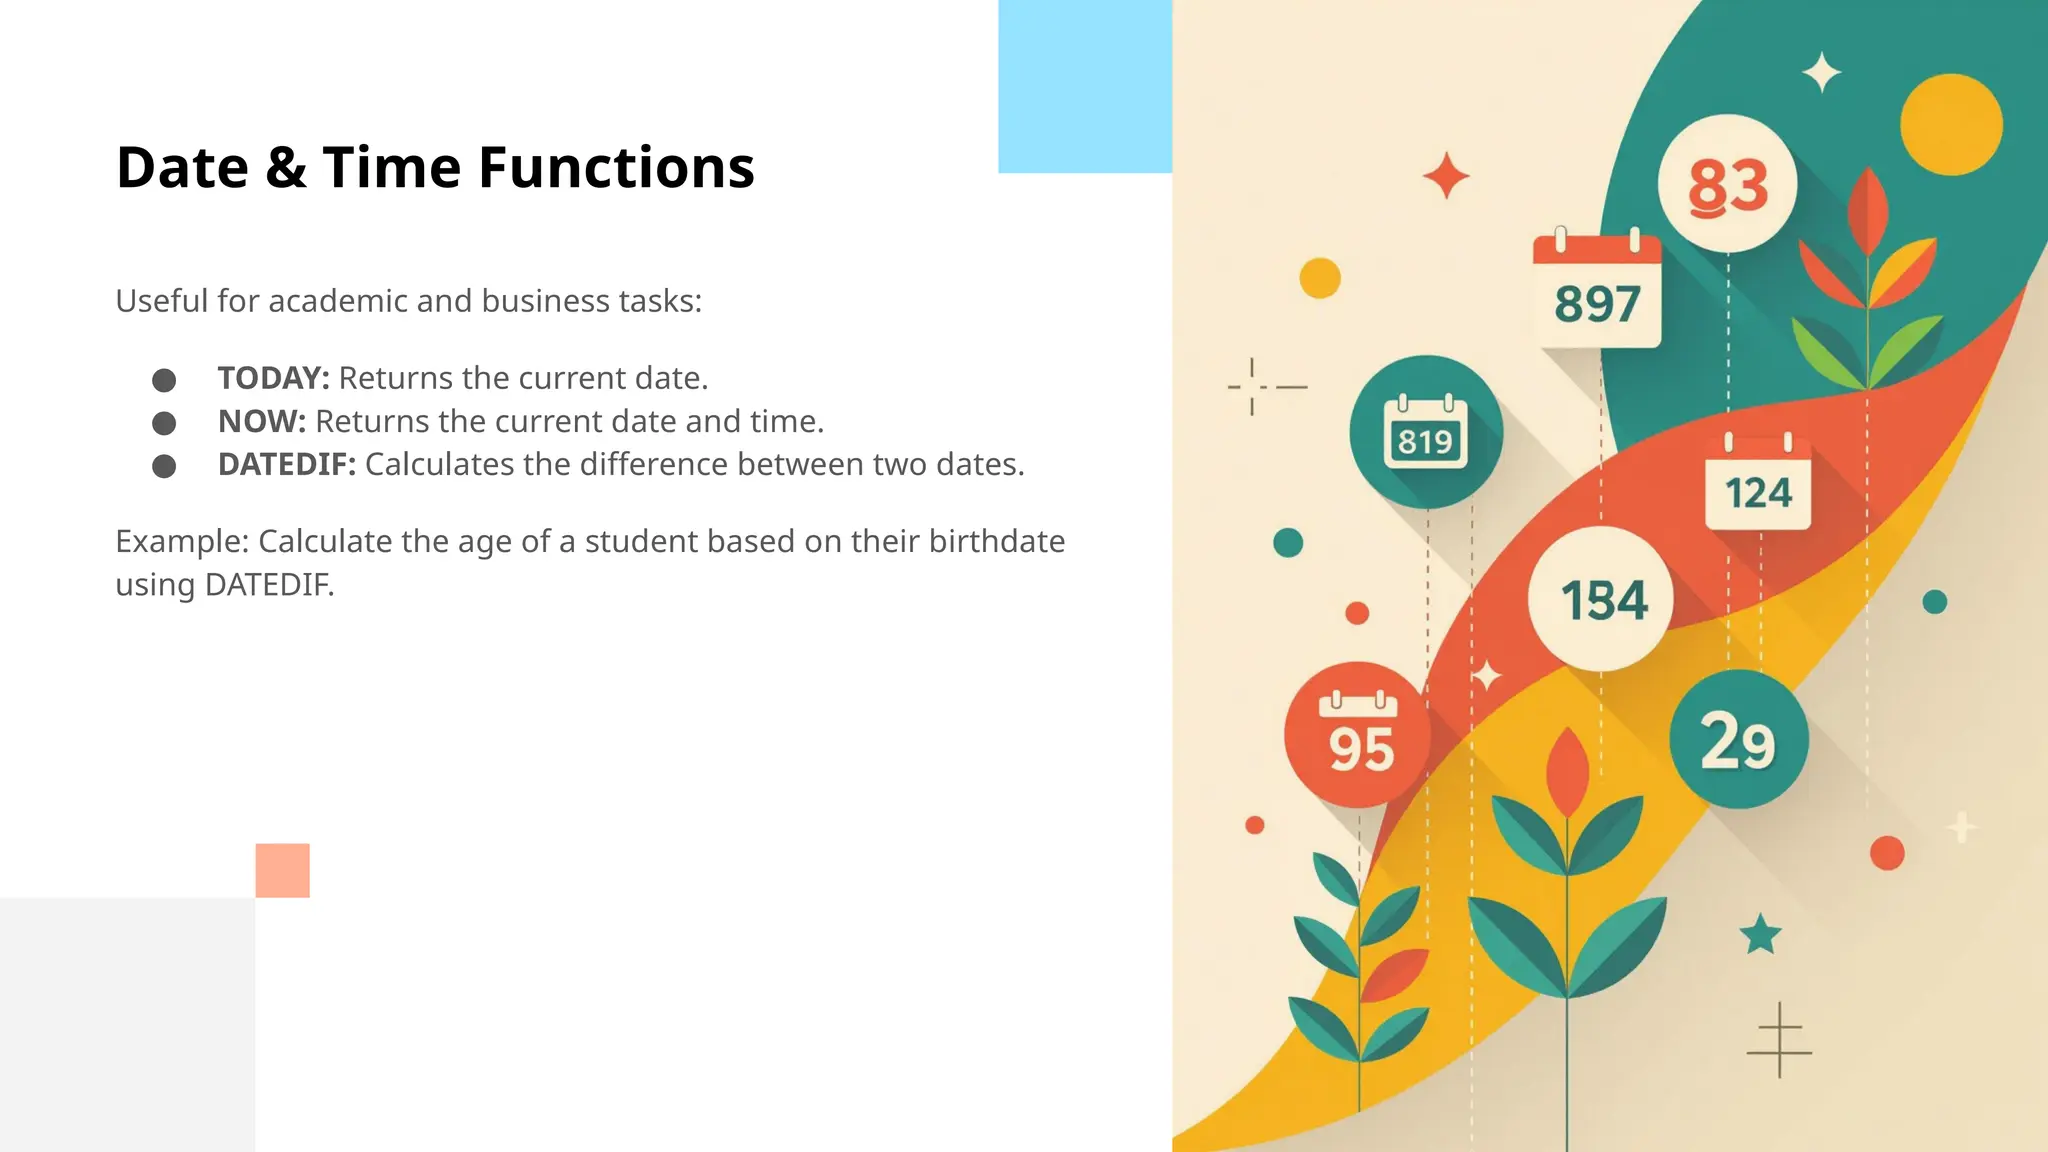
Date & TimeFunctions
Useful for academic and business tasks:
● TODAY: Returns the current date.
● NOW: Returns the current date and time.
● DATEDIF: Calculates the difference between two dates.
Example: Calculate the age of a student based on their birthdate
using DATEDIF.
21.
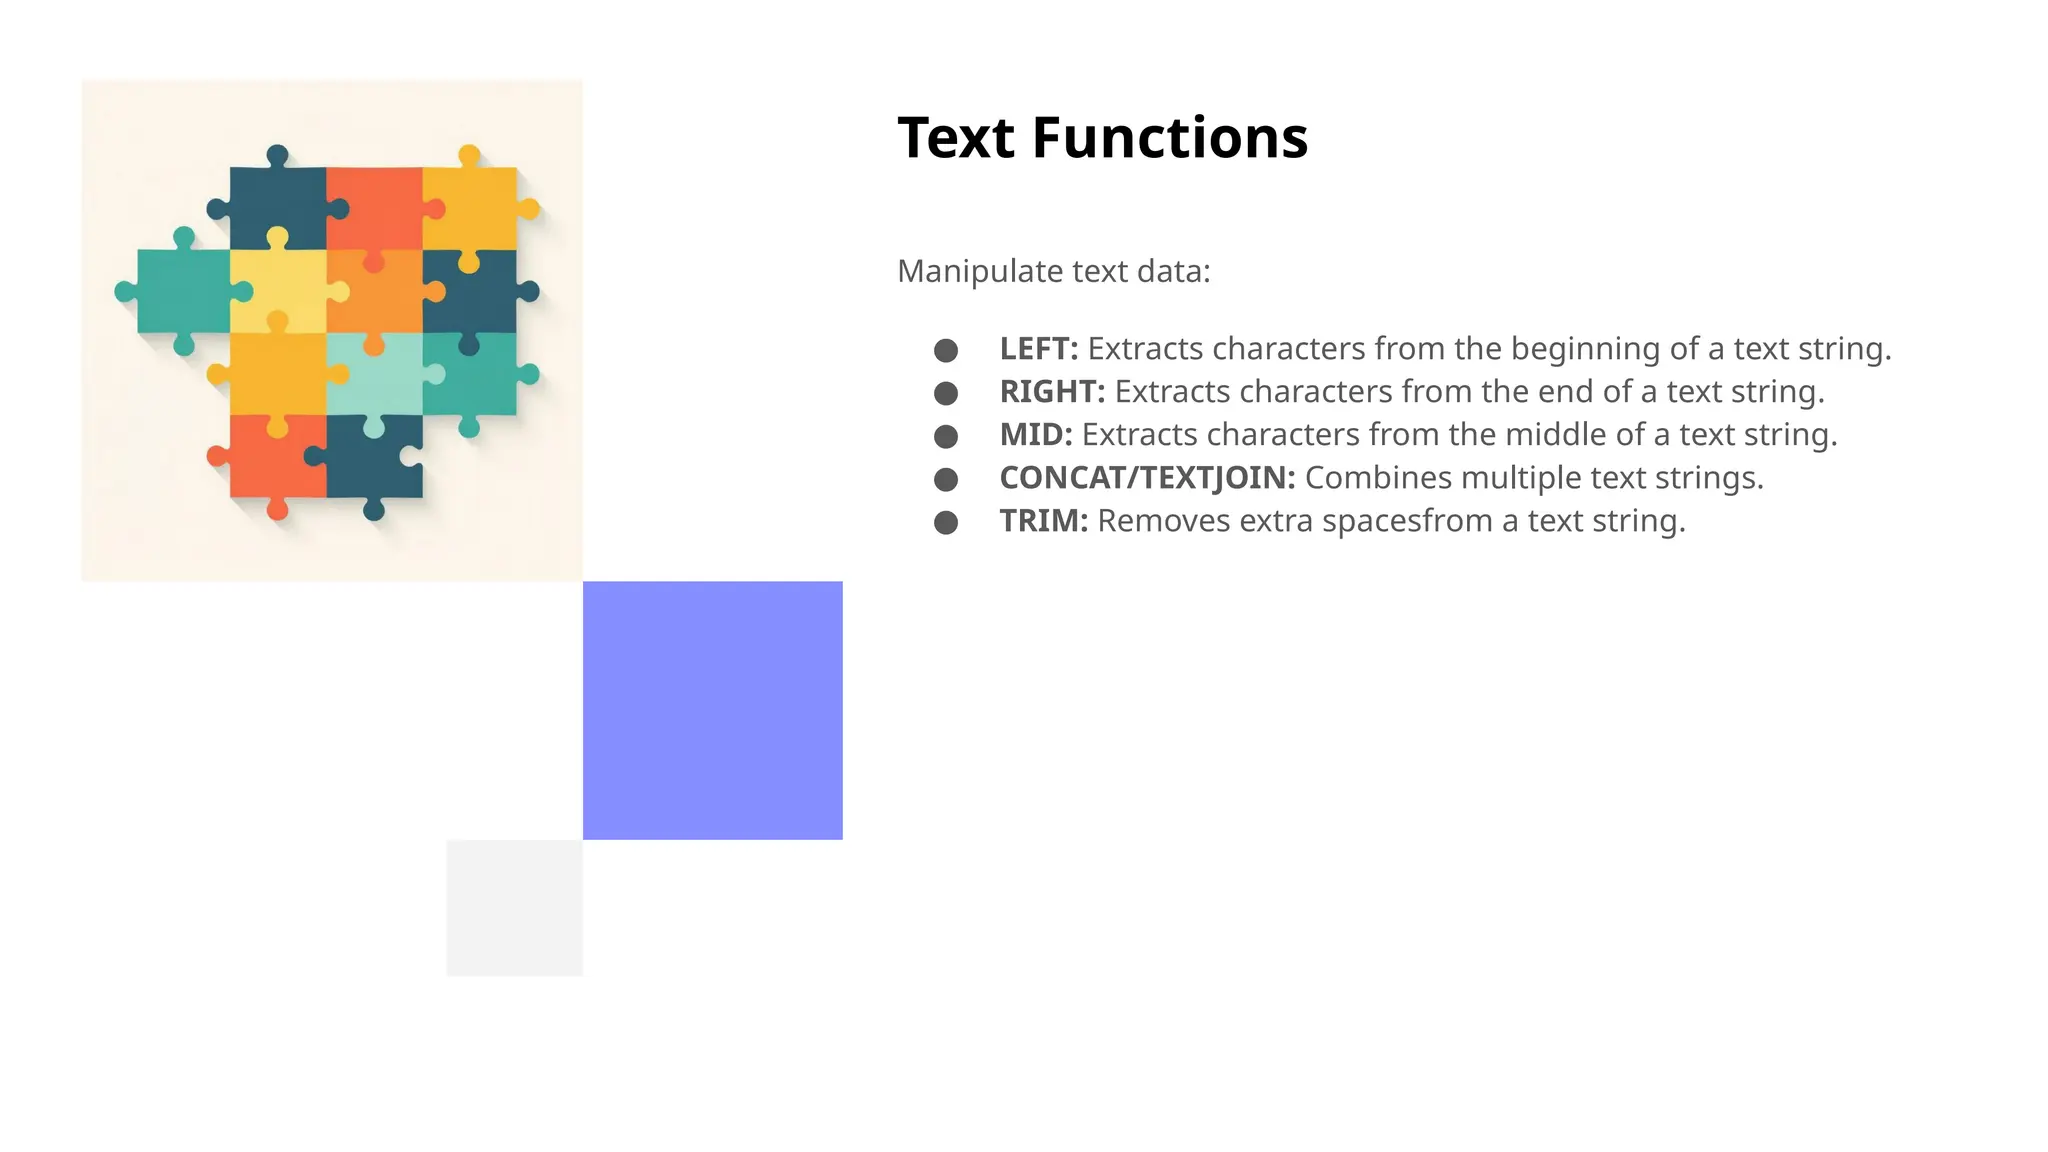
Text Functions
Manipulate textdata:
● LEFT: Extracts characters from the beginning of a text string.
● RIGHT: Extracts characters from the end of a text string.
● MID: Extracts characters from the middle of a text string.
● CONCAT/TEXTJOIN: Combines multiple text strings.
● TRIM: Removes extra spacesfrom a text string.
22.
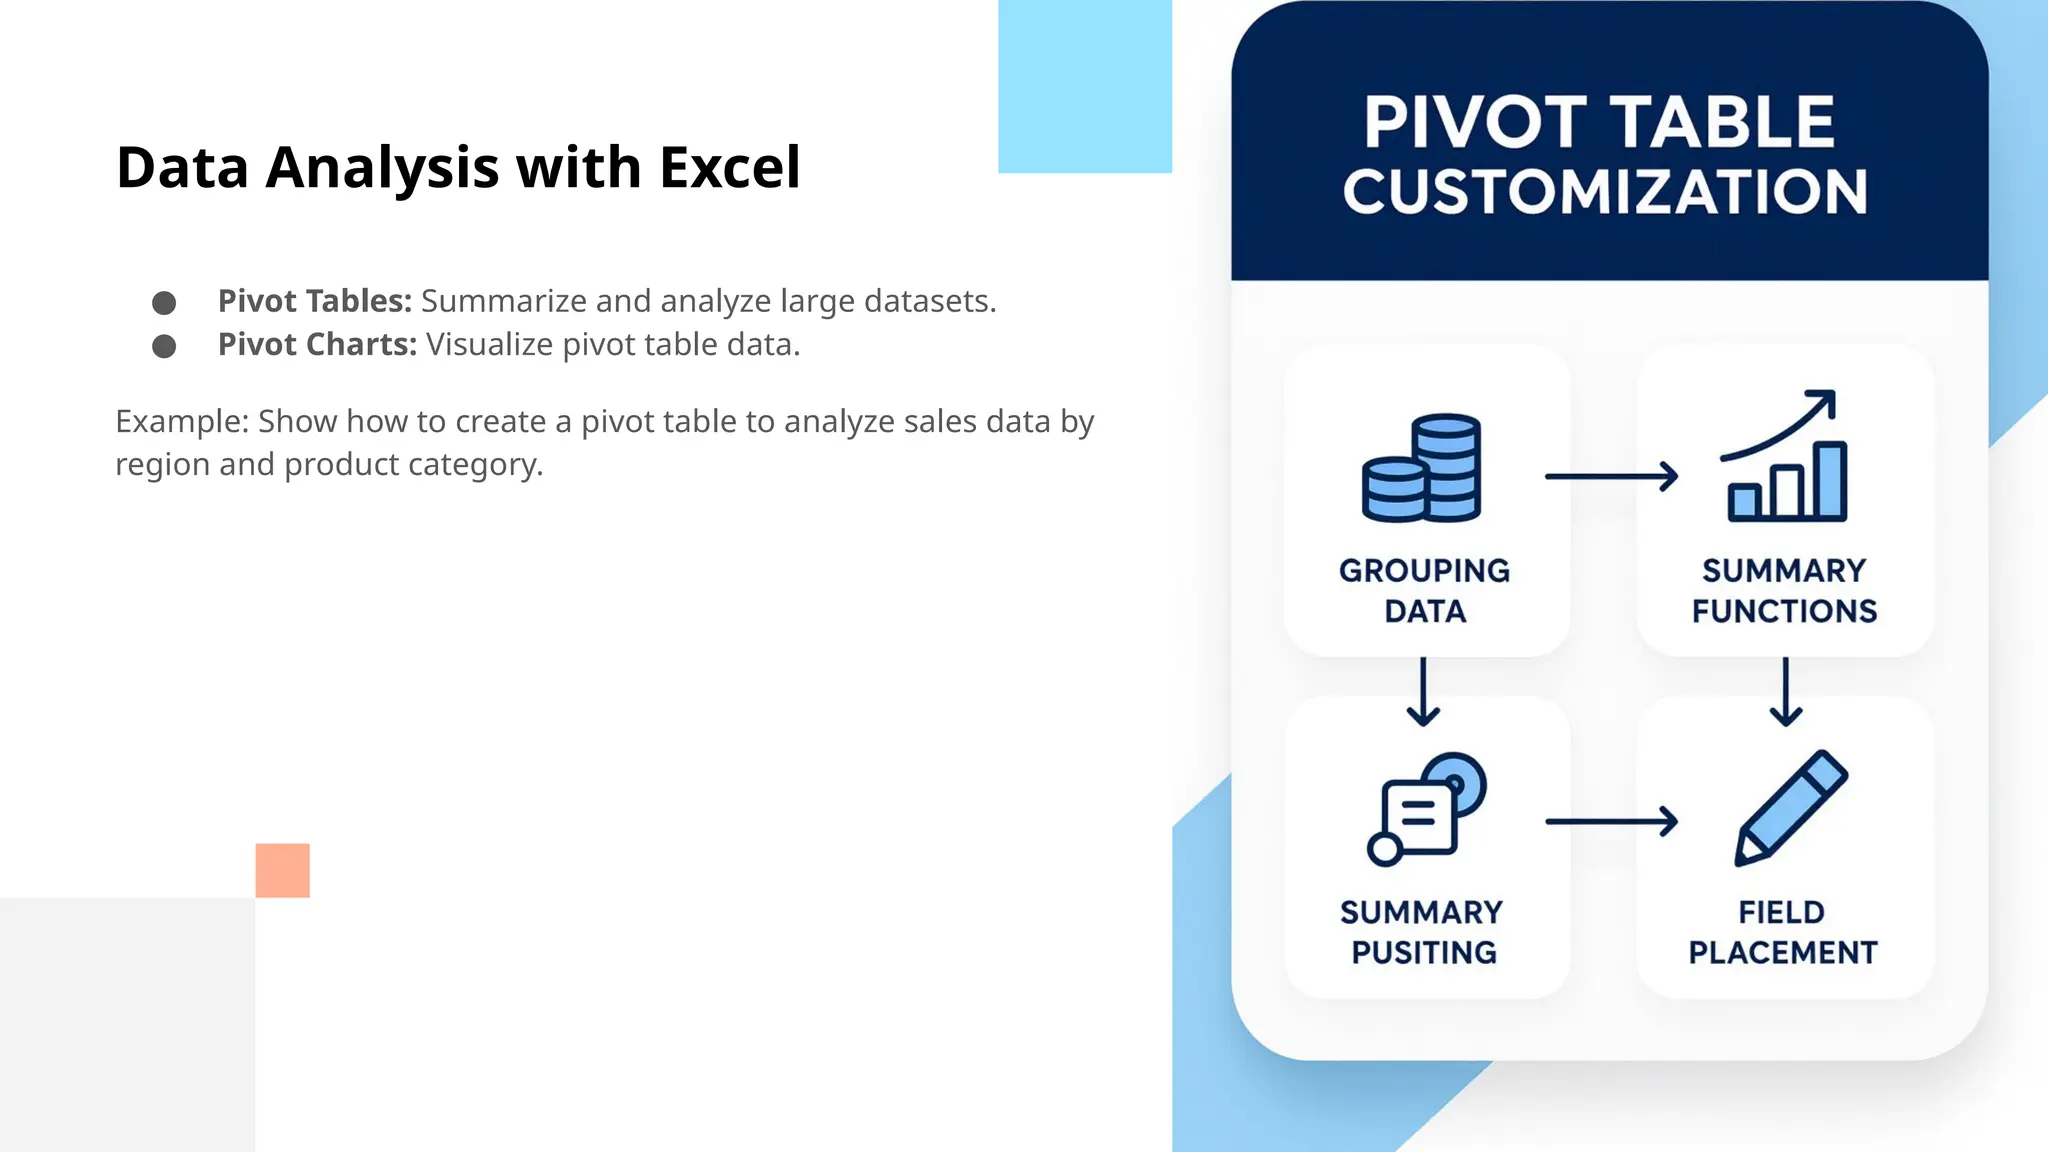
Data Analysis withExcel
● Pivot Tables: Summarize and analyze large datasets.
● Pivot Charts: Visualize pivot table data.
Example: Show how to create a pivot table to analyze sales data by
region and product category.
23.
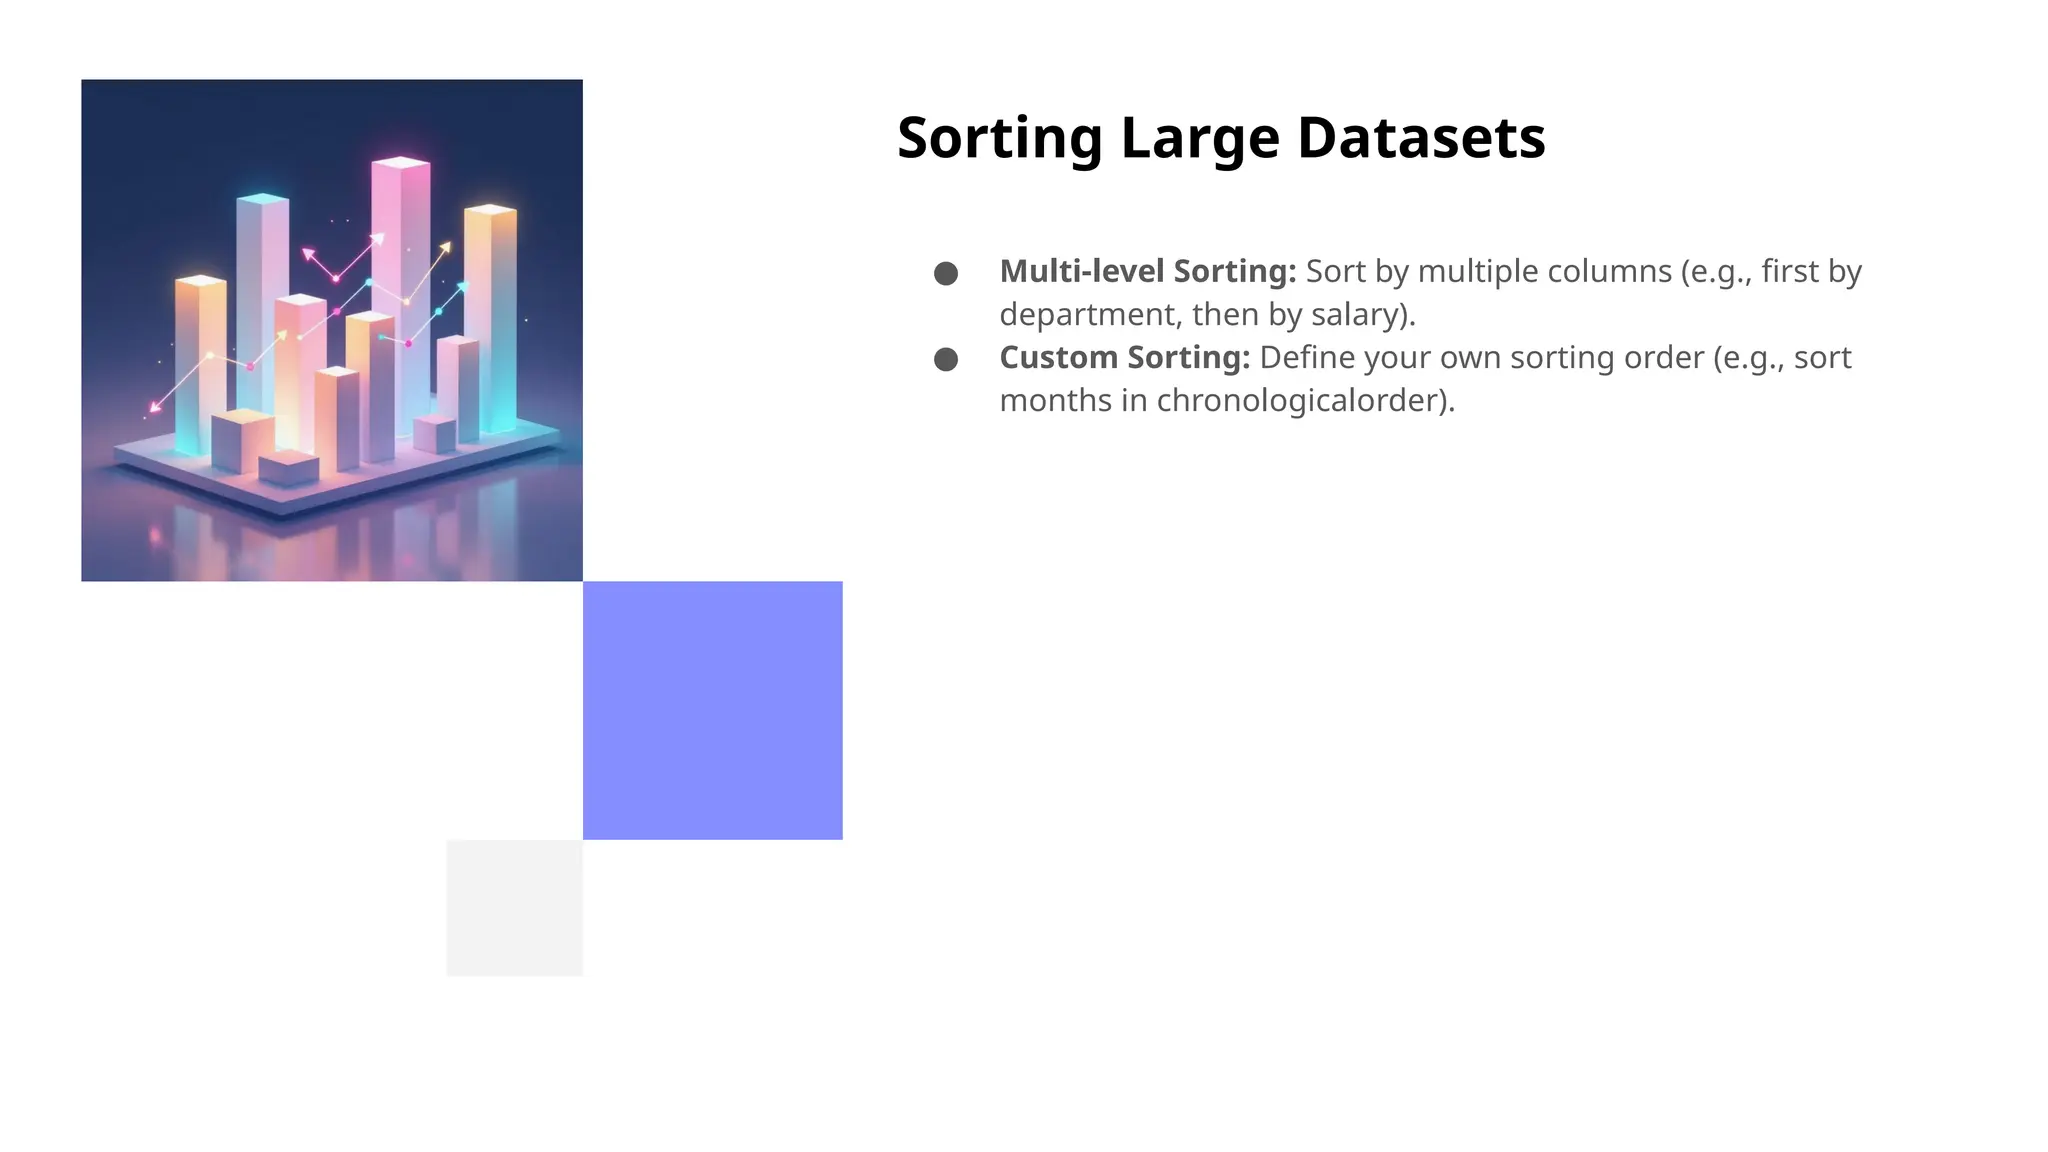
Sorting Large Datasets
●Multi-level Sorting: Sort by multiple columns (e.g., first by
department, then by salary).
● Custom Sorting: Define your own sorting order (e.g., sort
months in chronologicalorder).
24.
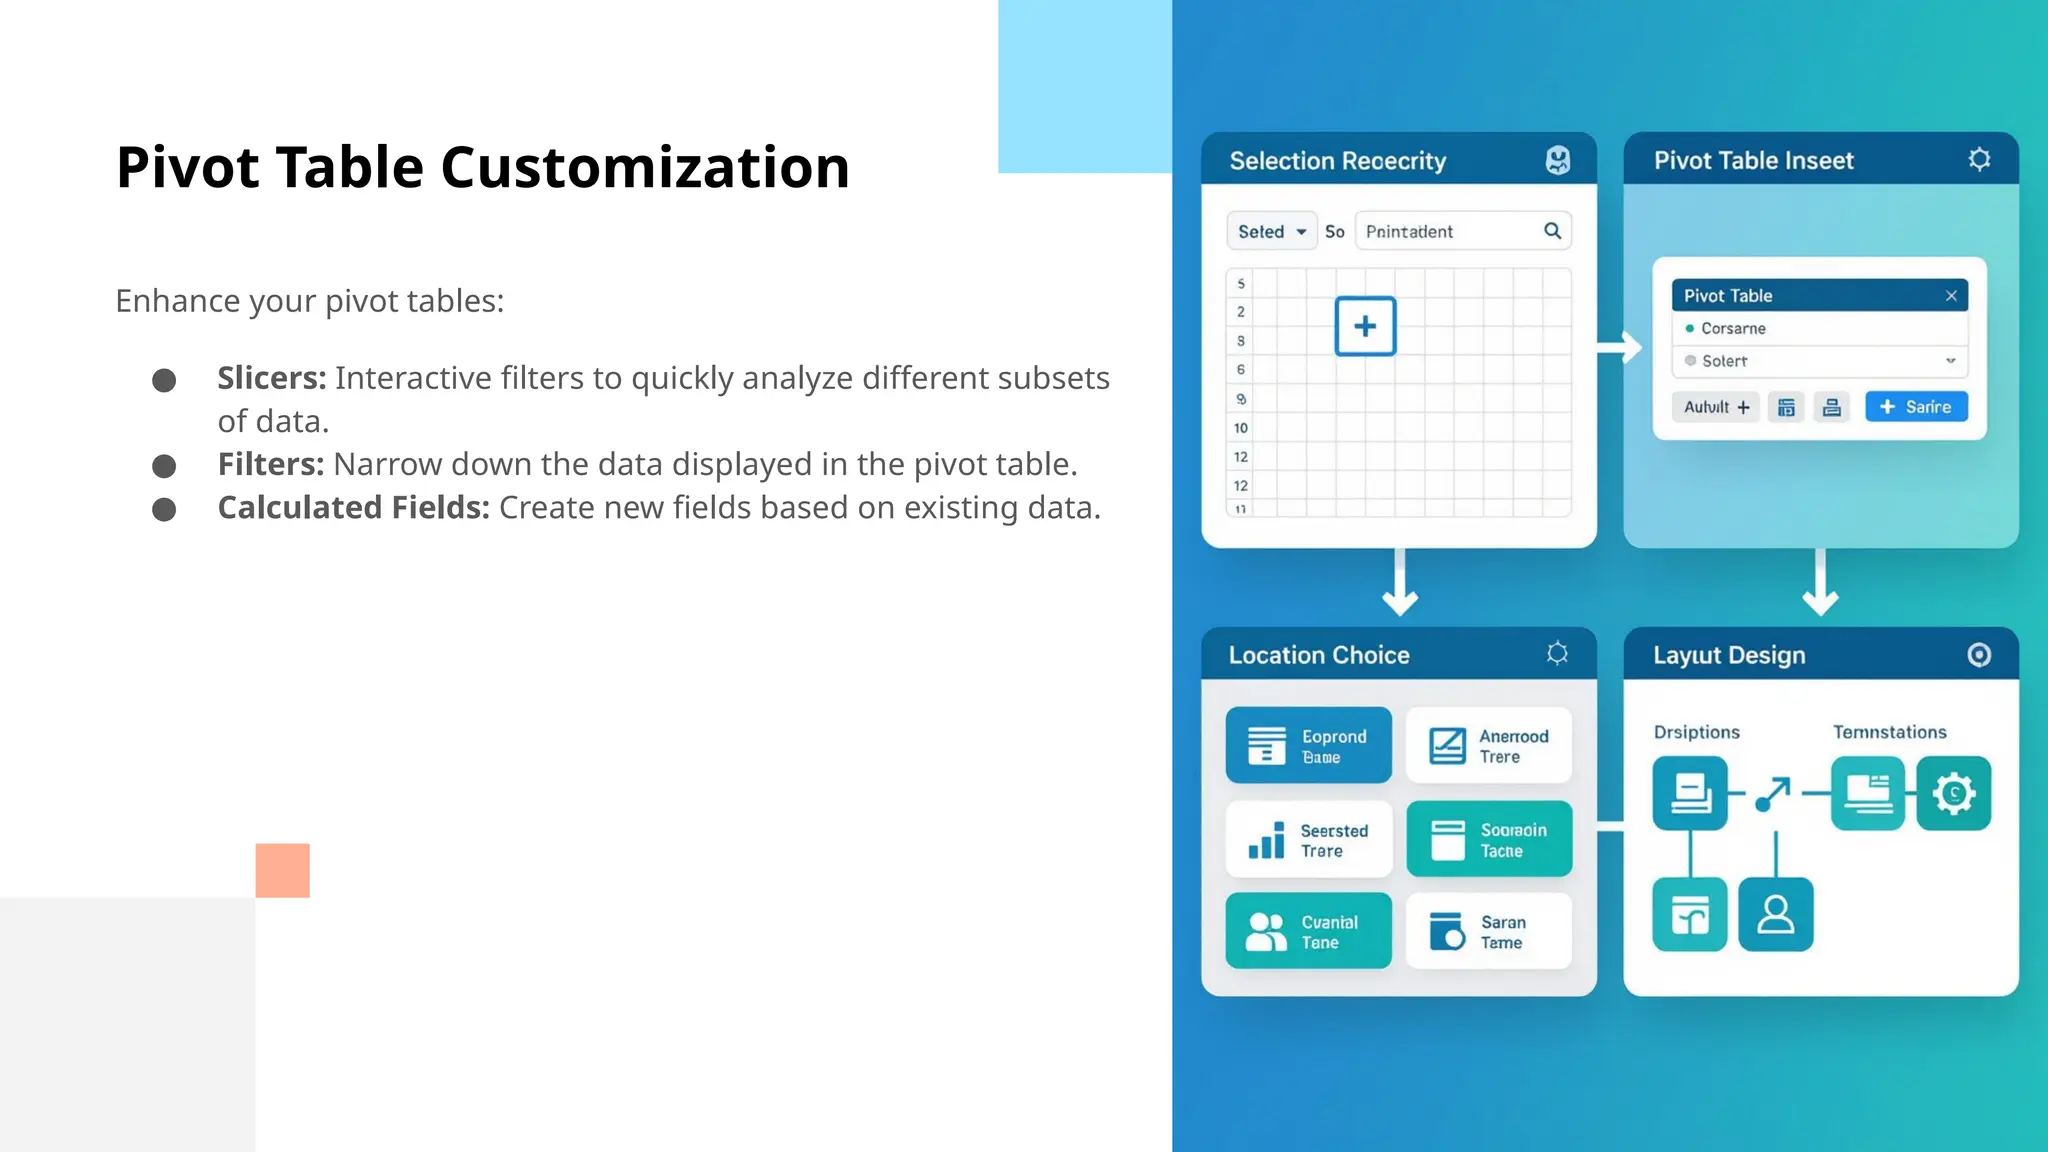
Pivot Table Customization
Enhanceyour pivot tables:
● Slicers: Interactive filters to quickly analyze different subsets
of data.
● Filters: Narrow down the data displayed in the pivot table.
● Calculated Fields: Create new fields based on existing data.
25.
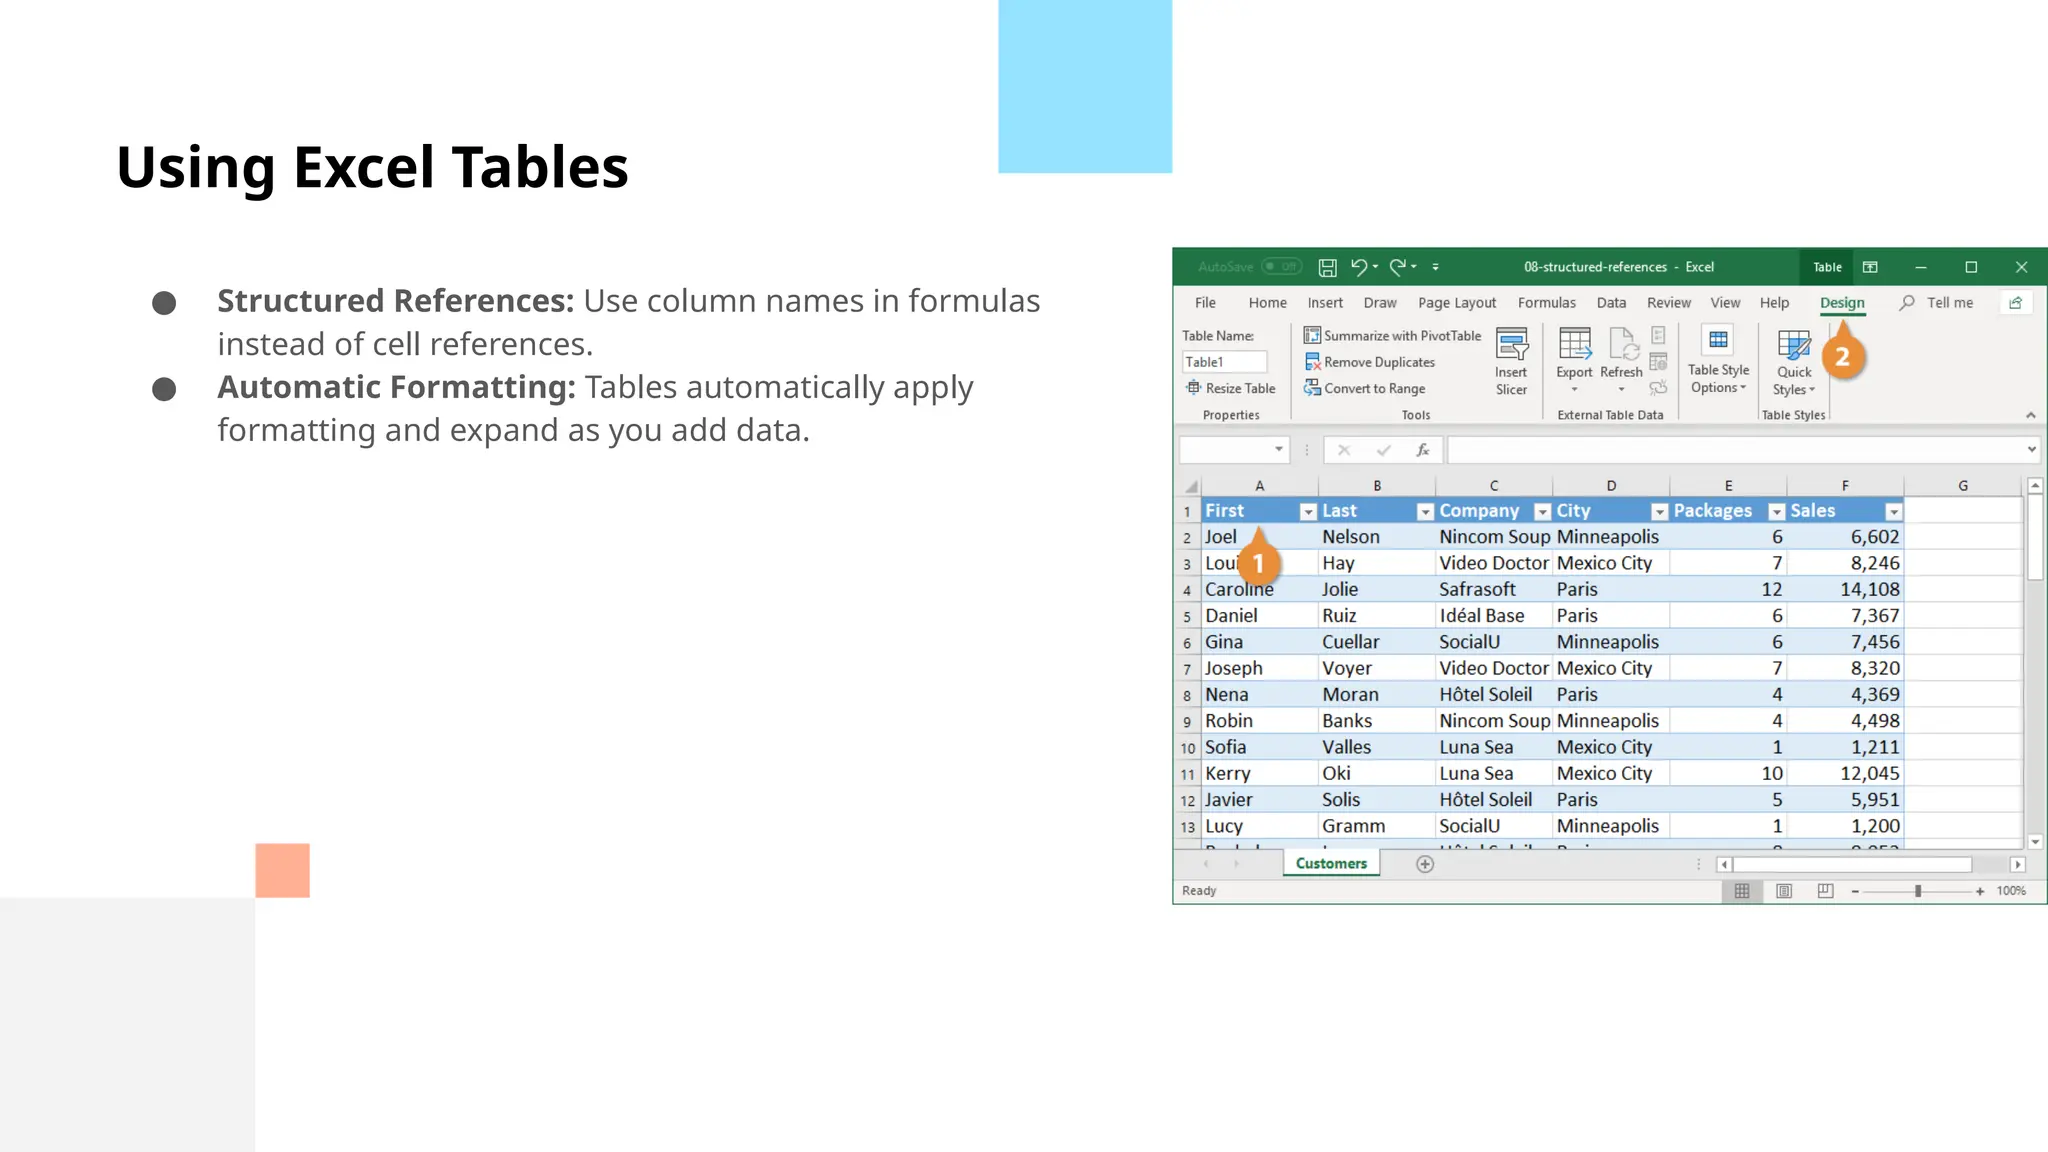
Using Excel Tables
●Structured References: Use column names in formulas
instead of cell references.
● Automatic Formatting: Tables automatically apply
formatting and expand as you add data.
26.
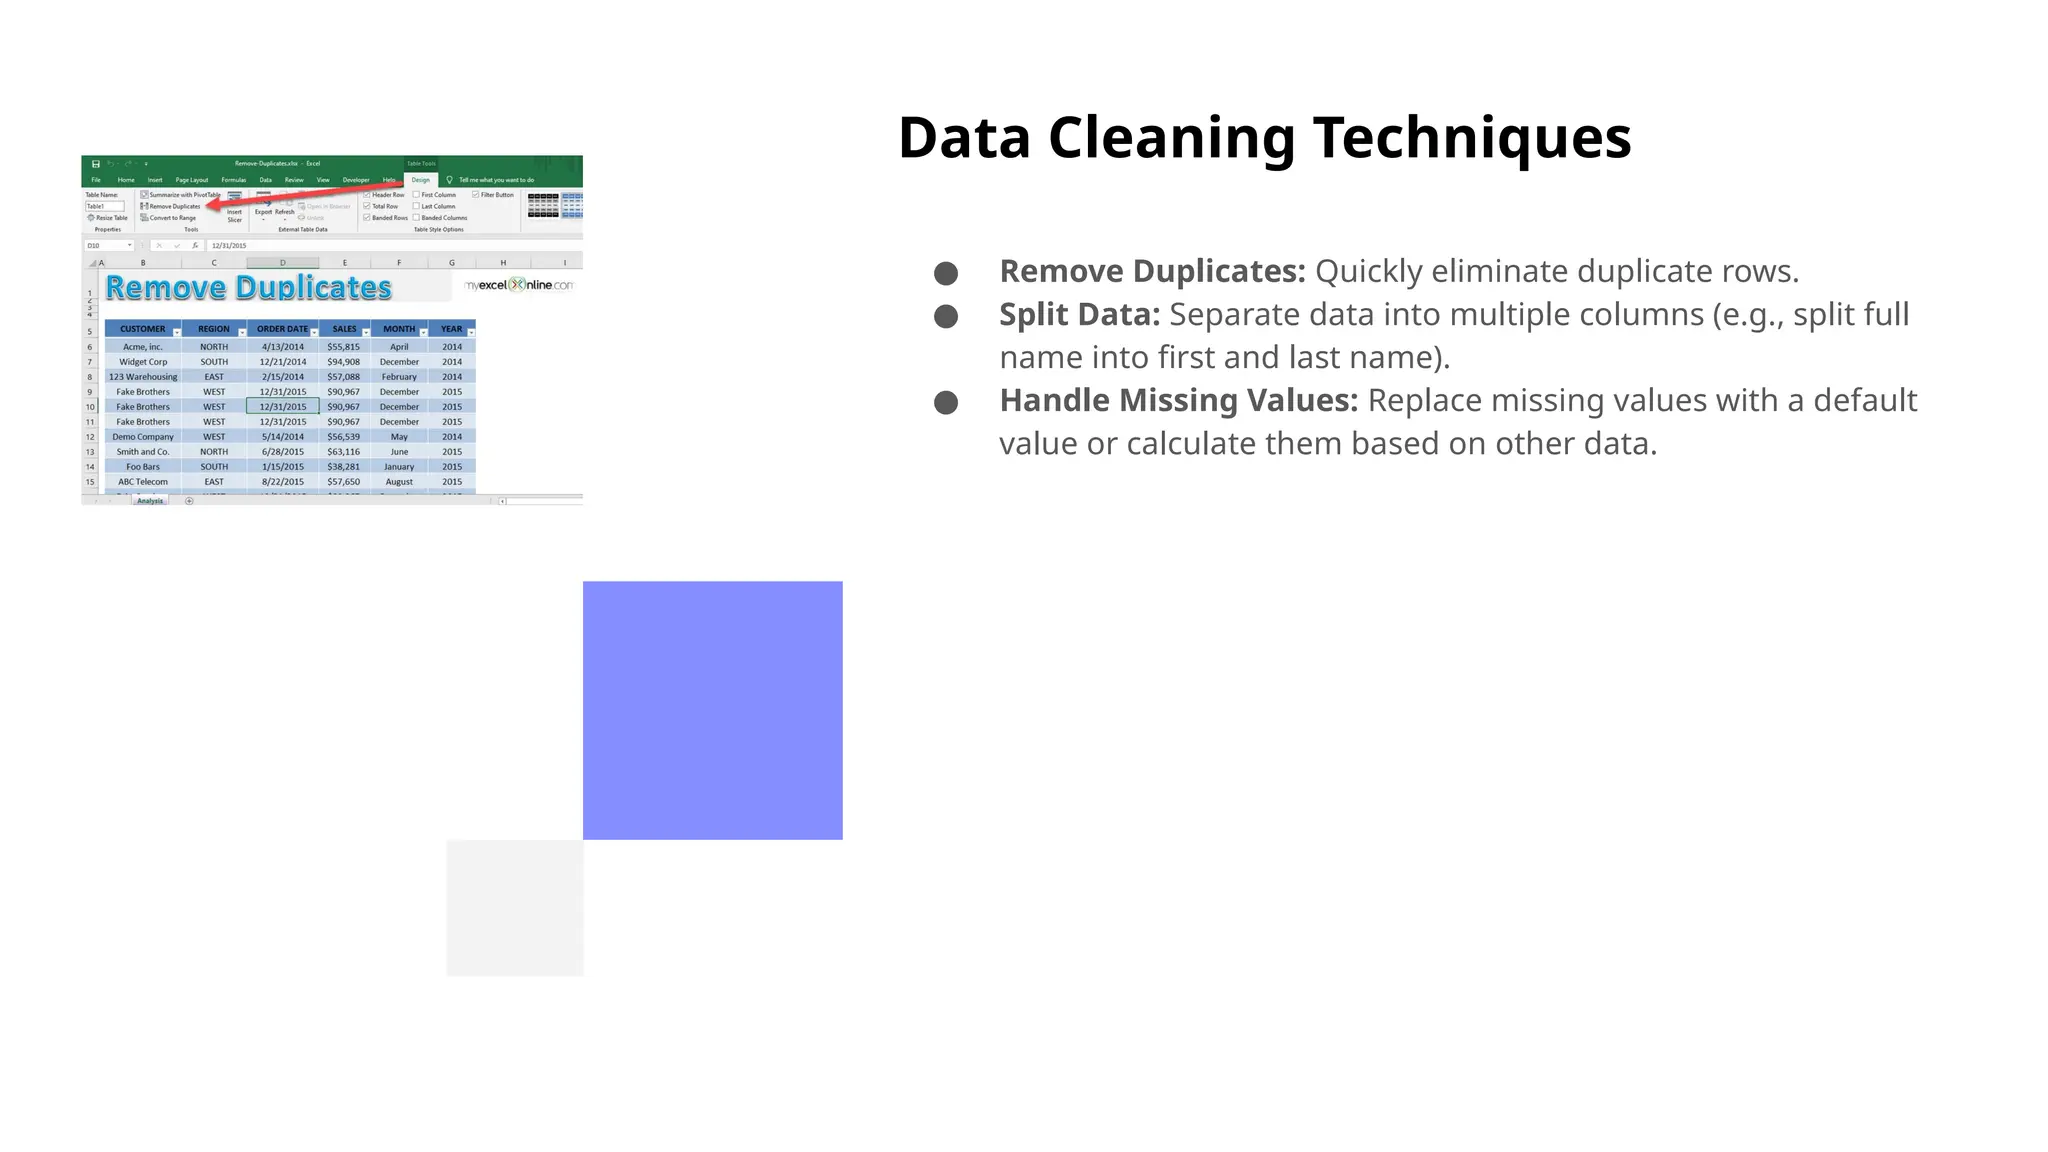
Data Cleaning Techniques
●Remove Duplicates: Quickly eliminate duplicate rows.
● Split Data: Separate data into multiple columns (e.g., split full
name into first and last name).
● Handle Missing Values: Replace missing values with a default
value or calculate them based on other data.
27.
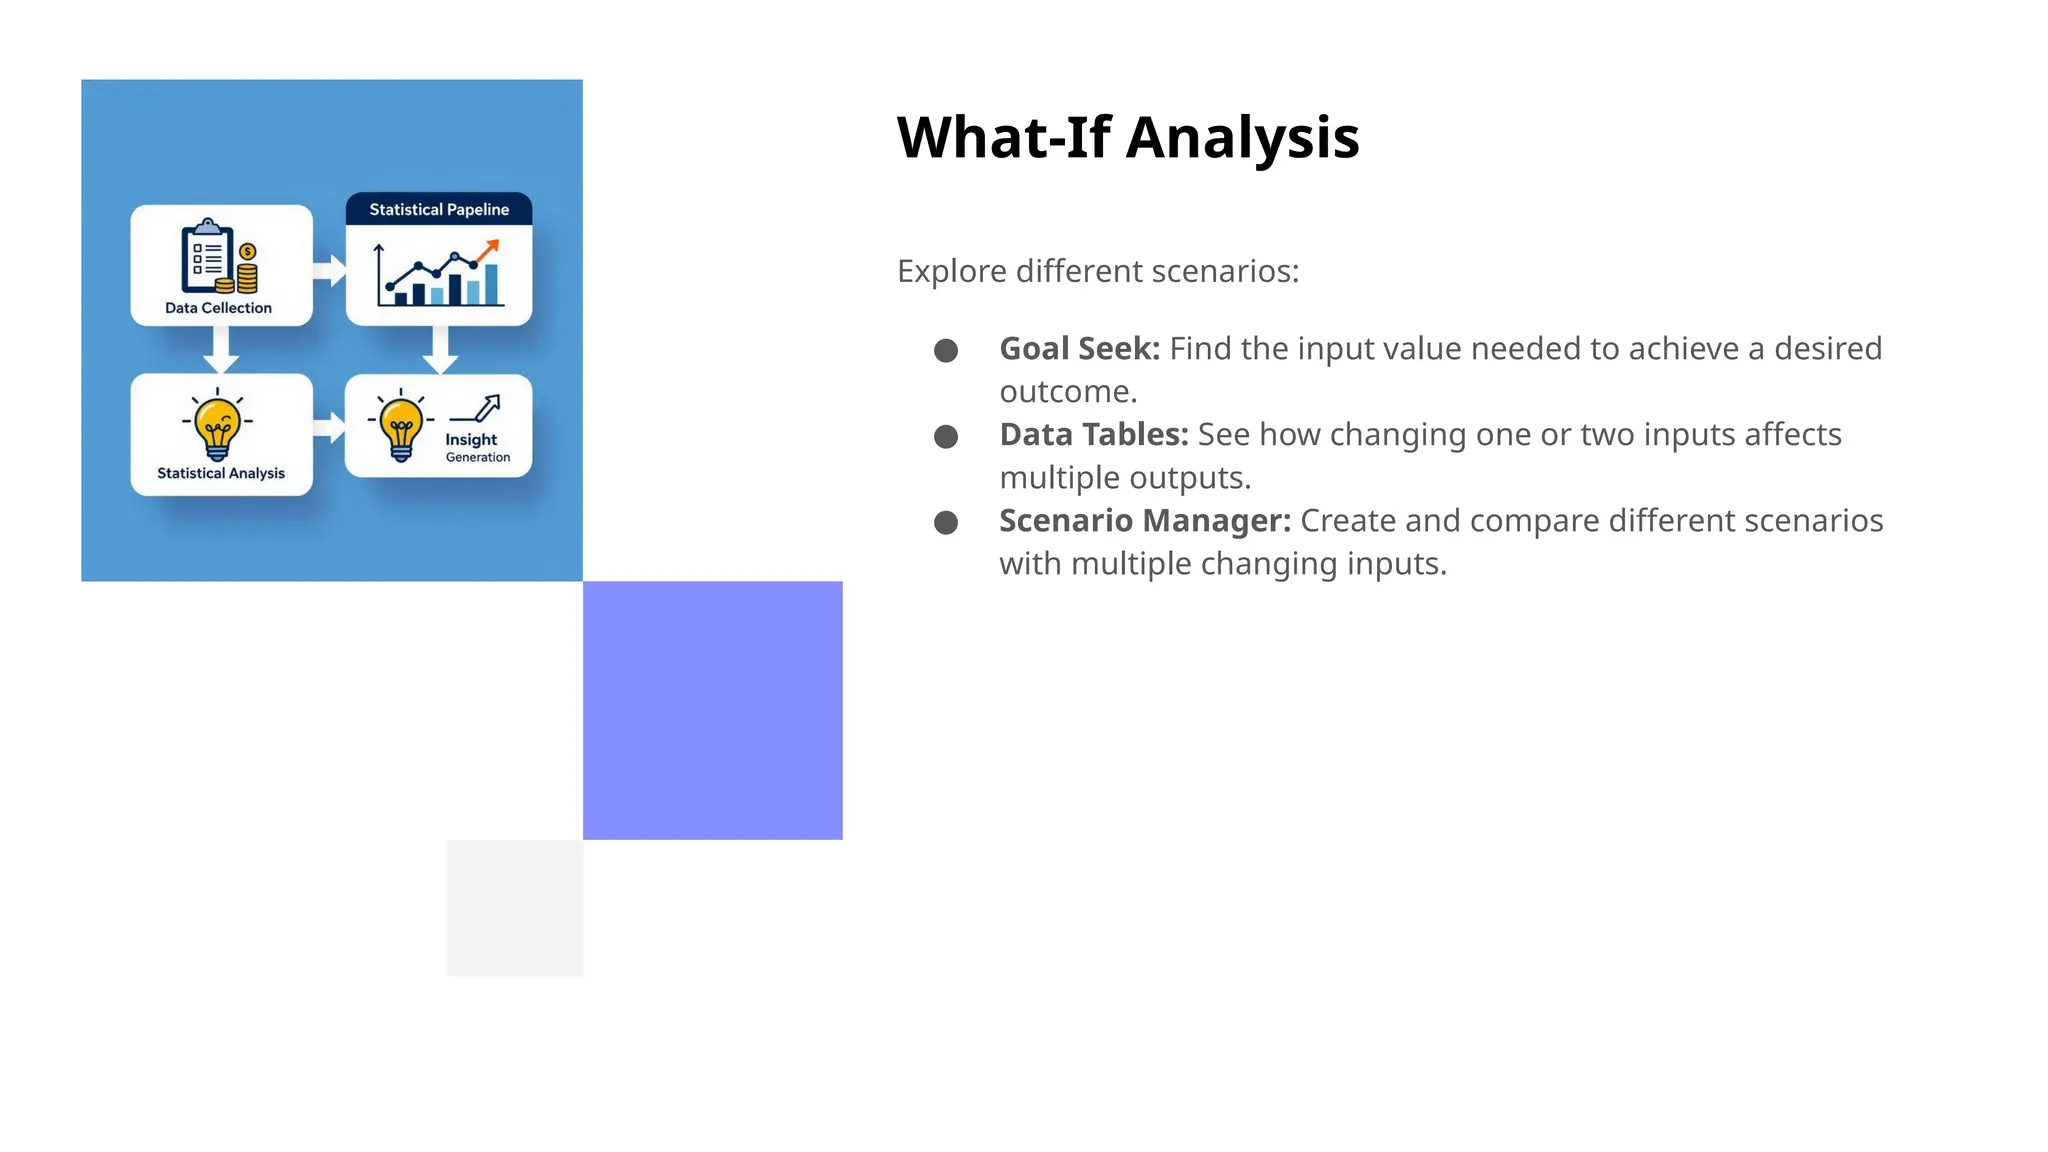
What-If Analysis
Explore differentscenarios:
● Goal Seek: Find the input value needed to achieve a desired
outcome.
● Data Tables: See how changing one or two inputs affects
multiple outputs.
● Scenario Manager: Create and compare different scenarios
with multiple changing inputs.
28.
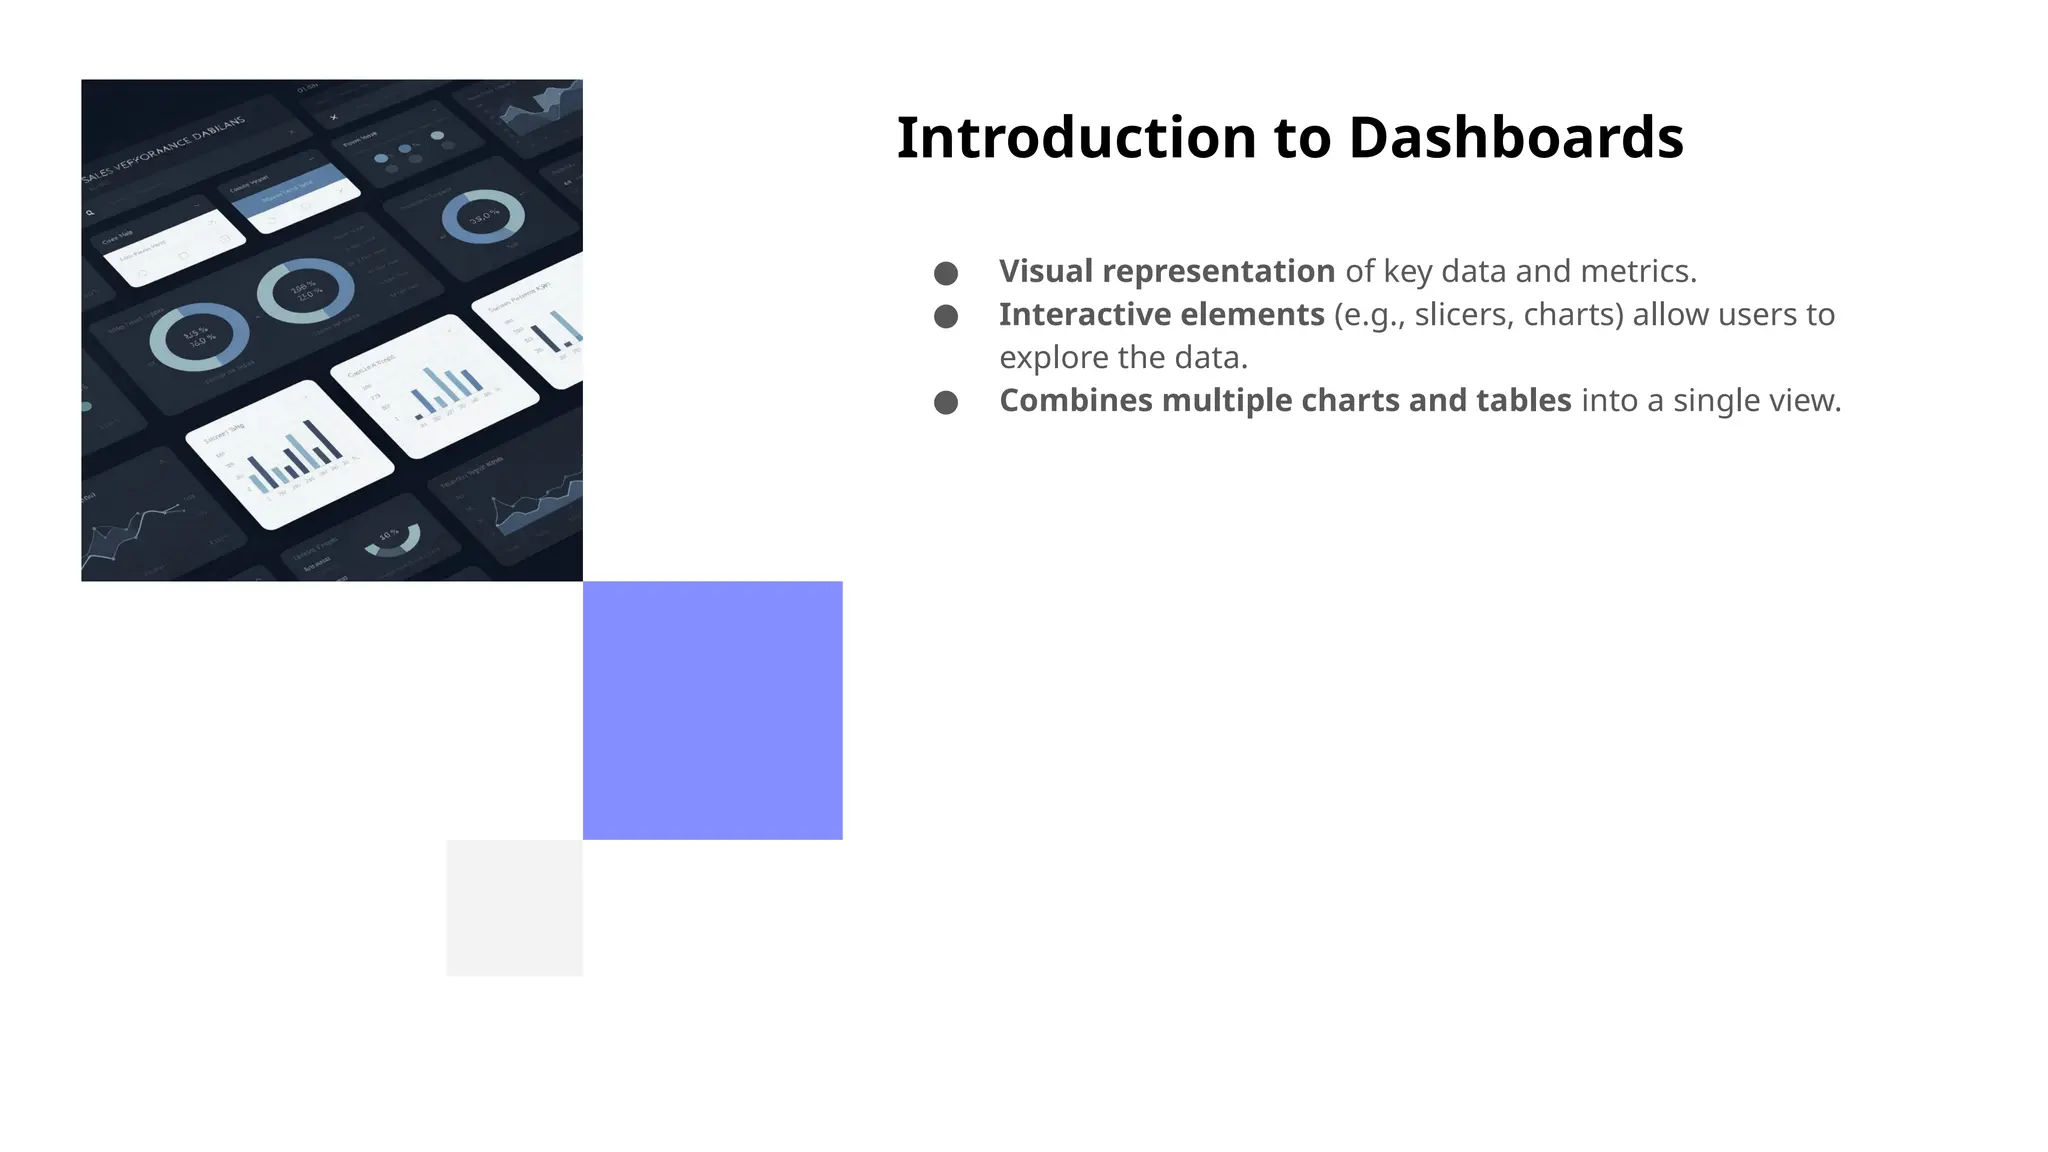
Introduction to Dashboards
●Visual representation of key data and metrics.
● Interactive elements (e.g., slicers, charts) allow users to
explore the data.
● Combines multiple charts and tables into a single view.
29.
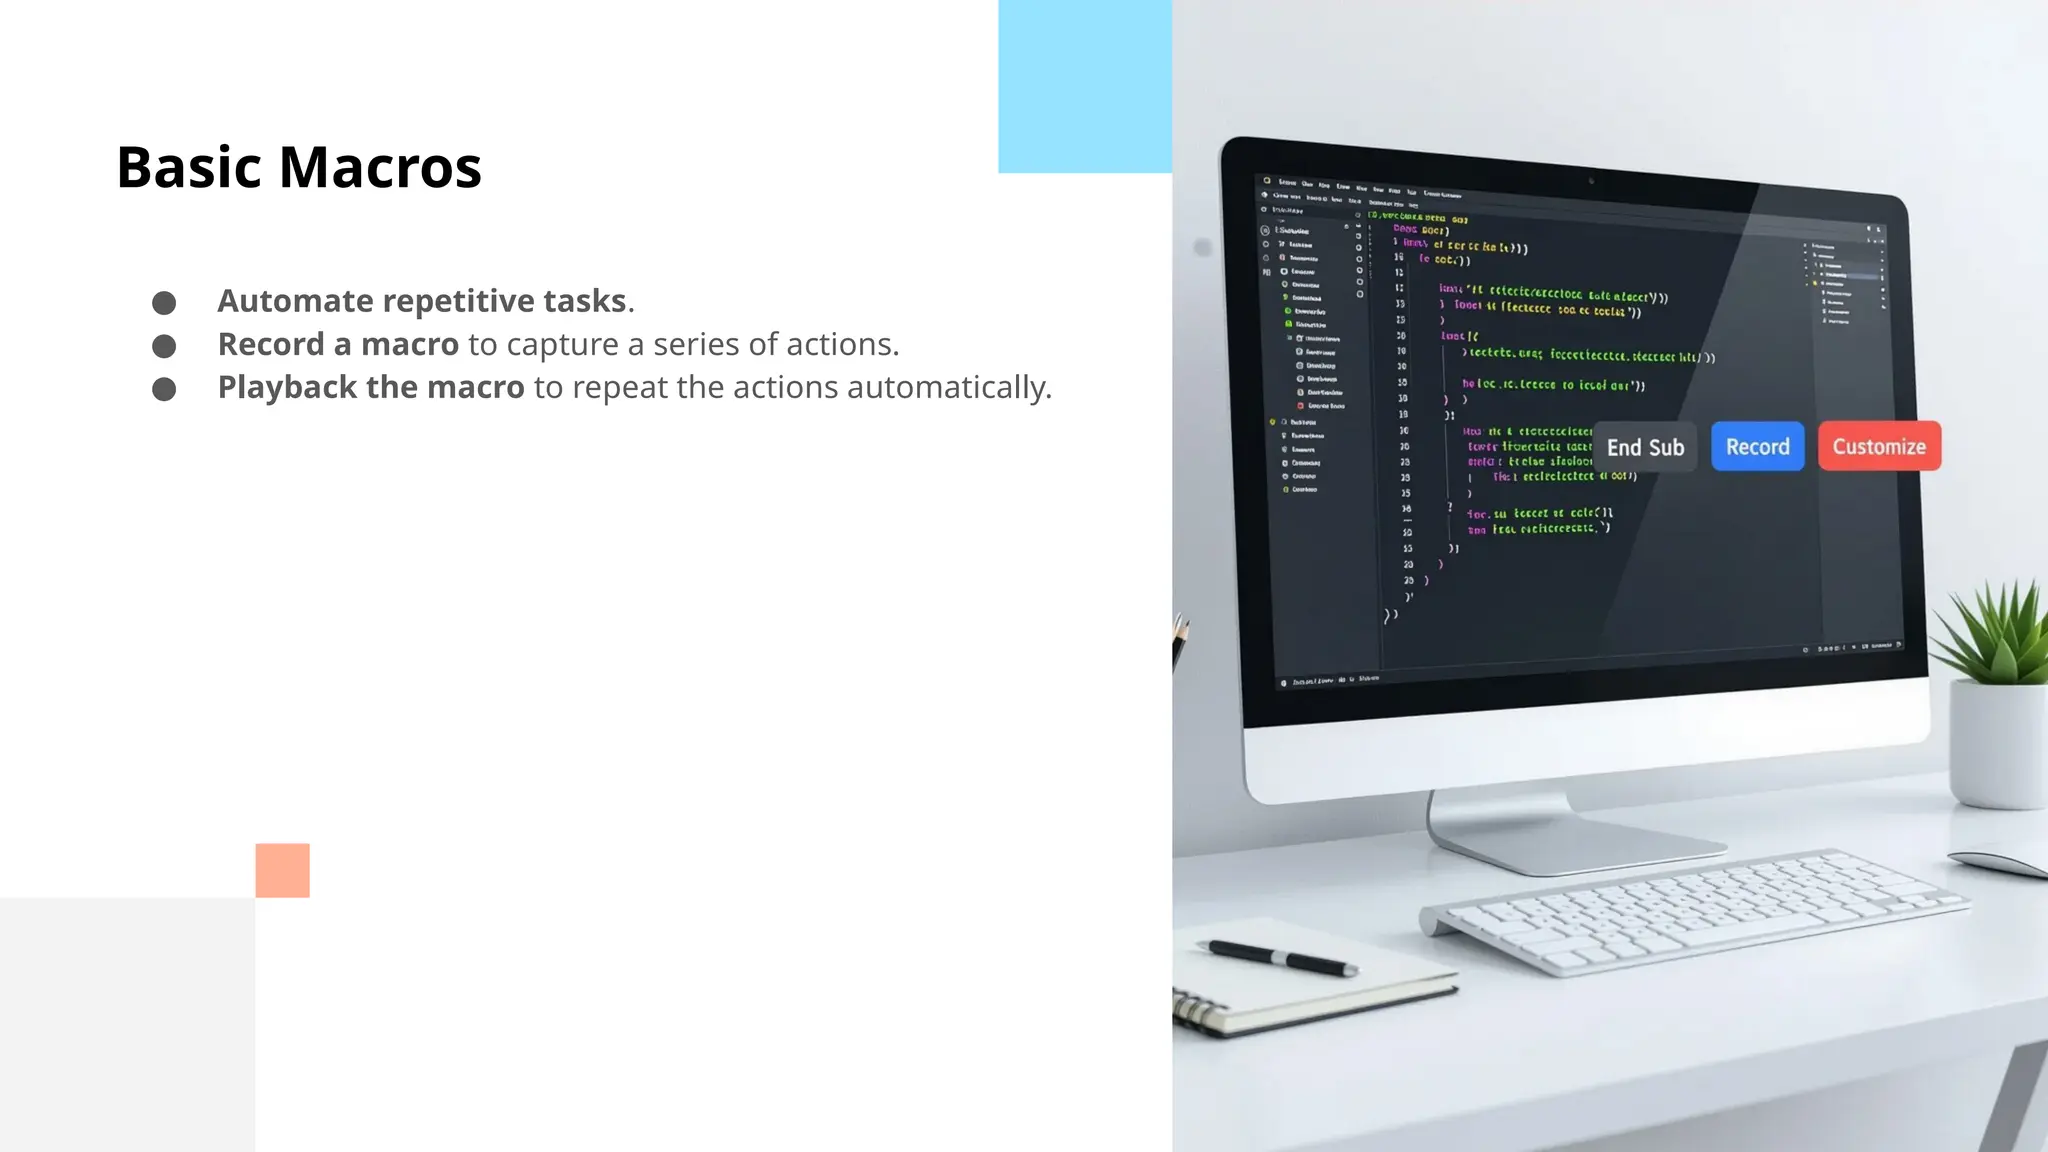
Basic Macros
● Automaterepetitive tasks.
● Record a macro to capture a series of actions.
● Playback the macro to repeat the actions automatically.
30.
VBA Overview
● VisualBasic for Applications (VBA) is the programming
language for Excel.
● Use VBA to create custom functions and automate
complex tasks.
● Advanced topic for faculty level.
31.
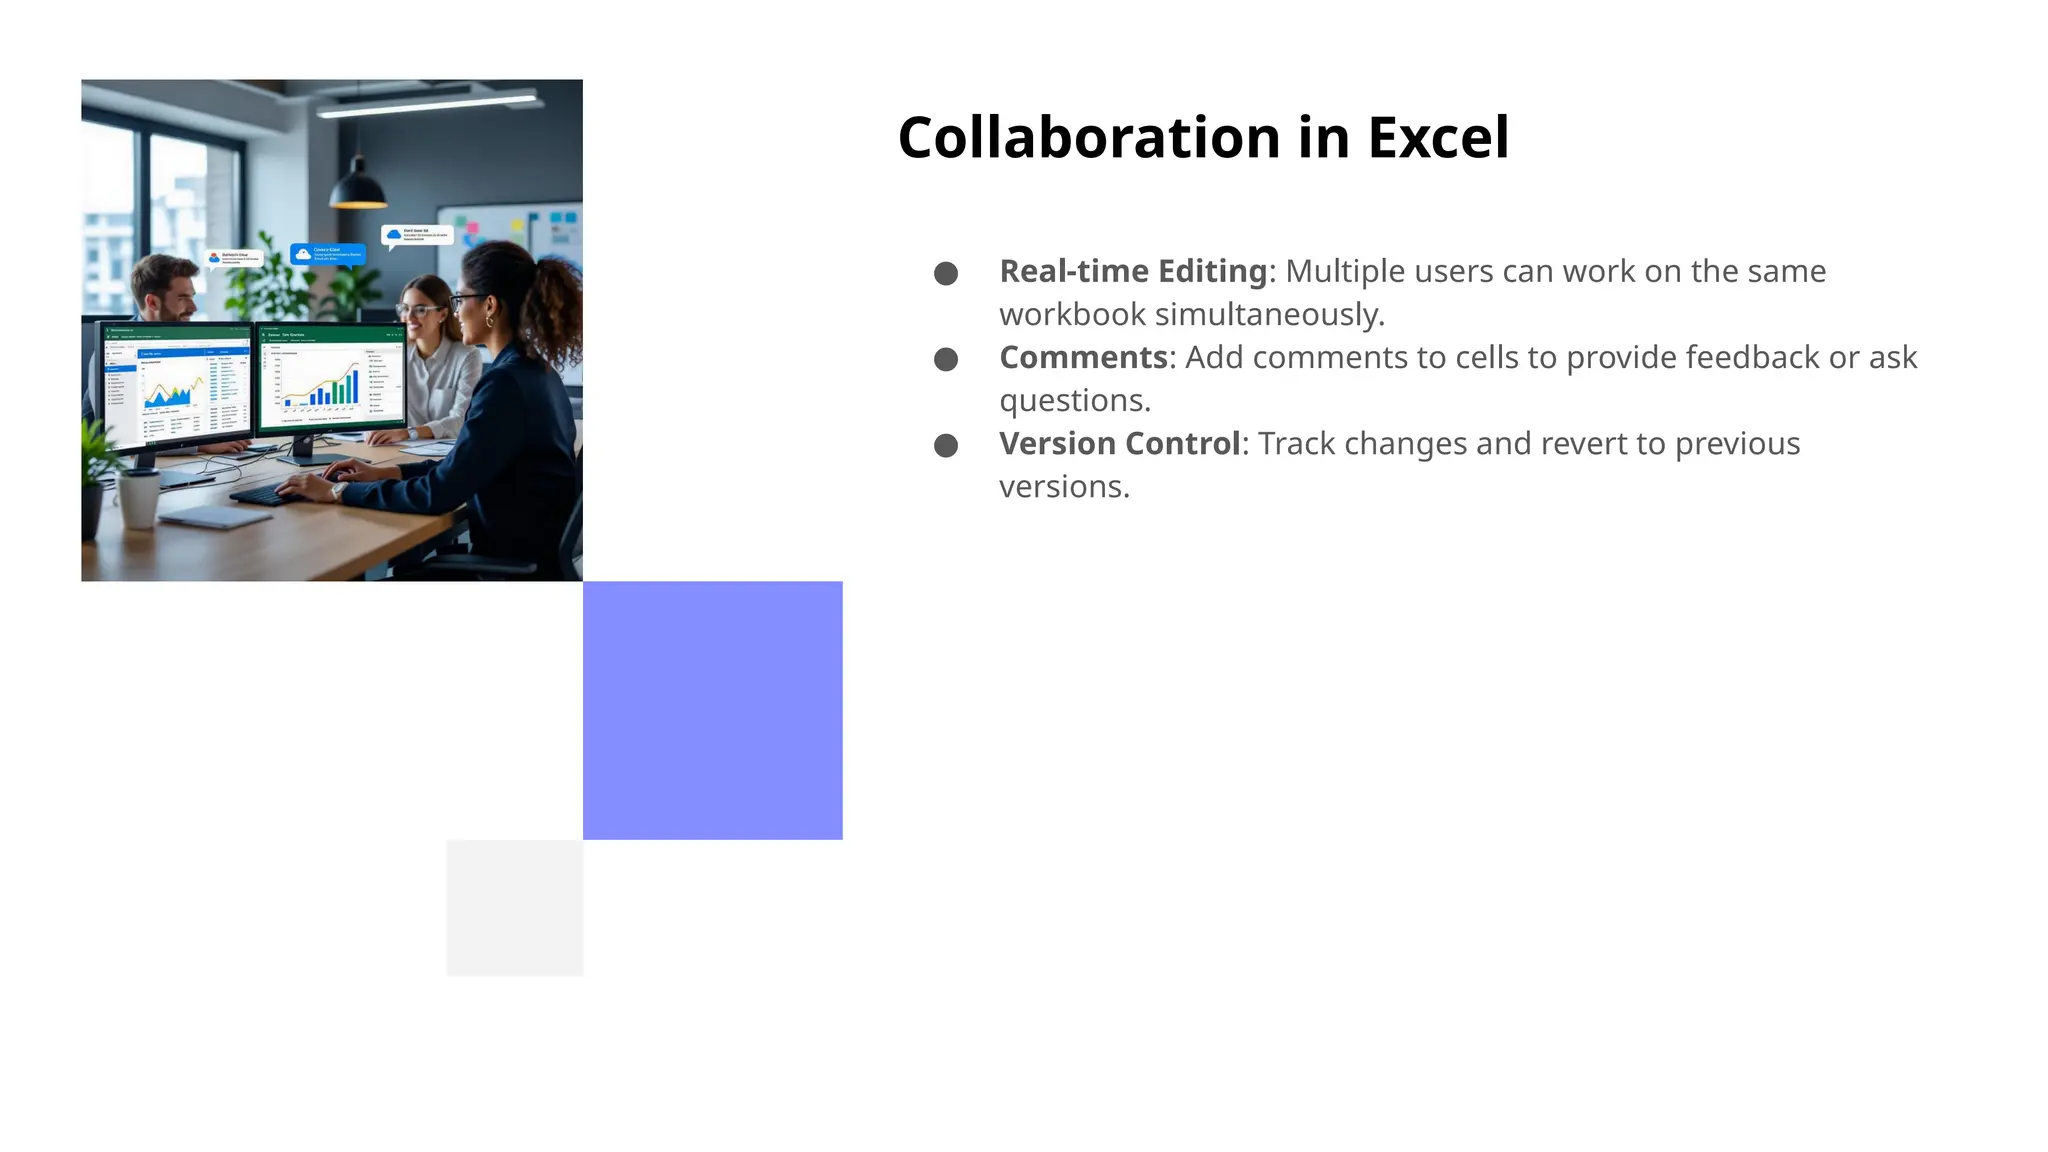
Collaboration in Excel
●Real-time Editing: Multiple users can work on the same
workbook simultaneously.
● Comments: Add comments to cells to provide feedback or ask
questions.
● Version Control: Track changes and revert to previous
versions.
32.
Excel and GoogleSheets
● Excel: Desktop application with advanced features.
● Google Sheets: Cloud-based spreadsheet program for
collaboration.
● Key Differences: Function availability, offline access,
collaboration features.
33.
Useful Add-ins andPlugins
● Power Query: Data transformation and cleaning.
● Power Pivot: Data modeling and analysis.
● Solver: Optimization and problem-solving.
34.
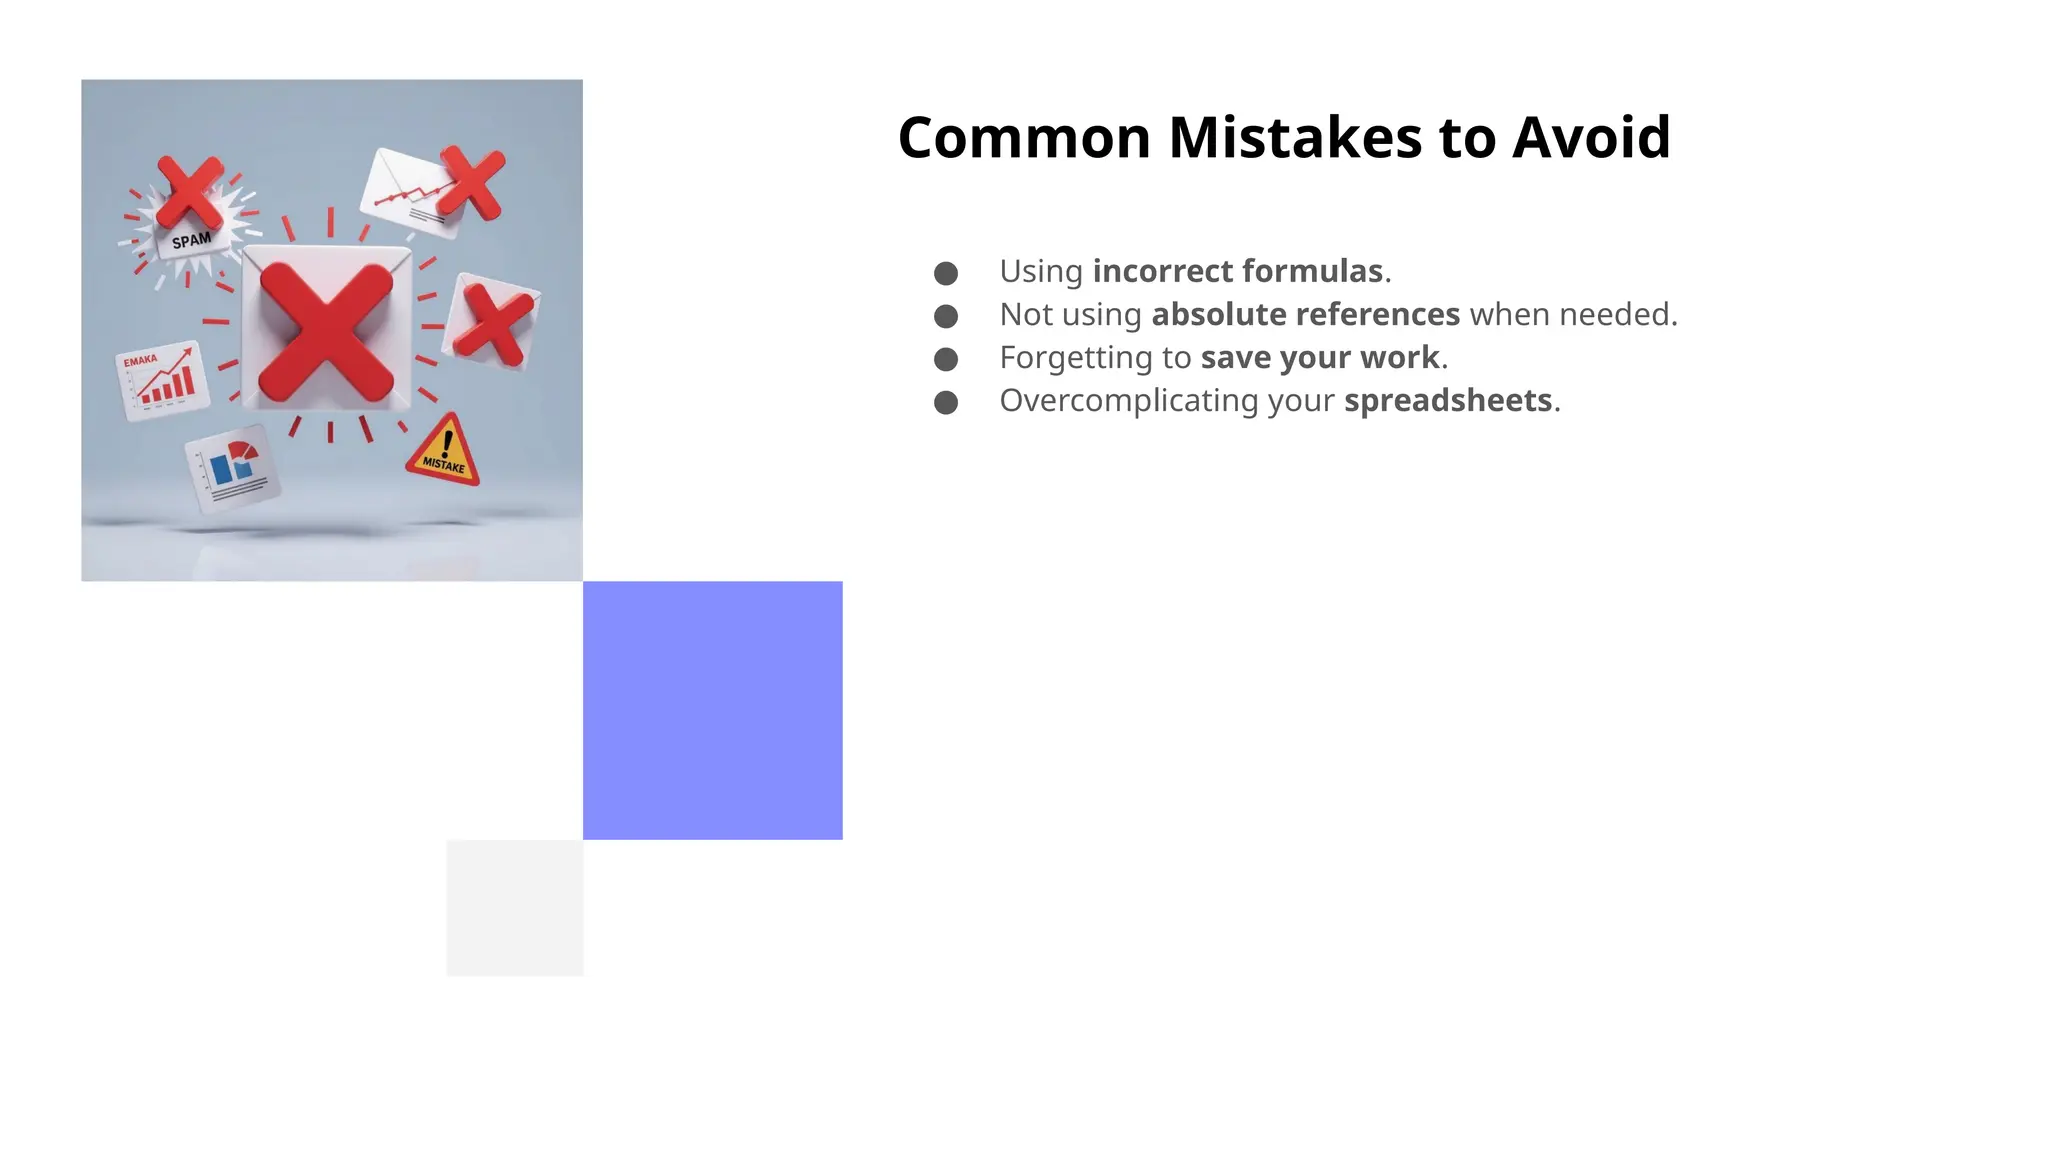
Common Mistakes toAvoid
● Using incorrect formulas.
● Not using absolute references when needed.
● Forgetting to save your work.
● Overcomplicating your spreadsheets.
35.
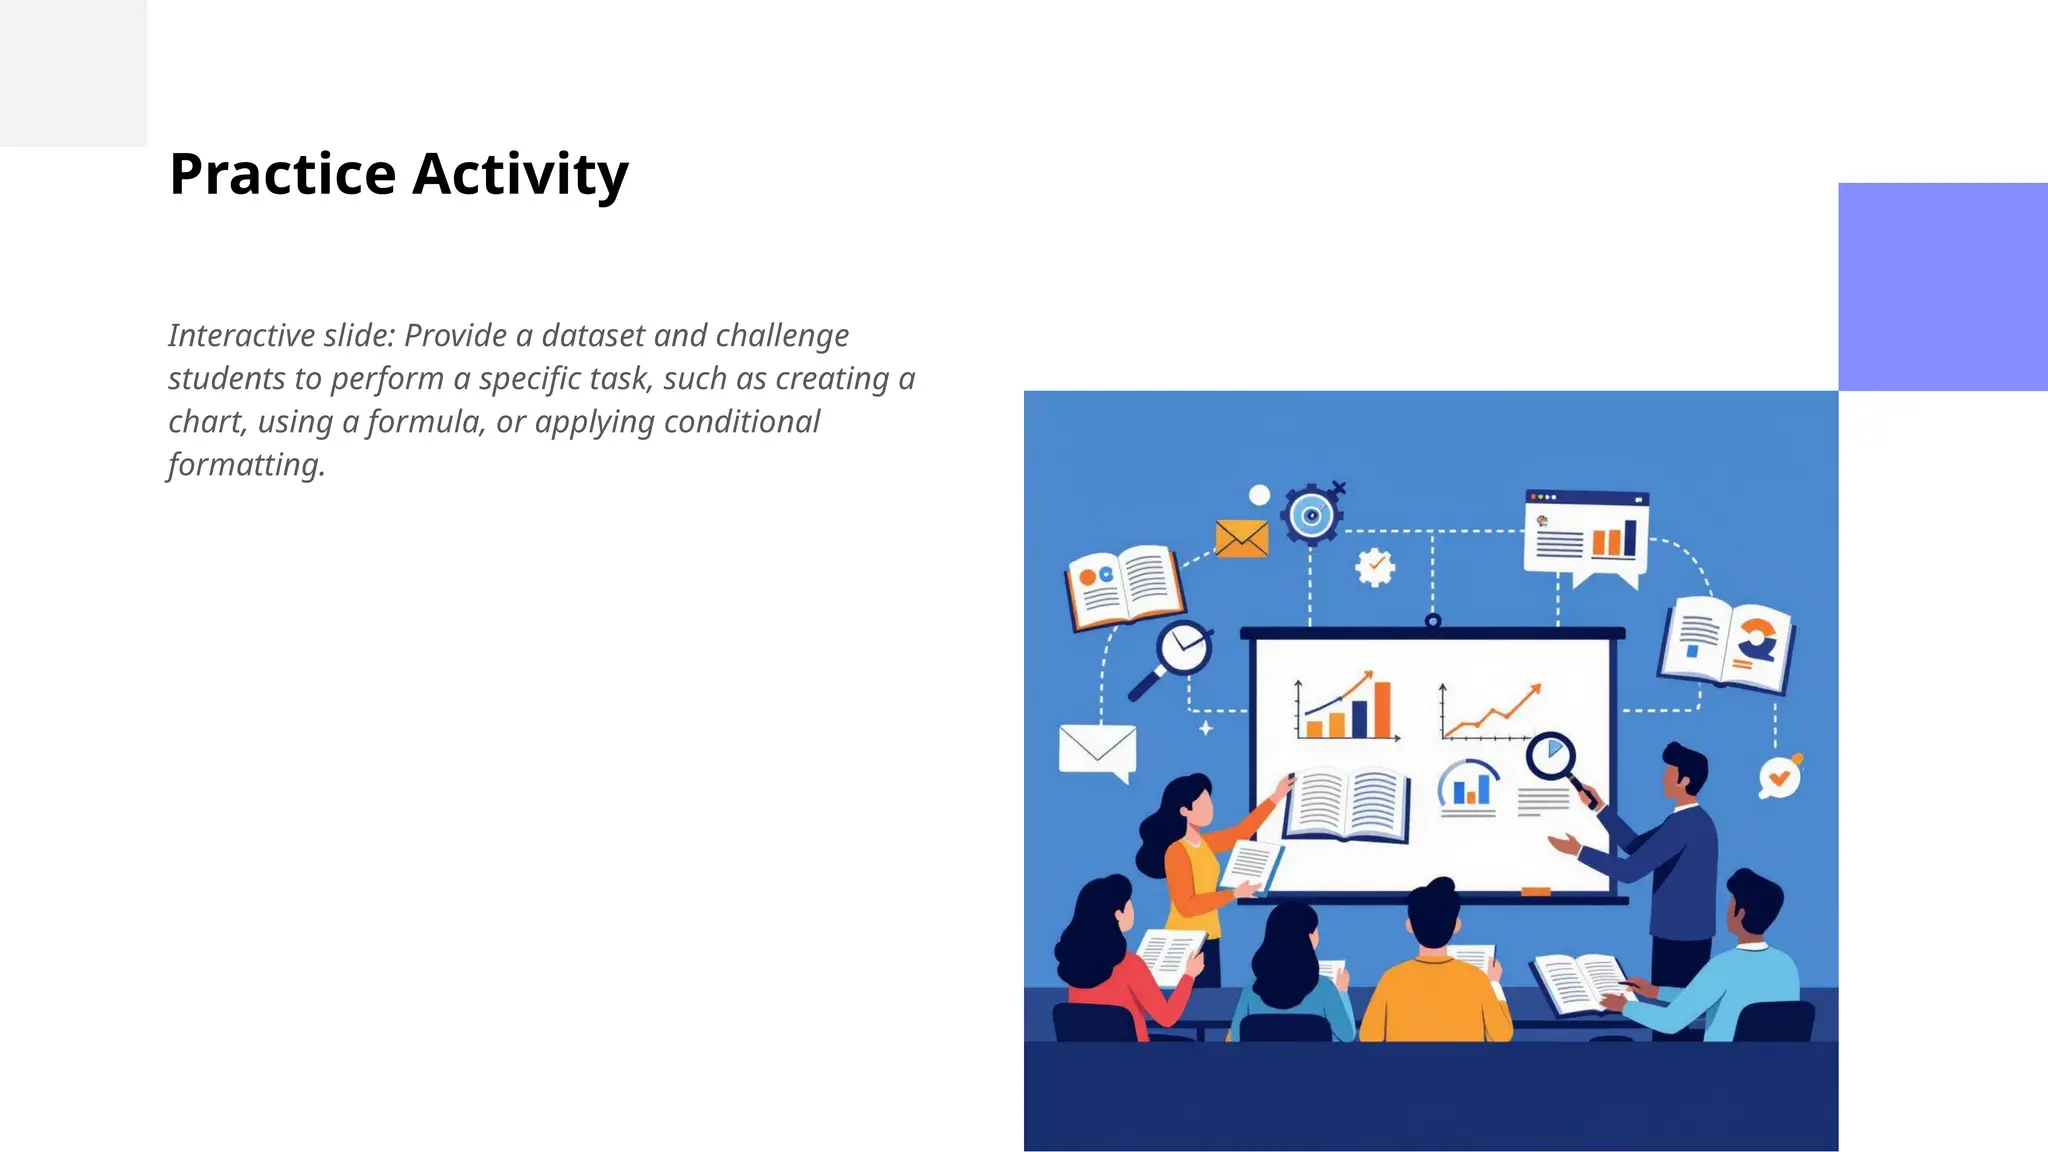
Practice Activity
Interactive slide:Provide a dataset and challenge
students to perform a specific task, such as creating a
chart, using a formula, or applying conditional
formatting.
36.
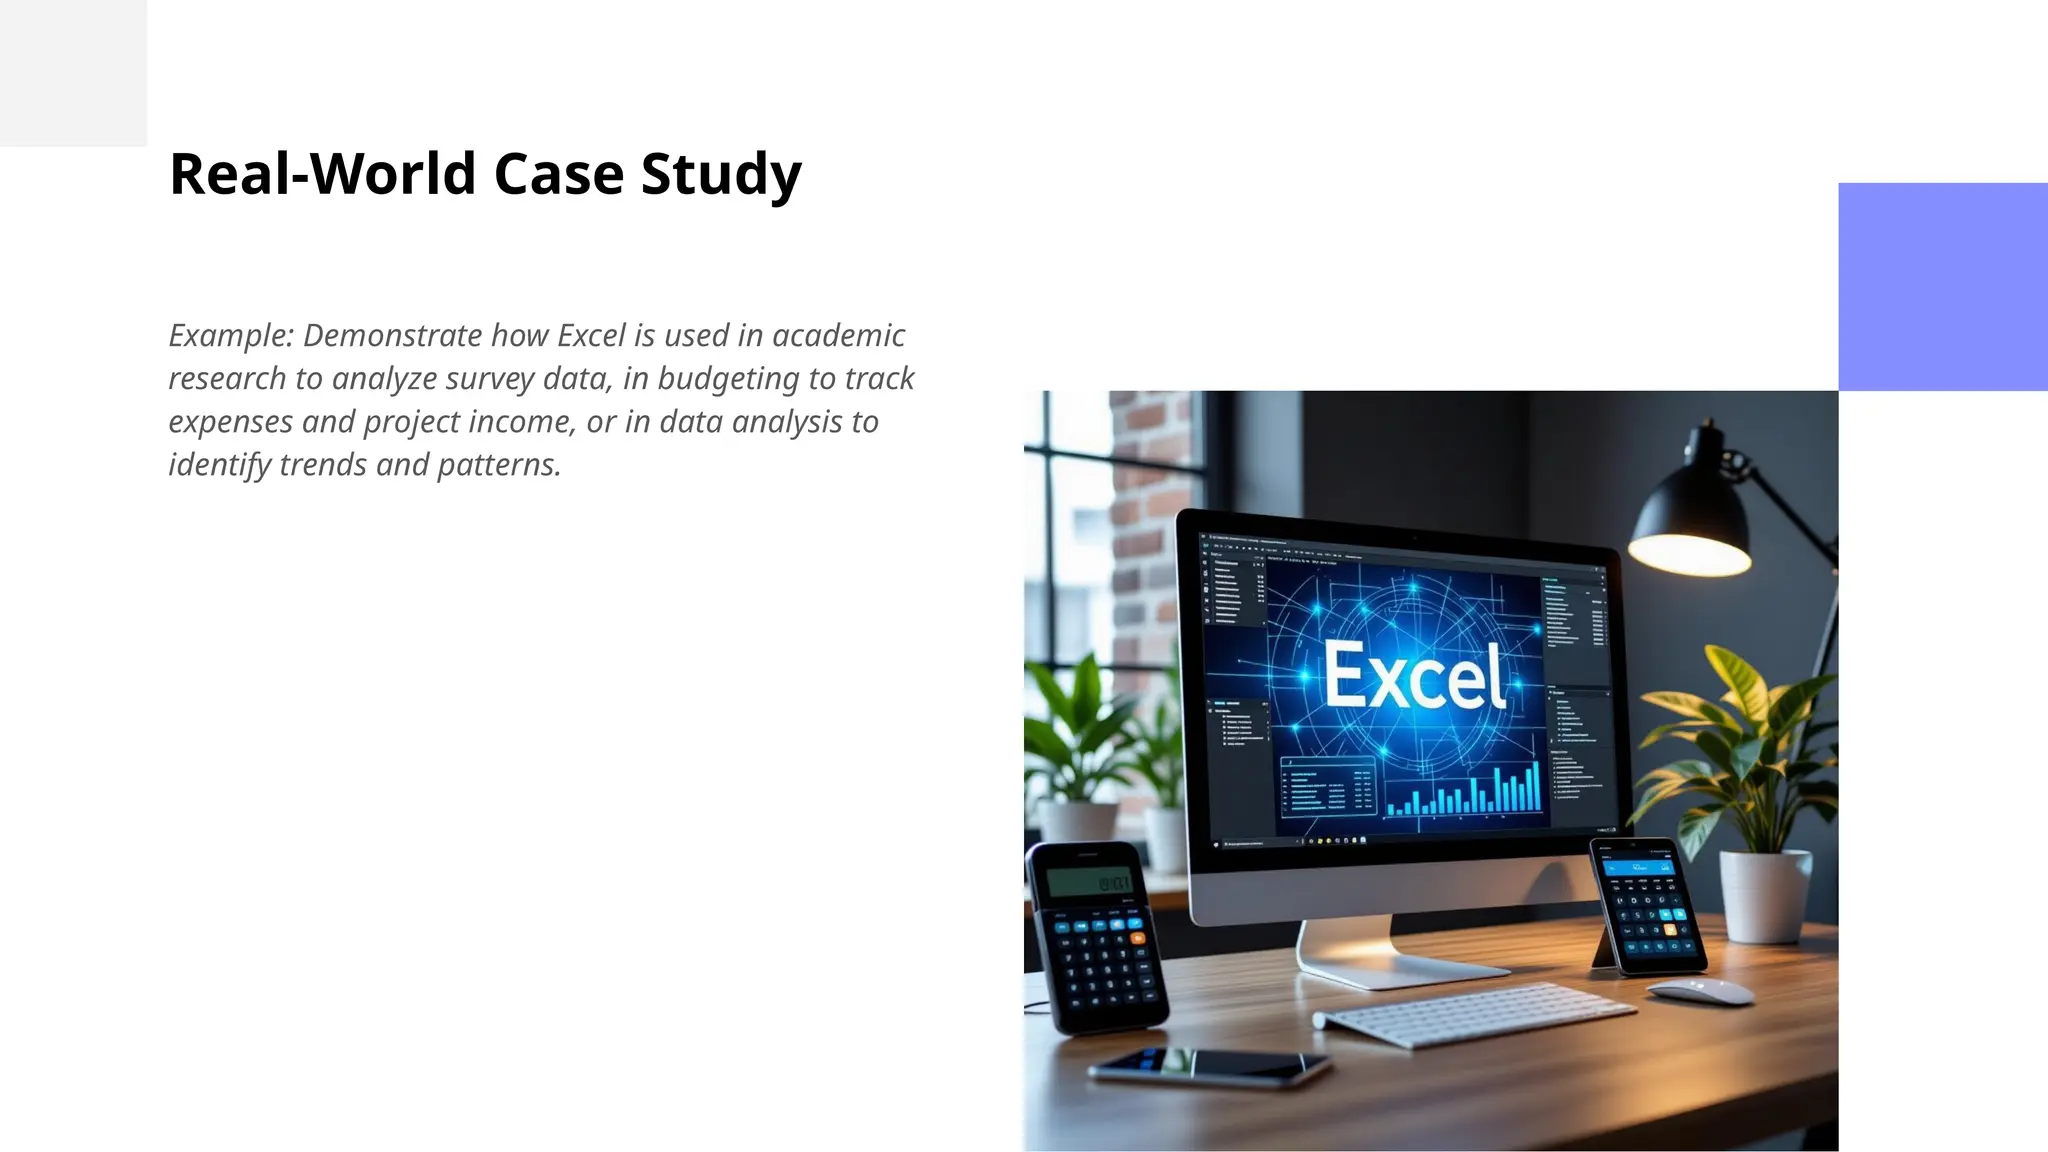
Real-World Case Study
Example:Demonstrate how Excel is used in academic
research to analyze survey data, in budgeting to track
expenses and project income, or in data analysis to
identify trends and patterns.
37.
Tips & Tricks
●Use keyboard shortcuts to save time.
● Explore the "Tell me" feature to quickly find commands.
● Customize the ribbon to add your favorite tools.
38.
Q&A / Discussion
Invitefaculty and students to ask questions or share
their favorite Excel use cases.
39.
Summary and Takeaways
●Excel is a versatile tool for data management and analysis.
● Mastering Excel can improve your academic, professional,
and personal life.
● Continue practicing and exploring new features to enhance
your skills.


![[DSC Europe 25] Marija Vlajkovic & Andrea Radonjanin - Integration of AI tool...](https://cdn.slidesharecdn.com/ss_thumbnails/qf1jrglttoc3bm8s3aop-final-integration-of-ai-tools-251208151905-394f3a6a-thumbnail.jpg?width=640&height=640&fit=bounds)


![[DSC Europe 25] Boris Perkovic - Lost in performance.pptx](https://cdn.slidesharecdn.com/ss_thumbnails/uq5hrp7vsuahqkxzifux-1-251204082258-fd2ee09d-thumbnail.jpg?width=640&height=640&fit=bounds)
![[DSC Europe 25] Goran Obradovic - The Rise of Sovereign AI: Building the Regi...](https://cdn.slidesharecdn.com/ss_thumbnails/7nw2xxixrxqdxvrb5wca-6-251205085714-ab09a2ac-thumbnail.jpg?width=640&height=640&fit=bounds)


![[DSC Europe 25] Bogdan Daniel Maruneac - AI - It starts with you.pptx](https://cdn.slidesharecdn.com/ss_thumbnails/odov3snhrcqs9hx5ny2n-4-251205085715-f1daacfe-thumbnail.jpg?width=640&height=640&fit=bounds)
![[DSC Europe 25] Vid Stimac - Policy Parsimony: Between Oversimplifying and Ov...](https://cdn.slidesharecdn.com/ss_thumbnails/eqlepagzqp2rhg3gbluh-dsc-stimac-251120-251205090438-059e7f54-thumbnail.jpg?width=640&height=640&fit=bounds)
![[DSC Europe 25] Dragan Vucic - Building the Learning Organization - How AI Tr...](https://cdn.slidesharecdn.com/ss_thumbnails/8brigo2sbu6qur6gxrra-7-251205085715-6ae07d24-thumbnail.jpg?width=640&height=640&fit=bounds)


![[DSC Europe 25] Dragana Ilic - AI for Big Data in Astronomy.pptx](https://cdn.slidesharecdn.com/ss_thumbnails/8palya86qaatvjhva1ms-2-dragana-ilic-ai-ilic-251208151906-652b819c-thumbnail.jpg?width=640&height=640&fit=bounds)


