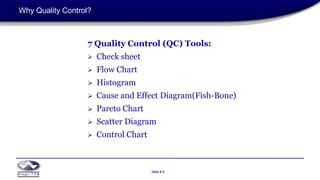
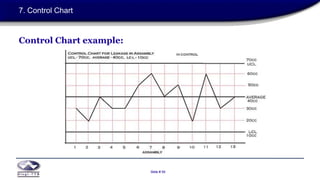
SlideShare a Scribd company logo
Slide # 1
Slide # 1
Quality Control (QC) Tools
Brief presentation
Location: DIVGI TORQTRANSFER SYSTEMS PVT LTD, SIRSI
Slide # 2
Slide # 2
As much as 95% of quality related problems in the
factory can be solved with seven fundamental
quantitative tools.”(Kaoru Ishikawa)
Why Quality Control?
Slide # 3
Slide # 3
Quality Control, or QC for short, is a process by which entities review the quality
of all factors involved in production. We need quality tools for
 problem solving,
 continual improvement and
 process measurement.
IATF:16949 defines quality control as “A part of quality management focused on
fulfilling customer-specific quality requirements”.
Why Quality Control?
Slide # 4
Slide # 4
This approach places an emphasis on three aspects;
 Elements such as control, job management, defined and well managed
processes, performance and integrity criteria, and identification of
records.
 Competence, such as knowledge, skill, experience, and qualifications.
 Soft elements, such as personnel, integrity, confidence, organizational
culture, motivation, team spirit, and quality relationship.
Why Quality Control?
Slide # 5
Slide # 5
7 Quality Control (QC) Tools:
 Check sheet
 Flow Chart
 Histogram
 Cause and Effect Diagram(Fish-Bone)
 Pareto Chart
 Scatter Diagram
 Control Chart
Why Quality Control?
Slide # 6
Slide # 6
CHECK SHEET
 Made popular by Kaoru Ishikawa
 Check sheet is a simplest way to assess common problems.
 The Check Sheet is a document that is used for collecting data in real time and
the location where the data is generated. The document is typically a blank
form that is designed for the quick, easy, and efficient recording of the desired
information.
 Data can be quantitative(numeric) or qualitative(non-numeric).
1. Check Sheet
Slide # 7
Slide # 7
When to use it?
 collecting data from a production process.
 To distinguish between fact and opinion.
 When data can be observed and collected repeatedly by same person and at
location.
 When collecting data on the frequency or problems, defects, defect location
and causes etc.
1. Check Sheet
Slide # 8
Slide # 8
Check Sheet Procedure:
 There is a standard format for an ISO/IATF certified company.
 Created all spaces on the form.
 Date, Shift, Component name, part number, batch, process number and name,
Entities to record and serial number. These are the standard sections in a
check sheet.
1. Check Sheet
Slide # 9
Slide # 9
Example of Check sheet:
1. Check Sheet
Slide # 10
Slide # 10
Benefits of Check Sheet:
 It is a simplest and effective way to display data.
 It is a good first step in understanding the nature of problem.
1. Check Sheet
Slide # 11
Slide # 11
Flow Chart:
 Draw a flowchart for whatever you do, until you do, you do not know,
what you are doing, you just have a job. ( Dr. Edward Deming)
 diagram commonly used in Process Engineering to indicate the general flow of
plant processes and equipment.
 displays the relationship between major equipment of the plant facility and
does not show minor details and designation
 Process Flow Diagram (PFD), Flow Sheet are other names for Flow Chart
2. Flow Chart
Slide # 12
Slide # 12
When to use a Flow Chart ? :
 To study process for improvement
 To develop understanding of how a process is done
 To communicate to other how is process is done
 To document a process
 When better communication needed between people involved with the same
process.
 When planning a project
2. Flow Chart
Slide # 13
Slide # 13
Flow Chart basic procedure :
 Discuss and decide on the boundaries of your process : where and when does
the process start? Where and when does it end? Discuss and decide on the
level of detail to be included in the diagram
 Identify the activities that take place. Write each on the note.
 Arrange the activities in proper sequences.
 When all activities are included and everyone agrees on correctness of
sequence, draw arrow to show the flow of the process.
 Review the flowchart with others involved in the process(workers, supervisors,
suppliers, customers)
2. Flow Chart
Slide # 14
Slide # 14
Example of Flow Chart:
Better description of process
Hitting snooze button 3 times
Makes the end process delay by
5 minutes each time
2. Flow Chart
Slide # 15
Slide # 15
Benefits of Flow Chart:
 Identify process that need improvement
 Depicts customer-supplier relationship
 Determine major and minor inputs in process
 Promotes process understanding
 Create visual map of the process.
2. Flow Chart
Slide # 16
Slide # 16
Histogram:
 Graphical representation of the distribution of numerical data
 Pictorial nature of histogram enables us to see patterns that are difficult to see
in check sheet/ table of numbers
 It shows the form of distribution by establishing the frequency of data within
range.
 Tells about patterns of variation
3. Histogram
Slide # 17
Slide # 17
When to use a Histogram:
 When the data are large and numerical.
 To compare measurement to specification.
 To communicate information to the team.
 To look where the central tendency of a process is.
 When analysing whether a process can meet customer’s requirement.
 To determine whether the outputs of two or more process are different.
3. Histogram
Slide # 18
Slide # 18
Histogram Procedure: (1/2)
 Arrange the collected data column wise in table form.
 Find and mark maximum and minimum value in each group. And in whole set
 Calculate the Range. (Range = max – min)
 Determine the numbers of class intervals for frequency e.g. <500 = 5 to 7,
500 to 1000 = 6 to 10, >1000 = 7 to 12
 Determine intervals(bucket) and boundaries. (Interval= range /class interval)
 Determine the frequencies of each class interval with tallies / Excel
3. Histogram
Slide # 19
Slide # 19
Histogram Procedure: (2/2)
 Mark and label frequency at vertical scale
 Mark and label measurement value at the horizontal scale
 Draw the columns according to frequencies
 Label the histogram
3. Histogram
Slide # 20
Slide # 20
Histogram example:
3. Histogram
Slide # 21
Slide # 21
Histogram example:
3. Histogram
Slide # 22
Slide # 22
Histogram example:
3. Histogram
Slide # 23
Slide # 23
Histogram Analysis: (1/2)
1) Normal: common pattern (bell-shaped) known as normal distribution(ND)
2) Skewed: asymmetrical because a limit prevents outcome on one side.
3) Double-picked or bimodal: looks like back of two-humped camel
4) Plateau: called multimodal distribution. Several processes with ND
combined
5) Comb: the bars are alternatively tall and short.
6) Truncated or heart-cut: looks like ND with tails cut off
3. Histogram
Slide # 24
Slide # 24
Histogram Analysis: (2/2)
7) Dog food: its missing something – results near the average.
8) Edge peak: Normal distribution except that it has large peak at one tail.
3. Histogram
Slide # 25
Slide # 25
Benefits of Histogram:
 Simple to use, visualise, and interpret.
 Process monitoring and centering.
 To know whether process produces within specification.
 To know whether process is stable and predictable.
 Application to all variable data.
3. Histogram
Slide # 26
Slide # 26
Cause and Effect Diagram:
 Also known as Ishikawa Diagram, Fishbone diagram, herringbone diagram.
 Shows relationship between a problem and its possible causes
 Explore potential causes and help identify root causes.
 Where and why the process isn’t working
 Used for product design, quality defect prevention
 Each cause for imperfection is a source of variation.
4. Cause and Effect Diagram
Slide # 27
Slide # 27
When to use Cause and Effect Diagram:
1) When identifying possible causes for a problem.
2) To analyse existing problems.
3) For problem-solving.
4) To sort out interactions among factors for a cause.
4. Cause and Effect Diagram
Slide # 28
Slide # 28
Why to use Cause and Effect Diagram?
1) Group participation and knowledge sharing.
2) To determine root cause of a problem.
3) Increases knowledge of a process and its factors.
4) Identifies area for further data collection
5) For process improvement.
4. Cause and Effect Diagram
Slide # 29
Slide # 29
Cause and Effect Diagram procedure:
1) Identify and define a problem statement (effect)
2) Identify major categories of causes of problem. General ones are 6Ms
1. Man(personnel) 4. Material
2. Machine 5. Measurement
3. Method 6. Mother Nature (Environment)
3) Write categories as branches for the effect.
4) Brainstorm all the possible causes of problem and write details
5) Write sub-branches, continue to ask “why?” to find deeper level of cause
4. Cause and Effect Diagram
Slide # 30
Slide # 30
Cause and Effect Diagram Example:
4. Cause and Effect Diagram
Slide # 31
Slide # 31
Benefits of Cause and Effect Diagram:
1) Making a diagram is educational in itself.
2) Indicates possible causes of variation
3) Focus is on ”causes” rather than “symptoms”.
4) Improve team performance and effectiveness.
5) Improve process knowledge.
6) Set as a standard for future similar effects.
4. Cause and Effect Diagram
Slide # 32
Slide # 32
Pareto Chart:
 Named after Vilfredo Pareto, is a type of chart contains bars & line graph.
 States that, for many event, roughly 80% of the trouble comes from 20% of
the problems
 Individual values are in descending order by bars, cumulative total is
represented by the line.
 Values of statistical variable are placed in order of relative frequency, reveals
which factors have the greatest impact and where attention is likely to yield the
greatest benefit.
5. Pareto Chart/Analysis
Slide # 33
Slide # 33
When to use Pareto Chart ? :
1) When analysing data about frequency of problems or causes in a process.
2) When there are many problems or causes and you want to focus on the most
significant.
3) When analysing broad causes by looking at their specific components.
4) When communicating with others about your data.
5) Allow better use of limited resources.
5. Pareto Chart/Analysis
Slide # 34
Slide # 34
Pareto Chart procedure : (1/2)
1) Decide what categories to use to group items.
2) Decide what measurement is appropriate, common measurement are
frequency, quantity, cost and time.
3) Decide the the period of time this chart will cover; one work cycle, full day,
month ?
4) Collect the data, recording the category each time
5) Subtotal the measurement for each category and plot bars in descending
order.
6) Calculate the percentage and plot cumulative total % along with it.
5. Pareto Chart/Analysis
Slide # 35
Slide # 35
Pareto Chart procedure : (2/2)
7) Focus on the area which falls under 80% of cumulative percentage
8) Note: There are many tools which we can get pareto results by just inputting
the data.
5. Pareto Chart/Analysis
Slide # 36
Slide # 36
Pareto Chart Example : (2/2)
5. Pareto Chart/Analysis
Slide # 37
Slide # 37
Benefits of Pareto Chart Example :
 Identifies “major” problems
 Improves team performance and effectiveness
 Before and after tracking of a problem in chart
 Helps for continual improvement
 Cost reduction and customer satisfaction
5. Pareto Chart/Analysis
Slide # 38
Slide # 38
Benefits of Pareto Chart Example :
 Identifies “major” problems
 Improves team performance and effectiveness
 Before and after tracking of a problem in chart
 Helps for continual improvement
 Cost reduction and customer satisfaction
5. Pareto Chart/Analysis
Slide # 39
Slide # 39
Scatter Diagram:
 Is a visual and statistical testing tool. Called as Scatter Plot or X-Y graph
 Used to investigate the possible relationship between two variables that relate
to the same event. To arrive at quantitative conclusion.
 Makes it easy to spot trends and correlations.
 If variables are correlated, the points fall among a line or curve.
 The better the correlation, tighter the points near the line.
6. Scatter Diagram
Slide # 40
Slide # 40
When to use Scatter Diagram ? :
 When we have paired numerical data.
 When dependent variable may have multiple values for each value of
independent variable.
 In problem-solving to establish a root cause.
 To confirm a hypothesis
 When testing for autocorrelation before constructing a control chart
6. Scatter Diagram
Slide # 41
Slide # 41
Scatter Diagram procedure :
1) Collect pairs of data; independent and dependent variable.
2) Independent variable on the horizontal axis and dependent on vertical axis
3) For each pair of data, put a dot where X-axis intersects Y-axis’ value.
4) Look at the pattern of points to see if a relationship is obvious.
5) If the data clearly form a line or curve, then the variables are correlated. Then,
can be proceeded to correlation analysis
6. Scatter Diagram
Slide # 42
Slide # 42
Scatter Diagram Analysis :
Patterns of correlation
6. Scatter Diagram
Slide # 43
Slide # 43
Scatter Diagram Analysis :
The local cold drink shop track of how much cold drink bottle they sell versus the noon
temperature of that day. Data for the last 10 days.
6. Scatter Diagram
We can also draw a “line of best fit”
on scatter diagram
Slide # 44
Slide # 44
Control Chart:
 Is a special type graph used to detect the special causes in the process over
time.
 Used for monitoring, improving quality and measure consistency of a process
or machine.
 Has a central line for average, upper line for Upper Control Limit(UCL), lower
line for lower control limit(LCL).
 These lines are determined from historical data of process or machine.
 By comparing current data to these line, you can draw result easily about
whether the variation is in control or out of control.
7. Control Chart
Slide # 45
Slide # 45
When to use Control Chart ? :
1) When identifying variation at its source.
2) When predicting the expected range of outcomes from a process.
3) When visual displaying for process output.
4) When determining whether a process is stable.
5) To monitor, control and improve.
7. Control Chart
Slide # 46
Slide # 46
Types of Control Chart :
7. Control Chart
Slide # 47
Slide # 47
Types of Control Chart :
7. Control Chart
Slide # 48
Slide # 48
Types of Control Chart :
1. For variables : for the characteristics that can be measured (X-R Chart)
2. For attributes : for the characteristics that can be judges as pass or fail, defective or ok, go are no-go etc.
· R chart – in this chart, the sample range are plotted in order to control the variability of a variable.
· S chart – in this chart, the sample standard deviations are plotted in order to control the variability of
variable.
· C chart – in this chart, plot the number of defectives (per day, per batch or per machine)
· U chart – in this chart, plot the number of defectives divided by the numbers of units inspected
(numbers of batches)
· Np chart – in this chart, plot the number of the defectives as in the C chart. However, the control
limit in this chart are not based on the distribution rare events, but rather on the binomial distribution.
· P chart – in this chart, plot the percent of defectives as in the U chart, However, the control limit in this chart are not
based on the distribution rare events, but rather on the binomial distribution.
7. Control Chart
Slide # 49
Slide # 49
Control Chart procedure:
1) Choose the correct control chart for your data.
2) Determine the appropriate time period for collecting and plotting data.
3) Collect data, draw chart and analyse
4) Look for “in-control” or “out-of-control” condition
5) For “out-of-control” signal, mark it on the chart and investigate the cause.
6) Document how you investigated, what you learned, the cause and it was
corrected.
7. Control Chart
Slide # 50
Slide # 50
Control Chart example:
7. Control Chart
Slide # 51
Slide # 51
Benefits of Control Chart:
 Easy and simple to study and maintain.
 It is an effective tool to control the process statistically
 It provides information about capability.
 Tool which help to reduce variation.
 Helps to detect changes in the process over a period of time and take corrective
action
7. Control Chart
Slide # 52
Slide # 52
PRODUCT LEADERSHIP
LIKE NO OTHER
Thank You

More Related Content

What's hot

Statistical Process Control
Statistical Process ControlStatistical Process Control
Statistical Process Control
Nicola Mezzetti
 
Spc training
Spc trainingSpc training
Spc training
PRASHANT KSHIRSAGAR
 
Statistical Process Control in Detail
Statistical Process Control in Detail Statistical Process Control in Detail
Statistical Process Control in Detail
Umar Saeed
 
Root cause analysis
Root cause analysisRoot cause analysis
Root cause analysis
Krishnan Lakshmi Narayanan
 
7 qc tools
7 qc tools7 qc tools
7 qc tools
Romelie Escano
 
7 qc tools training material[1]
7 qc tools training material[1]7 qc tools training material[1]
7 qc tools training material[1]gurmukh singh
 
04 ppap training material
04 ppap training material04 ppap training material
04 ppap training material營松 林
 
Mini-Training: Using root-cause analysis for problem management
Mini-Training: Using root-cause analysis for problem managementMini-Training: Using root-cause analysis for problem management
Mini-Training: Using root-cause analysis for problem management
Betclic Everest Group Tech Team
 
Problem Solving:9S Methodology
Problem Solving:9S MethodologyProblem Solving:9S Methodology
Problem Solving:9S Methodology
Michael Venner
 
Msa training
Msa trainingMsa training
Msa training
AlokSharma348
 
A3 Management (Part 1 of 2)
A3 Management (Part 1 of 2)A3 Management (Part 1 of 2)
A3 Management (Part 1 of 2)
TKMG, Inc.
 
10. measurement system analysis (msa)
10. measurement system analysis (msa)10. measurement system analysis (msa)
10. measurement system analysis (msa)
Hakeem-Ur- Rehman
 
Value Stream Mapping: Case Studies
Value Stream Mapping: Case StudiesValue Stream Mapping: Case Studies
Value Stream Mapping: Case Studies
TKMG, Inc.
 
Statistical Process Control
Statistical Process ControlStatistical Process Control
Statistical Process Control
Tushar Naik
 
Measurement System Analysis - Module 1
Measurement System Analysis - Module 1Measurement System Analysis - Module 1
Measurement System Analysis - Module 1
Subhodeep Deb
 
Measurement System Analysis
Measurement System AnalysisMeasurement System Analysis
Measurement System Analysis
Qualimation Technologies
 
WEBINAR: Introduction to DMAIC
WEBINAR: Introduction to DMAICWEBINAR: Introduction to DMAIC
WEBINAR: Introduction to DMAIC
GoLeanSixSigma.com
 
Measurement System Analysis - Module 2
Measurement System Analysis - Module 2Measurement System Analysis - Module 2
Measurement System Analysis - Module 2
Subhodeep Deb
 
7QC Tools
7QC Tools7QC Tools
7QC Tools
Jitesh Gaurav
 

What's hot (20)

Statistical Process Control
Statistical Process ControlStatistical Process Control
Statistical Process Control
 
Spc training
Spc trainingSpc training
Spc training
 
Statistical Process Control in Detail
Statistical Process Control in Detail Statistical Process Control in Detail
Statistical Process Control in Detail
 
Root cause analysis
Root cause analysisRoot cause analysis
Root cause analysis
 
7 qc tools
7 qc tools7 qc tools
7 qc tools
 
7 qc tools training material[1]
7 qc tools training material[1]7 qc tools training material[1]
7 qc tools training material[1]
 
04 ppap training material
04 ppap training material04 ppap training material
04 ppap training material
 
Mini-Training: Using root-cause analysis for problem management
Mini-Training: Using root-cause analysis for problem managementMini-Training: Using root-cause analysis for problem management
Mini-Training: Using root-cause analysis for problem management
 
Problem Solving:9S Methodology
Problem Solving:9S MethodologyProblem Solving:9S Methodology
Problem Solving:9S Methodology
 
Msa training
Msa trainingMsa training
Msa training
 
A3 Management (Part 1 of 2)
A3 Management (Part 1 of 2)A3 Management (Part 1 of 2)
A3 Management (Part 1 of 2)
 
8D problem solving
8D problem solving8D problem solving
8D problem solving
 
10. measurement system analysis (msa)
10. measurement system analysis (msa)10. measurement system analysis (msa)
10. measurement system analysis (msa)
 
Value Stream Mapping: Case Studies
Value Stream Mapping: Case StudiesValue Stream Mapping: Case Studies
Value Stream Mapping: Case Studies
 
Statistical Process Control
Statistical Process ControlStatistical Process Control
Statistical Process Control
 
Measurement System Analysis - Module 1
Measurement System Analysis - Module 1Measurement System Analysis - Module 1
Measurement System Analysis - Module 1
 
Measurement System Analysis
Measurement System AnalysisMeasurement System Analysis
Measurement System Analysis
 
WEBINAR: Introduction to DMAIC
WEBINAR: Introduction to DMAICWEBINAR: Introduction to DMAIC
WEBINAR: Introduction to DMAIC
 
Measurement System Analysis - Module 2
Measurement System Analysis - Module 2Measurement System Analysis - Module 2
Measurement System Analysis - Module 2
 
7QC Tools
7QC Tools7QC Tools
7QC Tools
 

Similar to 7 QC(Quality Control) Tools

New 7QC tools for the quality person during RCa
New 7QC tools for the quality person during RCaNew 7QC tools for the quality person during RCa
New 7QC tools for the quality person during RCa
AravindhNagaraj1
 
7 quality control tools
7 quality  control tools7 quality  control tools
7 quality control tools
Vima Mali
 
Seven Basic Quality Control Tools أدوات ضبط الجودة السبعة
Seven Basic Quality Control Tools أدوات ضبط الجودة السبعةSeven Basic Quality Control Tools أدوات ضبط الجودة السبعة
Seven Basic Quality Control Tools أدوات ضبط الجودة السبعة
Mohamed Khaled
 
Em33832837
Em33832837Em33832837
Em33832837
IJERA Editor
 
Qa improvement
Qa improvementQa improvement
Qa improvement
Jitesh Gaurav
 
7 QC Tools For Problem Solving Presentation.pdf
7 QC Tools For Problem Solving Presentation.pdf7 QC Tools For Problem Solving Presentation.pdf
7 QC Tools For Problem Solving Presentation.pdf
OlivierNgono
 
CHAPTER 7.pptx
CHAPTER 7.pptxCHAPTER 7.pptx
CHAPTER 7.pptx
CristyDocdocos1
 
Quality_Control_Tools.ppt
Quality_Control_Tools.pptQuality_Control_Tools.ppt
Quality_Control_Tools.ppt
Murali Sama rao
 
#The 7 Basic Quality Tools For Process Improvement - By SN Panigrahi
#The 7 Basic Quality Tools For Process Improvement - By SN Panigrahi#The 7 Basic Quality Tools For Process Improvement - By SN Panigrahi
#The 7 Basic Quality Tools For Process Improvement - By SN Panigrahi
SN Panigrahi, PMP
 
Use of Seven Quality Tools to Improve Quality and Productivity in Industry
Use of Seven Quality Tools to Improve Quality and Productivity in IndustryUse of Seven Quality Tools to Improve Quality and Productivity in Industry
Use of Seven Quality Tools to Improve Quality and Productivity in Industry
ijsrd.com
 
Seven Basic Tools of QC and their Applications
Seven Basic Tools of QC and their ApplicationsSeven Basic Tools of QC and their Applications
Seven Basic Tools of QC and their Applications
DrJayantaKumarMahato1
 
Quality Improvement Of Fan Manufacturing Industry By Using Basic Seven Tools ...
Quality Improvement Of Fan Manufacturing Industry By Using Basic Seven Tools ...Quality Improvement Of Fan Manufacturing Industry By Using Basic Seven Tools ...
Quality Improvement Of Fan Manufacturing Industry By Using Basic Seven Tools ...
Sulaman Muhammad
 
Quality Improvement Of Fan Manufacturing Industry By Using Basic Seven Tools ...
Quality Improvement Of Fan Manufacturing Industry By Using Basic Seven Tools ...Quality Improvement Of Fan Manufacturing Industry By Using Basic Seven Tools ...
Quality Improvement Of Fan Manufacturing Industry By Using Basic Seven Tools ...
IJERA Editor
 
Production and Quality Tools: The Basic Seven Quality Tools
Production and Quality Tools: The Basic Seven Quality ToolsProduction and Quality Tools: The Basic Seven Quality Tools
Production and Quality Tools: The Basic Seven Quality Tools
Dr. John V. Padua
 
Total Quality Management part 2
Total Quality Management part 2  Total Quality Management part 2
Total Quality Management part 2
Tahani Alyamani, MBA
 
Grade11_Q1-W7-PreparingInterpretingTechdraw.pdf
Grade11_Q1-W7-PreparingInterpretingTechdraw.pdfGrade11_Q1-W7-PreparingInterpretingTechdraw.pdf
Grade11_Q1-W7-PreparingInterpretingTechdraw.pdf
Victor Sinangote
 
7qc_tools_173.ppt for 7 QC tools implementation of the quality
7qc_tools_173.ppt for 7 QC tools implementation of the quality7qc_tools_173.ppt for 7 QC tools implementation of the quality
7qc_tools_173.ppt for 7 QC tools implementation of the quality
MANISHDUBEY14500
 
The 7 QC Tools - English (19 Pages).ppt
The 7 QC Tools - English (19 Pages).pptThe 7 QC Tools - English (19 Pages).ppt
The 7 QC Tools - English (19 Pages).ppt
AnkitSharma509599
 
old seven quality control tools
old seven quality control toolsold seven quality control tools
old seven quality control tools
Vivek Singh Chauhan
 

Similar to 7 QC(Quality Control) Tools (20)

Ch04 spc
Ch04 spcCh04 spc
Ch04 spc
 
New 7QC tools for the quality person during RCa
New 7QC tools for the quality person during RCaNew 7QC tools for the quality person during RCa
New 7QC tools for the quality person during RCa
 
7 quality control tools
7 quality  control tools7 quality  control tools
7 quality control tools
 
Seven Basic Quality Control Tools أدوات ضبط الجودة السبعة
Seven Basic Quality Control Tools أدوات ضبط الجودة السبعةSeven Basic Quality Control Tools أدوات ضبط الجودة السبعة
Seven Basic Quality Control Tools أدوات ضبط الجودة السبعة
 
Em33832837
Em33832837Em33832837
Em33832837
 
Qa improvement
Qa improvementQa improvement
Qa improvement
 
7 QC Tools For Problem Solving Presentation.pdf
7 QC Tools For Problem Solving Presentation.pdf7 QC Tools For Problem Solving Presentation.pdf
7 QC Tools For Problem Solving Presentation.pdf
 
CHAPTER 7.pptx
CHAPTER 7.pptxCHAPTER 7.pptx
CHAPTER 7.pptx
 
Quality_Control_Tools.ppt
Quality_Control_Tools.pptQuality_Control_Tools.ppt
Quality_Control_Tools.ppt
 
#The 7 Basic Quality Tools For Process Improvement - By SN Panigrahi
#The 7 Basic Quality Tools For Process Improvement - By SN Panigrahi#The 7 Basic Quality Tools For Process Improvement - By SN Panigrahi
#The 7 Basic Quality Tools For Process Improvement - By SN Panigrahi
 
Use of Seven Quality Tools to Improve Quality and Productivity in Industry
Use of Seven Quality Tools to Improve Quality and Productivity in IndustryUse of Seven Quality Tools to Improve Quality and Productivity in Industry
Use of Seven Quality Tools to Improve Quality and Productivity in Industry
 
Seven Basic Tools of QC and their Applications
Seven Basic Tools of QC and their ApplicationsSeven Basic Tools of QC and their Applications
Seven Basic Tools of QC and their Applications
 
Quality Improvement Of Fan Manufacturing Industry By Using Basic Seven Tools ...
Quality Improvement Of Fan Manufacturing Industry By Using Basic Seven Tools ...Quality Improvement Of Fan Manufacturing Industry By Using Basic Seven Tools ...
Quality Improvement Of Fan Manufacturing Industry By Using Basic Seven Tools ...
 
Quality Improvement Of Fan Manufacturing Industry By Using Basic Seven Tools ...
Quality Improvement Of Fan Manufacturing Industry By Using Basic Seven Tools ...Quality Improvement Of Fan Manufacturing Industry By Using Basic Seven Tools ...
Quality Improvement Of Fan Manufacturing Industry By Using Basic Seven Tools ...
 
Production and Quality Tools: The Basic Seven Quality Tools
Production and Quality Tools: The Basic Seven Quality ToolsProduction and Quality Tools: The Basic Seven Quality Tools
Production and Quality Tools: The Basic Seven Quality Tools
 
Total Quality Management part 2
Total Quality Management part 2  Total Quality Management part 2
Total Quality Management part 2
 
Grade11_Q1-W7-PreparingInterpretingTechdraw.pdf
Grade11_Q1-W7-PreparingInterpretingTechdraw.pdfGrade11_Q1-W7-PreparingInterpretingTechdraw.pdf
Grade11_Q1-W7-PreparingInterpretingTechdraw.pdf
 
7qc_tools_173.ppt for 7 QC tools implementation of the quality
7qc_tools_173.ppt for 7 QC tools implementation of the quality7qc_tools_173.ppt for 7 QC tools implementation of the quality
7qc_tools_173.ppt for 7 QC tools implementation of the quality
 
The 7 QC Tools - English (19 Pages).ppt
The 7 QC Tools - English (19 Pages).pptThe 7 QC Tools - English (19 Pages).ppt
The 7 QC Tools - English (19 Pages).ppt
 
old seven quality control tools
old seven quality control toolsold seven quality control tools
old seven quality control tools
 

Recently uploaded

做(mqu毕业证书)麦考瑞大学毕业证硕士文凭证书学费发票原版一模一样
做(mqu毕业证书)麦考瑞大学毕业证硕士文凭证书学费发票原版一模一样做(mqu毕业证书)麦考瑞大学毕业证硕士文凭证书学费发票原版一模一样
做(mqu毕业证书)麦考瑞大学毕业证硕士文凭证书学费发票原版一模一样
axoqas
 
SOCRadar Germany 2024 Threat Landscape Report
SOCRadar Germany 2024 Threat Landscape ReportSOCRadar Germany 2024 Threat Landscape Report
SOCRadar Germany 2024 Threat Landscape Report
SOCRadar
 
一比一原版(TWU毕业证)西三一大学毕业证成绩单
一比一原版(TWU毕业证)西三一大学毕业证成绩单一比一原版(TWU毕业证)西三一大学毕业证成绩单
一比一原版(TWU毕业证)西三一大学毕业证成绩单
ocavb
 
Sample_Global Non-invasive Prenatal Testing (NIPT) Market, 2019-2030.pdf
Sample_Global Non-invasive Prenatal Testing (NIPT) Market, 2019-2030.pdfSample_Global Non-invasive Prenatal Testing (NIPT) Market, 2019-2030.pdf
Sample_Global Non-invasive Prenatal Testing (NIPT) Market, 2019-2030.pdf
Linda486226
 
一比一原版(UniSA毕业证书)南澳大学毕业证如何办理
一比一原版(UniSA毕业证书)南澳大学毕业证如何办理一比一原版(UniSA毕业证书)南澳大学毕业证如何办理
一比一原版(UniSA毕业证书)南澳大学毕业证如何办理
slg6lamcq
 
一比一原版(UofM毕业证)明尼苏达大学毕业证成绩单
一比一原版(UofM毕业证)明尼苏达大学毕业证成绩单一比一原版(UofM毕业证)明尼苏达大学毕业证成绩单
一比一原版(UofM毕业证)明尼苏达大学毕业证成绩单
ewymefz
 
一比一原版(ArtEZ毕业证)ArtEZ艺术学院毕业证成绩单
一比一原版(ArtEZ毕业证)ArtEZ艺术学院毕业证成绩单一比一原版(ArtEZ毕业证)ArtEZ艺术学院毕业证成绩单
一比一原版(ArtEZ毕业证)ArtEZ艺术学院毕业证成绩单
vcaxypu
 
社内勉強会資料_LLM Agents                              .
社内勉強会資料_LLM Agents                              .社内勉強会資料_LLM Agents                              .
社内勉強会資料_LLM Agents                              .
NABLAS株式会社
 
Ch03-Managing the Object-Oriented Information Systems Project a.pdf
Ch03-Managing the Object-Oriented Information Systems Project a.pdfCh03-Managing the Object-Oriented Information Systems Project a.pdf
Ch03-Managing the Object-Oriented Information Systems Project a.pdf
haila53
 
一比一原版(IIT毕业证)伊利诺伊理工大学毕业证成绩单
一比一原版(IIT毕业证)伊利诺伊理工大学毕业证成绩单一比一原版(IIT毕业证)伊利诺伊理工大学毕业证成绩单
一比一原版(IIT毕业证)伊利诺伊理工大学毕业证成绩单
ewymefz
 
Q1’2024 Update: MYCI’s Leap Year Rebound
Q1’2024 Update: MYCI’s Leap Year ReboundQ1’2024 Update: MYCI’s Leap Year Rebound
Q1’2024 Update: MYCI’s Leap Year Rebound
Oppotus
 
一比一原版(YU毕业证)约克大学毕业证成绩单
一比一原版(YU毕业证)约克大学毕业证成绩单一比一原版(YU毕业证)约克大学毕业证成绩单
一比一原版(YU毕业证)约克大学毕业证成绩单
enxupq
 
一比一原版(CBU毕业证)卡普顿大学毕业证如何办理
一比一原版(CBU毕业证)卡普顿大学毕业证如何办理一比一原版(CBU毕业证)卡普顿大学毕业证如何办理
一比一原版(CBU毕业证)卡普顿大学毕业证如何办理
ahzuo
 
Malana- Gimlet Market Analysis (Portfolio 2)
Malana- Gimlet Market Analysis (Portfolio 2)Malana- Gimlet Market Analysis (Portfolio 2)
Malana- Gimlet Market Analysis (Portfolio 2)
TravisMalana
 
Opendatabay - Open Data Marketplace.pptx
Opendatabay - Open Data Marketplace.pptxOpendatabay - Open Data Marketplace.pptx
Opendatabay - Open Data Marketplace.pptx
Opendatabay
 
【社内勉強会資料_Octo: An Open-Source Generalist Robot Policy】
【社内勉強会資料_Octo: An Open-Source Generalist Robot Policy】【社内勉強会資料_Octo: An Open-Source Generalist Robot Policy】
【社内勉強会資料_Octo: An Open-Source Generalist Robot Policy】
NABLAS株式会社
 
1.Seydhcuxhxyxhccuuxuxyxyxmisolids 2019.pptx
1.Seydhcuxhxyxhccuuxuxyxyxmisolids 2019.pptx1.Seydhcuxhxyxhccuuxuxyxyxmisolids 2019.pptx
1.Seydhcuxhxyxhccuuxuxyxyxmisolids 2019.pptx
Tiktokethiodaily
 
Empowering Data Analytics Ecosystem.pptx
Empowering Data Analytics Ecosystem.pptxEmpowering Data Analytics Ecosystem.pptx
Empowering Data Analytics Ecosystem.pptx
benishzehra469
 
Chatty Kathy - UNC Bootcamp Final Project Presentation - Final Version - 5.23...
Chatty Kathy - UNC Bootcamp Final Project Presentation - Final Version - 5.23...Chatty Kathy - UNC Bootcamp Final Project Presentation - Final Version - 5.23...
Chatty Kathy - UNC Bootcamp Final Project Presentation - Final Version - 5.23...
John Andrews
 
一比一原版(UIUC毕业证)伊利诺伊大学|厄巴纳-香槟分校毕业证如何办理
一比一原版(UIUC毕业证)伊利诺伊大学|厄巴纳-香槟分校毕业证如何办理一比一原版(UIUC毕业证)伊利诺伊大学|厄巴纳-香槟分校毕业证如何办理
一比一原版(UIUC毕业证)伊利诺伊大学|厄巴纳-香槟分校毕业证如何办理
ahzuo
 

Recently uploaded (20)

做(mqu毕业证书)麦考瑞大学毕业证硕士文凭证书学费发票原版一模一样
做(mqu毕业证书)麦考瑞大学毕业证硕士文凭证书学费发票原版一模一样做(mqu毕业证书)麦考瑞大学毕业证硕士文凭证书学费发票原版一模一样
做(mqu毕业证书)麦考瑞大学毕业证硕士文凭证书学费发票原版一模一样
 
SOCRadar Germany 2024 Threat Landscape Report
SOCRadar Germany 2024 Threat Landscape ReportSOCRadar Germany 2024 Threat Landscape Report
SOCRadar Germany 2024 Threat Landscape Report
 
一比一原版(TWU毕业证)西三一大学毕业证成绩单
一比一原版(TWU毕业证)西三一大学毕业证成绩单一比一原版(TWU毕业证)西三一大学毕业证成绩单
一比一原版(TWU毕业证)西三一大学毕业证成绩单
 
Sample_Global Non-invasive Prenatal Testing (NIPT) Market, 2019-2030.pdf
Sample_Global Non-invasive Prenatal Testing (NIPT) Market, 2019-2030.pdfSample_Global Non-invasive Prenatal Testing (NIPT) Market, 2019-2030.pdf
Sample_Global Non-invasive Prenatal Testing (NIPT) Market, 2019-2030.pdf
 
一比一原版(UniSA毕业证书)南澳大学毕业证如何办理
一比一原版(UniSA毕业证书)南澳大学毕业证如何办理一比一原版(UniSA毕业证书)南澳大学毕业证如何办理
一比一原版(UniSA毕业证书)南澳大学毕业证如何办理
 
一比一原版(UofM毕业证)明尼苏达大学毕业证成绩单
一比一原版(UofM毕业证)明尼苏达大学毕业证成绩单一比一原版(UofM毕业证)明尼苏达大学毕业证成绩单
一比一原版(UofM毕业证)明尼苏达大学毕业证成绩单
 
一比一原版(ArtEZ毕业证)ArtEZ艺术学院毕业证成绩单
一比一原版(ArtEZ毕业证)ArtEZ艺术学院毕业证成绩单一比一原版(ArtEZ毕业证)ArtEZ艺术学院毕业证成绩单
一比一原版(ArtEZ毕业证)ArtEZ艺术学院毕业证成绩单
 
社内勉強会資料_LLM Agents                              .
社内勉強会資料_LLM Agents                              .社内勉強会資料_LLM Agents                              .
社内勉強会資料_LLM Agents                              .
 
Ch03-Managing the Object-Oriented Information Systems Project a.pdf
Ch03-Managing the Object-Oriented Information Systems Project a.pdfCh03-Managing the Object-Oriented Information Systems Project a.pdf
Ch03-Managing the Object-Oriented Information Systems Project a.pdf
 
一比一原版(IIT毕业证)伊利诺伊理工大学毕业证成绩单
一比一原版(IIT毕业证)伊利诺伊理工大学毕业证成绩单一比一原版(IIT毕业证)伊利诺伊理工大学毕业证成绩单
一比一原版(IIT毕业证)伊利诺伊理工大学毕业证成绩单
 
Q1’2024 Update: MYCI’s Leap Year Rebound
Q1’2024 Update: MYCI’s Leap Year ReboundQ1’2024 Update: MYCI’s Leap Year Rebound
Q1’2024 Update: MYCI’s Leap Year Rebound
 
一比一原版(YU毕业证)约克大学毕业证成绩单
一比一原版(YU毕业证)约克大学毕业证成绩单一比一原版(YU毕业证)约克大学毕业证成绩单
一比一原版(YU毕业证)约克大学毕业证成绩单
 
一比一原版(CBU毕业证)卡普顿大学毕业证如何办理
一比一原版(CBU毕业证)卡普顿大学毕业证如何办理一比一原版(CBU毕业证)卡普顿大学毕业证如何办理
一比一原版(CBU毕业证)卡普顿大学毕业证如何办理
 
Malana- Gimlet Market Analysis (Portfolio 2)
Malana- Gimlet Market Analysis (Portfolio 2)Malana- Gimlet Market Analysis (Portfolio 2)
Malana- Gimlet Market Analysis (Portfolio 2)
 
Opendatabay - Open Data Marketplace.pptx
Opendatabay - Open Data Marketplace.pptxOpendatabay - Open Data Marketplace.pptx
Opendatabay - Open Data Marketplace.pptx
 
【社内勉強会資料_Octo: An Open-Source Generalist Robot Policy】
【社内勉強会資料_Octo: An Open-Source Generalist Robot Policy】【社内勉強会資料_Octo: An Open-Source Generalist Robot Policy】
【社内勉強会資料_Octo: An Open-Source Generalist Robot Policy】
 
1.Seydhcuxhxyxhccuuxuxyxyxmisolids 2019.pptx
1.Seydhcuxhxyxhccuuxuxyxyxmisolids 2019.pptx1.Seydhcuxhxyxhccuuxuxyxyxmisolids 2019.pptx
1.Seydhcuxhxyxhccuuxuxyxyxmisolids 2019.pptx
 
Empowering Data Analytics Ecosystem.pptx
Empowering Data Analytics Ecosystem.pptxEmpowering Data Analytics Ecosystem.pptx
Empowering Data Analytics Ecosystem.pptx
 
Chatty Kathy - UNC Bootcamp Final Project Presentation - Final Version - 5.23...
Chatty Kathy - UNC Bootcamp Final Project Presentation - Final Version - 5.23...Chatty Kathy - UNC Bootcamp Final Project Presentation - Final Version - 5.23...
Chatty Kathy - UNC Bootcamp Final Project Presentation - Final Version - 5.23...
 
一比一原版(UIUC毕业证)伊利诺伊大学|厄巴纳-香槟分校毕业证如何办理
一比一原版(UIUC毕业证)伊利诺伊大学|厄巴纳-香槟分校毕业证如何办理一比一原版(UIUC毕业证)伊利诺伊大学|厄巴纳-香槟分校毕业证如何办理
一比一原版(UIUC毕业证)伊利诺伊大学|厄巴纳-香槟分校毕业证如何办理
 

7 QC(Quality Control) Tools

  • 1. Slide # 1 Slide # 1 Quality Control (QC) Tools Brief presentation Location: DIVGI TORQTRANSFER SYSTEMS PVT LTD, SIRSI
  • 2. Slide # 2 Slide # 2 As much as 95% of quality related problems in the factory can be solved with seven fundamental quantitative tools.”(Kaoru Ishikawa) Why Quality Control?
  • 3. Slide # 3 Slide # 3 Quality Control, or QC for short, is a process by which entities review the quality of all factors involved in production. We need quality tools for  problem solving,  continual improvement and  process measurement. IATF:16949 defines quality control as “A part of quality management focused on fulfilling customer-specific quality requirements”. Why Quality Control?
  • 4. Slide # 4 Slide # 4 This approach places an emphasis on three aspects;  Elements such as control, job management, defined and well managed processes, performance and integrity criteria, and identification of records.  Competence, such as knowledge, skill, experience, and qualifications.  Soft elements, such as personnel, integrity, confidence, organizational culture, motivation, team spirit, and quality relationship. Why Quality Control?
  • 5. Slide # 5 Slide # 5 7 Quality Control (QC) Tools:  Check sheet  Flow Chart  Histogram  Cause and Effect Diagram(Fish-Bone)  Pareto Chart  Scatter Diagram  Control Chart Why Quality Control?
  • 6. Slide # 6 Slide # 6 CHECK SHEET  Made popular by Kaoru Ishikawa  Check sheet is a simplest way to assess common problems.  The Check Sheet is a document that is used for collecting data in real time and the location where the data is generated. The document is typically a blank form that is designed for the quick, easy, and efficient recording of the desired information.  Data can be quantitative(numeric) or qualitative(non-numeric). 1. Check Sheet
  • 7. Slide # 7 Slide # 7 When to use it?  collecting data from a production process.  To distinguish between fact and opinion.  When data can be observed and collected repeatedly by same person and at location.  When collecting data on the frequency or problems, defects, defect location and causes etc. 1. Check Sheet
  • 8. Slide # 8 Slide # 8 Check Sheet Procedure:  There is a standard format for an ISO/IATF certified company.  Created all spaces on the form.  Date, Shift, Component name, part number, batch, process number and name, Entities to record and serial number. These are the standard sections in a check sheet. 1. Check Sheet
  • 9. Slide # 9 Slide # 9 Example of Check sheet: 1. Check Sheet
  • 10. Slide # 10 Slide # 10 Benefits of Check Sheet:  It is a simplest and effective way to display data.  It is a good first step in understanding the nature of problem. 1. Check Sheet
  • 11. Slide # 11 Slide # 11 Flow Chart:  Draw a flowchart for whatever you do, until you do, you do not know, what you are doing, you just have a job. ( Dr. Edward Deming)  diagram commonly used in Process Engineering to indicate the general flow of plant processes and equipment.  displays the relationship between major equipment of the plant facility and does not show minor details and designation  Process Flow Diagram (PFD), Flow Sheet are other names for Flow Chart 2. Flow Chart
  • 12. Slide # 12 Slide # 12 When to use a Flow Chart ? :  To study process for improvement  To develop understanding of how a process is done  To communicate to other how is process is done  To document a process  When better communication needed between people involved with the same process.  When planning a project 2. Flow Chart
  • 13. Slide # 13 Slide # 13 Flow Chart basic procedure :  Discuss and decide on the boundaries of your process : where and when does the process start? Where and when does it end? Discuss and decide on the level of detail to be included in the diagram  Identify the activities that take place. Write each on the note.  Arrange the activities in proper sequences.  When all activities are included and everyone agrees on correctness of sequence, draw arrow to show the flow of the process.  Review the flowchart with others involved in the process(workers, supervisors, suppliers, customers) 2. Flow Chart
  • 14. Slide # 14 Slide # 14 Example of Flow Chart: Better description of process Hitting snooze button 3 times Makes the end process delay by 5 minutes each time 2. Flow Chart
  • 15. Slide # 15 Slide # 15 Benefits of Flow Chart:  Identify process that need improvement  Depicts customer-supplier relationship  Determine major and minor inputs in process  Promotes process understanding  Create visual map of the process. 2. Flow Chart
  • 16. Slide # 16 Slide # 16 Histogram:  Graphical representation of the distribution of numerical data  Pictorial nature of histogram enables us to see patterns that are difficult to see in check sheet/ table of numbers  It shows the form of distribution by establishing the frequency of data within range.  Tells about patterns of variation 3. Histogram
  • 17. Slide # 17 Slide # 17 When to use a Histogram:  When the data are large and numerical.  To compare measurement to specification.  To communicate information to the team.  To look where the central tendency of a process is.  When analysing whether a process can meet customer’s requirement.  To determine whether the outputs of two or more process are different. 3. Histogram
  • 18. Slide # 18 Slide # 18 Histogram Procedure: (1/2)  Arrange the collected data column wise in table form.  Find and mark maximum and minimum value in each group. And in whole set  Calculate the Range. (Range = max – min)  Determine the numbers of class intervals for frequency e.g. <500 = 5 to 7, 500 to 1000 = 6 to 10, >1000 = 7 to 12  Determine intervals(bucket) and boundaries. (Interval= range /class interval)  Determine the frequencies of each class interval with tallies / Excel 3. Histogram
  • 19. Slide # 19 Slide # 19 Histogram Procedure: (2/2)  Mark and label frequency at vertical scale  Mark and label measurement value at the horizontal scale  Draw the columns according to frequencies  Label the histogram 3. Histogram
  • 20. Slide # 20 Slide # 20 Histogram example: 3. Histogram
  • 21. Slide # 21 Slide # 21 Histogram example: 3. Histogram
  • 22. Slide # 22 Slide # 22 Histogram example: 3. Histogram
  • 23. Slide # 23 Slide # 23 Histogram Analysis: (1/2) 1) Normal: common pattern (bell-shaped) known as normal distribution(ND) 2) Skewed: asymmetrical because a limit prevents outcome on one side. 3) Double-picked or bimodal: looks like back of two-humped camel 4) Plateau: called multimodal distribution. Several processes with ND combined 5) Comb: the bars are alternatively tall and short. 6) Truncated or heart-cut: looks like ND with tails cut off 3. Histogram
  • 24. Slide # 24 Slide # 24 Histogram Analysis: (2/2) 7) Dog food: its missing something – results near the average. 8) Edge peak: Normal distribution except that it has large peak at one tail. 3. Histogram
  • 25. Slide # 25 Slide # 25 Benefits of Histogram:  Simple to use, visualise, and interpret.  Process monitoring and centering.  To know whether process produces within specification.  To know whether process is stable and predictable.  Application to all variable data. 3. Histogram
  • 26. Slide # 26 Slide # 26 Cause and Effect Diagram:  Also known as Ishikawa Diagram, Fishbone diagram, herringbone diagram.  Shows relationship between a problem and its possible causes  Explore potential causes and help identify root causes.  Where and why the process isn’t working  Used for product design, quality defect prevention  Each cause for imperfection is a source of variation. 4. Cause and Effect Diagram
  • 27. Slide # 27 Slide # 27 When to use Cause and Effect Diagram: 1) When identifying possible causes for a problem. 2) To analyse existing problems. 3) For problem-solving. 4) To sort out interactions among factors for a cause. 4. Cause and Effect Diagram
  • 28. Slide # 28 Slide # 28 Why to use Cause and Effect Diagram? 1) Group participation and knowledge sharing. 2) To determine root cause of a problem. 3) Increases knowledge of a process and its factors. 4) Identifies area for further data collection 5) For process improvement. 4. Cause and Effect Diagram
  • 29. Slide # 29 Slide # 29 Cause and Effect Diagram procedure: 1) Identify and define a problem statement (effect) 2) Identify major categories of causes of problem. General ones are 6Ms 1. Man(personnel) 4. Material 2. Machine 5. Measurement 3. Method 6. Mother Nature (Environment) 3) Write categories as branches for the effect. 4) Brainstorm all the possible causes of problem and write details 5) Write sub-branches, continue to ask “why?” to find deeper level of cause 4. Cause and Effect Diagram
  • 30. Slide # 30 Slide # 30 Cause and Effect Diagram Example: 4. Cause and Effect Diagram
  • 31. Slide # 31 Slide # 31 Benefits of Cause and Effect Diagram: 1) Making a diagram is educational in itself. 2) Indicates possible causes of variation 3) Focus is on ”causes” rather than “symptoms”. 4) Improve team performance and effectiveness. 5) Improve process knowledge. 6) Set as a standard for future similar effects. 4. Cause and Effect Diagram
  • 32. Slide # 32 Slide # 32 Pareto Chart:  Named after Vilfredo Pareto, is a type of chart contains bars & line graph.  States that, for many event, roughly 80% of the trouble comes from 20% of the problems  Individual values are in descending order by bars, cumulative total is represented by the line.  Values of statistical variable are placed in order of relative frequency, reveals which factors have the greatest impact and where attention is likely to yield the greatest benefit. 5. Pareto Chart/Analysis
  • 33. Slide # 33 Slide # 33 When to use Pareto Chart ? : 1) When analysing data about frequency of problems or causes in a process. 2) When there are many problems or causes and you want to focus on the most significant. 3) When analysing broad causes by looking at their specific components. 4) When communicating with others about your data. 5) Allow better use of limited resources. 5. Pareto Chart/Analysis
  • 34. Slide # 34 Slide # 34 Pareto Chart procedure : (1/2) 1) Decide what categories to use to group items. 2) Decide what measurement is appropriate, common measurement are frequency, quantity, cost and time. 3) Decide the the period of time this chart will cover; one work cycle, full day, month ? 4) Collect the data, recording the category each time 5) Subtotal the measurement for each category and plot bars in descending order. 6) Calculate the percentage and plot cumulative total % along with it. 5. Pareto Chart/Analysis
  • 35. Slide # 35 Slide # 35 Pareto Chart procedure : (2/2) 7) Focus on the area which falls under 80% of cumulative percentage 8) Note: There are many tools which we can get pareto results by just inputting the data. 5. Pareto Chart/Analysis
  • 36. Slide # 36 Slide # 36 Pareto Chart Example : (2/2) 5. Pareto Chart/Analysis
  • 37. Slide # 37 Slide # 37 Benefits of Pareto Chart Example :  Identifies “major” problems  Improves team performance and effectiveness  Before and after tracking of a problem in chart  Helps for continual improvement  Cost reduction and customer satisfaction 5. Pareto Chart/Analysis
  • 38. Slide # 38 Slide # 38 Benefits of Pareto Chart Example :  Identifies “major” problems  Improves team performance and effectiveness  Before and after tracking of a problem in chart  Helps for continual improvement  Cost reduction and customer satisfaction 5. Pareto Chart/Analysis
  • 39. Slide # 39 Slide # 39 Scatter Diagram:  Is a visual and statistical testing tool. Called as Scatter Plot or X-Y graph  Used to investigate the possible relationship between two variables that relate to the same event. To arrive at quantitative conclusion.  Makes it easy to spot trends and correlations.  If variables are correlated, the points fall among a line or curve.  The better the correlation, tighter the points near the line. 6. Scatter Diagram
  • 40. Slide # 40 Slide # 40 When to use Scatter Diagram ? :  When we have paired numerical data.  When dependent variable may have multiple values for each value of independent variable.  In problem-solving to establish a root cause.  To confirm a hypothesis  When testing for autocorrelation before constructing a control chart 6. Scatter Diagram
  • 41. Slide # 41 Slide # 41 Scatter Diagram procedure : 1) Collect pairs of data; independent and dependent variable. 2) Independent variable on the horizontal axis and dependent on vertical axis 3) For each pair of data, put a dot where X-axis intersects Y-axis’ value. 4) Look at the pattern of points to see if a relationship is obvious. 5) If the data clearly form a line or curve, then the variables are correlated. Then, can be proceeded to correlation analysis 6. Scatter Diagram
  • 42. Slide # 42 Slide # 42 Scatter Diagram Analysis : Patterns of correlation 6. Scatter Diagram
  • 43. Slide # 43 Slide # 43 Scatter Diagram Analysis : The local cold drink shop track of how much cold drink bottle they sell versus the noon temperature of that day. Data for the last 10 days. 6. Scatter Diagram We can also draw a “line of best fit” on scatter diagram
  • 44. Slide # 44 Slide # 44 Control Chart:  Is a special type graph used to detect the special causes in the process over time.  Used for monitoring, improving quality and measure consistency of a process or machine.  Has a central line for average, upper line for Upper Control Limit(UCL), lower line for lower control limit(LCL).  These lines are determined from historical data of process or machine.  By comparing current data to these line, you can draw result easily about whether the variation is in control or out of control. 7. Control Chart
  • 45. Slide # 45 Slide # 45 When to use Control Chart ? : 1) When identifying variation at its source. 2) When predicting the expected range of outcomes from a process. 3) When visual displaying for process output. 4) When determining whether a process is stable. 5) To monitor, control and improve. 7. Control Chart
  • 46. Slide # 46 Slide # 46 Types of Control Chart : 7. Control Chart
  • 47. Slide # 47 Slide # 47 Types of Control Chart : 7. Control Chart
  • 48. Slide # 48 Slide # 48 Types of Control Chart : 1. For variables : for the characteristics that can be measured (X-R Chart) 2. For attributes : for the characteristics that can be judges as pass or fail, defective or ok, go are no-go etc. · R chart – in this chart, the sample range are plotted in order to control the variability of a variable. · S chart – in this chart, the sample standard deviations are plotted in order to control the variability of variable. · C chart – in this chart, plot the number of defectives (per day, per batch or per machine) · U chart – in this chart, plot the number of defectives divided by the numbers of units inspected (numbers of batches) · Np chart – in this chart, plot the number of the defectives as in the C chart. However, the control limit in this chart are not based on the distribution rare events, but rather on the binomial distribution. · P chart – in this chart, plot the percent of defectives as in the U chart, However, the control limit in this chart are not based on the distribution rare events, but rather on the binomial distribution. 7. Control Chart
  • 49. Slide # 49 Slide # 49 Control Chart procedure: 1) Choose the correct control chart for your data. 2) Determine the appropriate time period for collecting and plotting data. 3) Collect data, draw chart and analyse 4) Look for “in-control” or “out-of-control” condition 5) For “out-of-control” signal, mark it on the chart and investigate the cause. 6) Document how you investigated, what you learned, the cause and it was corrected. 7. Control Chart
  • 50. Slide # 50 Slide # 50 Control Chart example: 7. Control Chart
  • 51. Slide # 51 Slide # 51 Benefits of Control Chart:  Easy and simple to study and maintain.  It is an effective tool to control the process statistically  It provides information about capability.  Tool which help to reduce variation.  Helps to detect changes in the process over a period of time and take corrective action 7. Control Chart
  • 52. Slide # 52 Slide # 52 PRODUCT LEADERSHIP LIKE NO OTHER Thank You