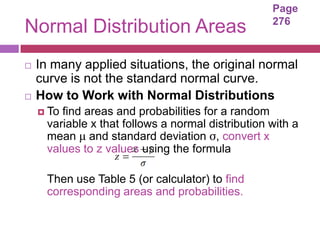
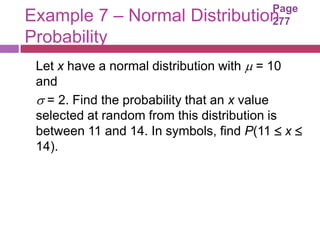
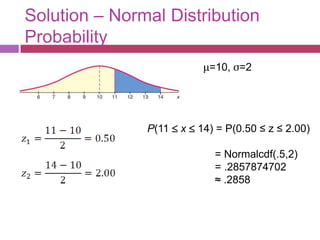
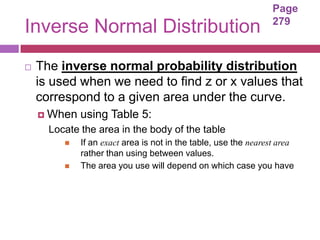
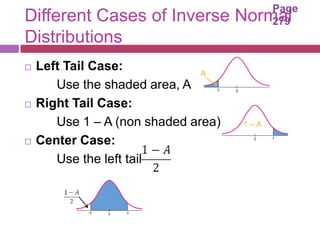
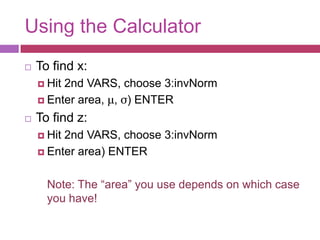
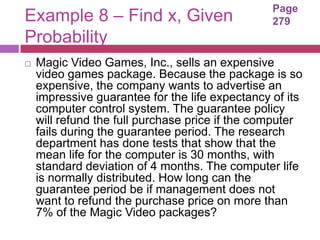
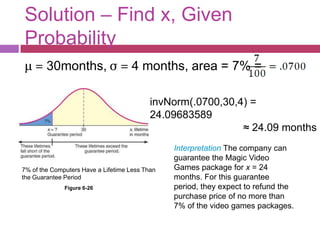
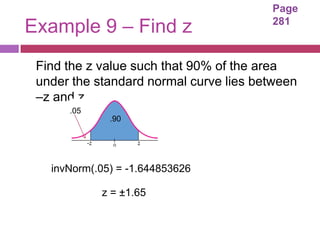
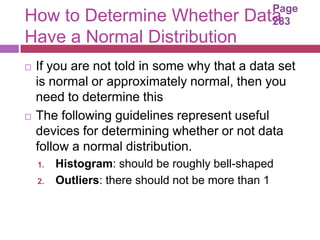
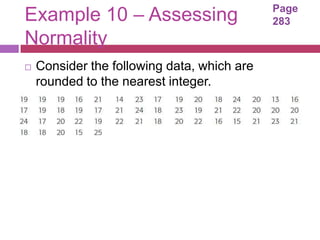
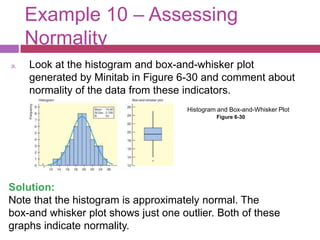
6.3 AREA UNDER ANY
NORMAL CURVE
Chapter 6:
Normal Curves and Sampling Distributions
Page
                                                    276
Normal Distribution Areas
   In many applied situations, the original normal
    curve is not the standard normal curve.
   How to Work with Normal Distributions
     To find areas and probabilities for a random
      variable x that follows a normal distribution with a
      mean μ and standard deviation σ, convert x
      values to z values using the formula

      Then use Table 5 (or calculator) to find
      corresponding areas and probabilities.
Page
Example 7 – Normal Distribution          277
Probability
 Let x have a normal distribution with  = 10
 and
  = 2. Find the probability that an x value
 selected at random from this distribution is
 between 11 and 14. In symbols, find P(11  x 
 14).
Solution – Normal Distribution
Probability
                           μ=10, σ=2


               P(11  x  14) = P(0.50 ≤ z ≤ 2.00)

                             = Normalcdf(.5,2)
                             = .2857874702
                             ≈ .2858
Using the Calculator
(without converting to z scores)
Normalcdf (lower bound, upper bound, μ , σ)

     -E99 and E99 are used for left tail and right tail
 bounds
Page
                                                                 279
Inverse Normal Distribution
   The inverse normal probability distribution
    is used when we need to find z or x values that
    correspond to a given area under the curve.
     When   using Table 5:
      Locate the area in the body of the table
            If an exact area is not in the table, use the nearest area
             rather than using between values.
            The area you use will depend on which case you have
Page
Different Cases of Inverse Normal          279
Distributions
   Left Tail Case:            A
       Use the shaded area, A
   Right Tail Case:
       Use 1 – A (non shaded area)   1–A

   Center Case:
       Use the left tail
Using the Calculator
   To find x:
     Hit2nd VARS, choose 3:invNorm
     Enter area, μ, σ) ENTER

   To find z:
     Hit2nd VARS, choose 3:invNorm
     Enter area) ENTER


      Note: The “area” you use depends on which case
      you have!
Page
Example 8 – Find x, Given                        279
Probability
   Magic Video Games, Inc., sells an expensive
    video games package. Because the package is so
    expensive, the company wants to advertise an
    impressive guarantee for the life expectancy of its
    computer control system. The guarantee policy
    will refund the full purchase price if the computer
    fails during the guarantee period. The research
    department has done tests that show that the
    mean life for the computer is 30 months, with
    standard deviation of 4 months. The computer life
    is normally distributed. How long can the
    guarantee period be if management does not
    want to refund the purchase price on more than
    7% of the Magic Video packages?
Solution – Find x, Given
Probability
μ = 30months, σ = 4 months, area = 7% =

                                           invNorm(.0700,30,4) =
                                           24.09683589
                                                             ≈ 24.09 months
                                                Interpretation The company can
                                                guarantee the Magic Video
7% of the Computers Have a Lifetime Less Than   Games package for x = 24
the Guarantee Period                            months. For this guarantee
              Figure 6-26                       period, they expect to refund the
                                                purchase price of no more than
                                                7% of the video games packages.
Page
Example 9 – Find z                      281


 Find the z value such that 90% of the area
 under the standard normal curve lies between
 –z and z.
      .05
              .90


   invNorm(.05) = -1.644853626

            z = ±1.65
Page
How to Determine Whether Data                    283
Have a Normal Distribution
   If you are not told in some why that a data set
    is normal or approximately normal, then you
    need to determine this
   The following guidelines represent useful
    devices for determining whether or not data
    follow a normal distribution.
    1.   Histogram: should be roughly bell-shaped
    2.   Outliers: there should not be more than 1
Example 10 – Assessing                       Page
                                             283
Normality
   Consider the following data, which are
    rounded to the nearest integer.
Example 10 – Assessing
     Normality
a.   Look at the histogram and box-and-whisker plot
     generated by Minitab in Figure 6-30 and comment about
     normality of the data from these indicators.
                                      Histogram and Box-and-Whisker Plot
                                               Figure 6-30


Solution:
Note that the histogram is approximately normal. The
box-and whisker plot shows just one outlier. Both of these
graphs indicate normality.
Assignment
   Page 286
   #1 – 3, 4a, 5, 11, 13,15, 19, 23, 27, 29

6.3 area under norm curve

  • 1.
    6.3 AREA UNDERANY NORMAL CURVE Chapter 6: Normal Curves and Sampling Distributions
  • 2.
    Page 276 Normal Distribution Areas  In many applied situations, the original normal curve is not the standard normal curve.  How to Work with Normal Distributions  To find areas and probabilities for a random variable x that follows a normal distribution with a mean μ and standard deviation σ, convert x values to z values using the formula Then use Table 5 (or calculator) to find corresponding areas and probabilities.
  • 3.
    Page Example 7 –Normal Distribution 277 Probability Let x have a normal distribution with  = 10 and  = 2. Find the probability that an x value selected at random from this distribution is between 11 and 14. In symbols, find P(11  x  14).
  • 4.
    Solution – NormalDistribution Probability μ=10, σ=2 P(11  x  14) = P(0.50 ≤ z ≤ 2.00) = Normalcdf(.5,2) = .2857874702 ≈ .2858
  • 5.
    Using the Calculator (withoutconverting to z scores) Normalcdf (lower bound, upper bound, μ , σ) -E99 and E99 are used for left tail and right tail bounds
  • 6.
    Page 279 Inverse Normal Distribution  The inverse normal probability distribution is used when we need to find z or x values that correspond to a given area under the curve.  When using Table 5: Locate the area in the body of the table  If an exact area is not in the table, use the nearest area rather than using between values.  The area you use will depend on which case you have
  • 7.
    Page Different Cases ofInverse Normal 279 Distributions  Left Tail Case: A Use the shaded area, A  Right Tail Case: Use 1 – A (non shaded area) 1–A  Center Case: Use the left tail
  • 8.
    Using the Calculator  To find x:  Hit2nd VARS, choose 3:invNorm  Enter area, μ, σ) ENTER  To find z:  Hit2nd VARS, choose 3:invNorm  Enter area) ENTER Note: The “area” you use depends on which case you have!
  • 9.
    Page Example 8 –Find x, Given 279 Probability  Magic Video Games, Inc., sells an expensive video games package. Because the package is so expensive, the company wants to advertise an impressive guarantee for the life expectancy of its computer control system. The guarantee policy will refund the full purchase price if the computer fails during the guarantee period. The research department has done tests that show that the mean life for the computer is 30 months, with standard deviation of 4 months. The computer life is normally distributed. How long can the guarantee period be if management does not want to refund the purchase price on more than 7% of the Magic Video packages?
  • 10.
    Solution – Findx, Given Probability μ = 30months, σ = 4 months, area = 7% = invNorm(.0700,30,4) = 24.09683589 ≈ 24.09 months Interpretation The company can guarantee the Magic Video 7% of the Computers Have a Lifetime Less Than Games package for x = 24 the Guarantee Period months. For this guarantee Figure 6-26 period, they expect to refund the purchase price of no more than 7% of the video games packages.
  • 11.
    Page Example 9 –Find z 281 Find the z value such that 90% of the area under the standard normal curve lies between –z and z. .05 .90 invNorm(.05) = -1.644853626 z = ±1.65
  • 12.
    Page How to DetermineWhether Data 283 Have a Normal Distribution  If you are not told in some why that a data set is normal or approximately normal, then you need to determine this  The following guidelines represent useful devices for determining whether or not data follow a normal distribution. 1. Histogram: should be roughly bell-shaped 2. Outliers: there should not be more than 1
  • 13.
    Example 10 –Assessing Page 283 Normality  Consider the following data, which are rounded to the nearest integer.
  • 14.
    Example 10 –Assessing Normality a. Look at the histogram and box-and-whisker plot generated by Minitab in Figure 6-30 and comment about normality of the data from these indicators. Histogram and Box-and-Whisker Plot Figure 6-30 Solution: Note that the histogram is approximately normal. The box-and whisker plot shows just one outlier. Both of these graphs indicate normality.
  • 15.
    Assignment  Page 286  #1 – 3, 4a, 5, 11, 13,15, 19, 23, 27, 29