The document provides instructions for students on various topics:
- Spreading out seats and taking notes individually for 5 minutes with no discussions
- An upcoming graded quiz on statistics lessons
- Khan Academy skills for review before the quiz
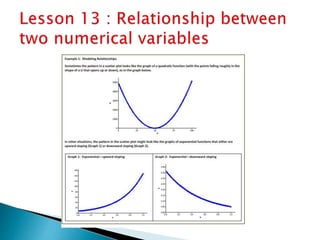
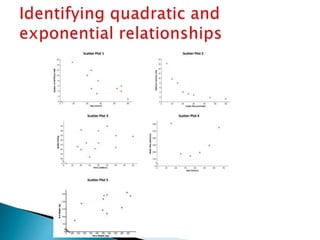
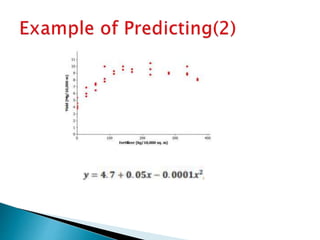
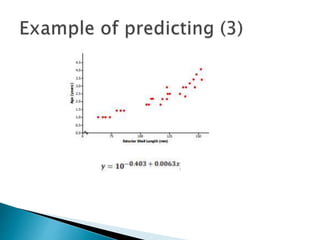
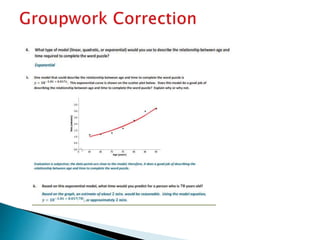
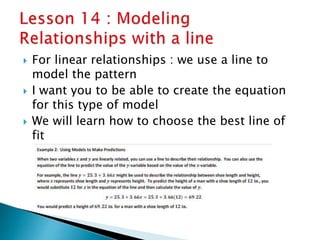
- Modeling relationships between data using functions and scatterplots
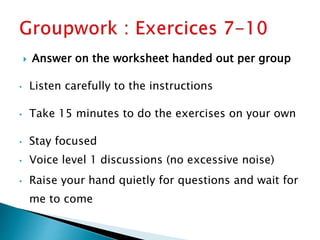
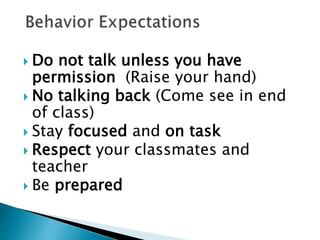
- Working in groups on a worksheet, staying focused, and asking questions by raising hands
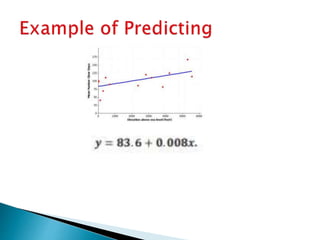
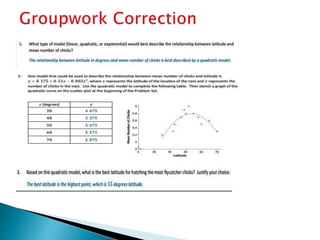
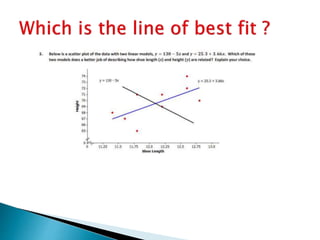
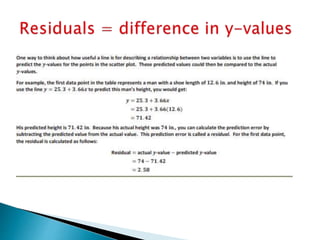
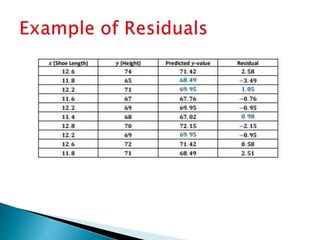
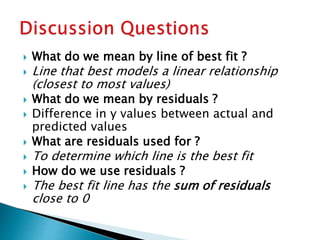
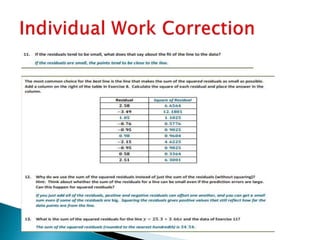
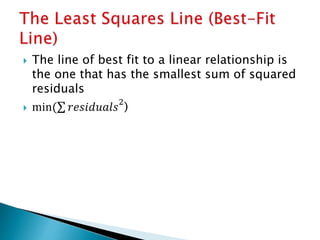
- Calculating the line of best fit by minimizing residuals
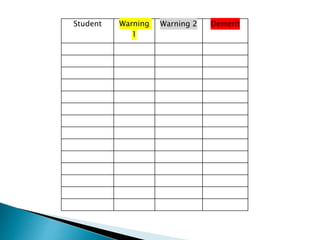
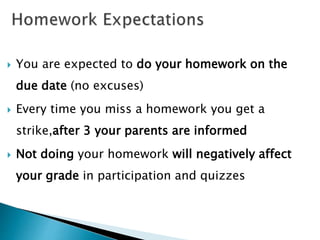
- Expectations around homework, quizzes, making up missed work, and discussing grades.


![28thseptember7thgrade [autosaved]](https://cdn.slidesharecdn.com/ss_thumbnails/28thseptember7thgradeautosaved-200811111133-thumbnail.jpg?width=640&height=640&fit=bounds)


