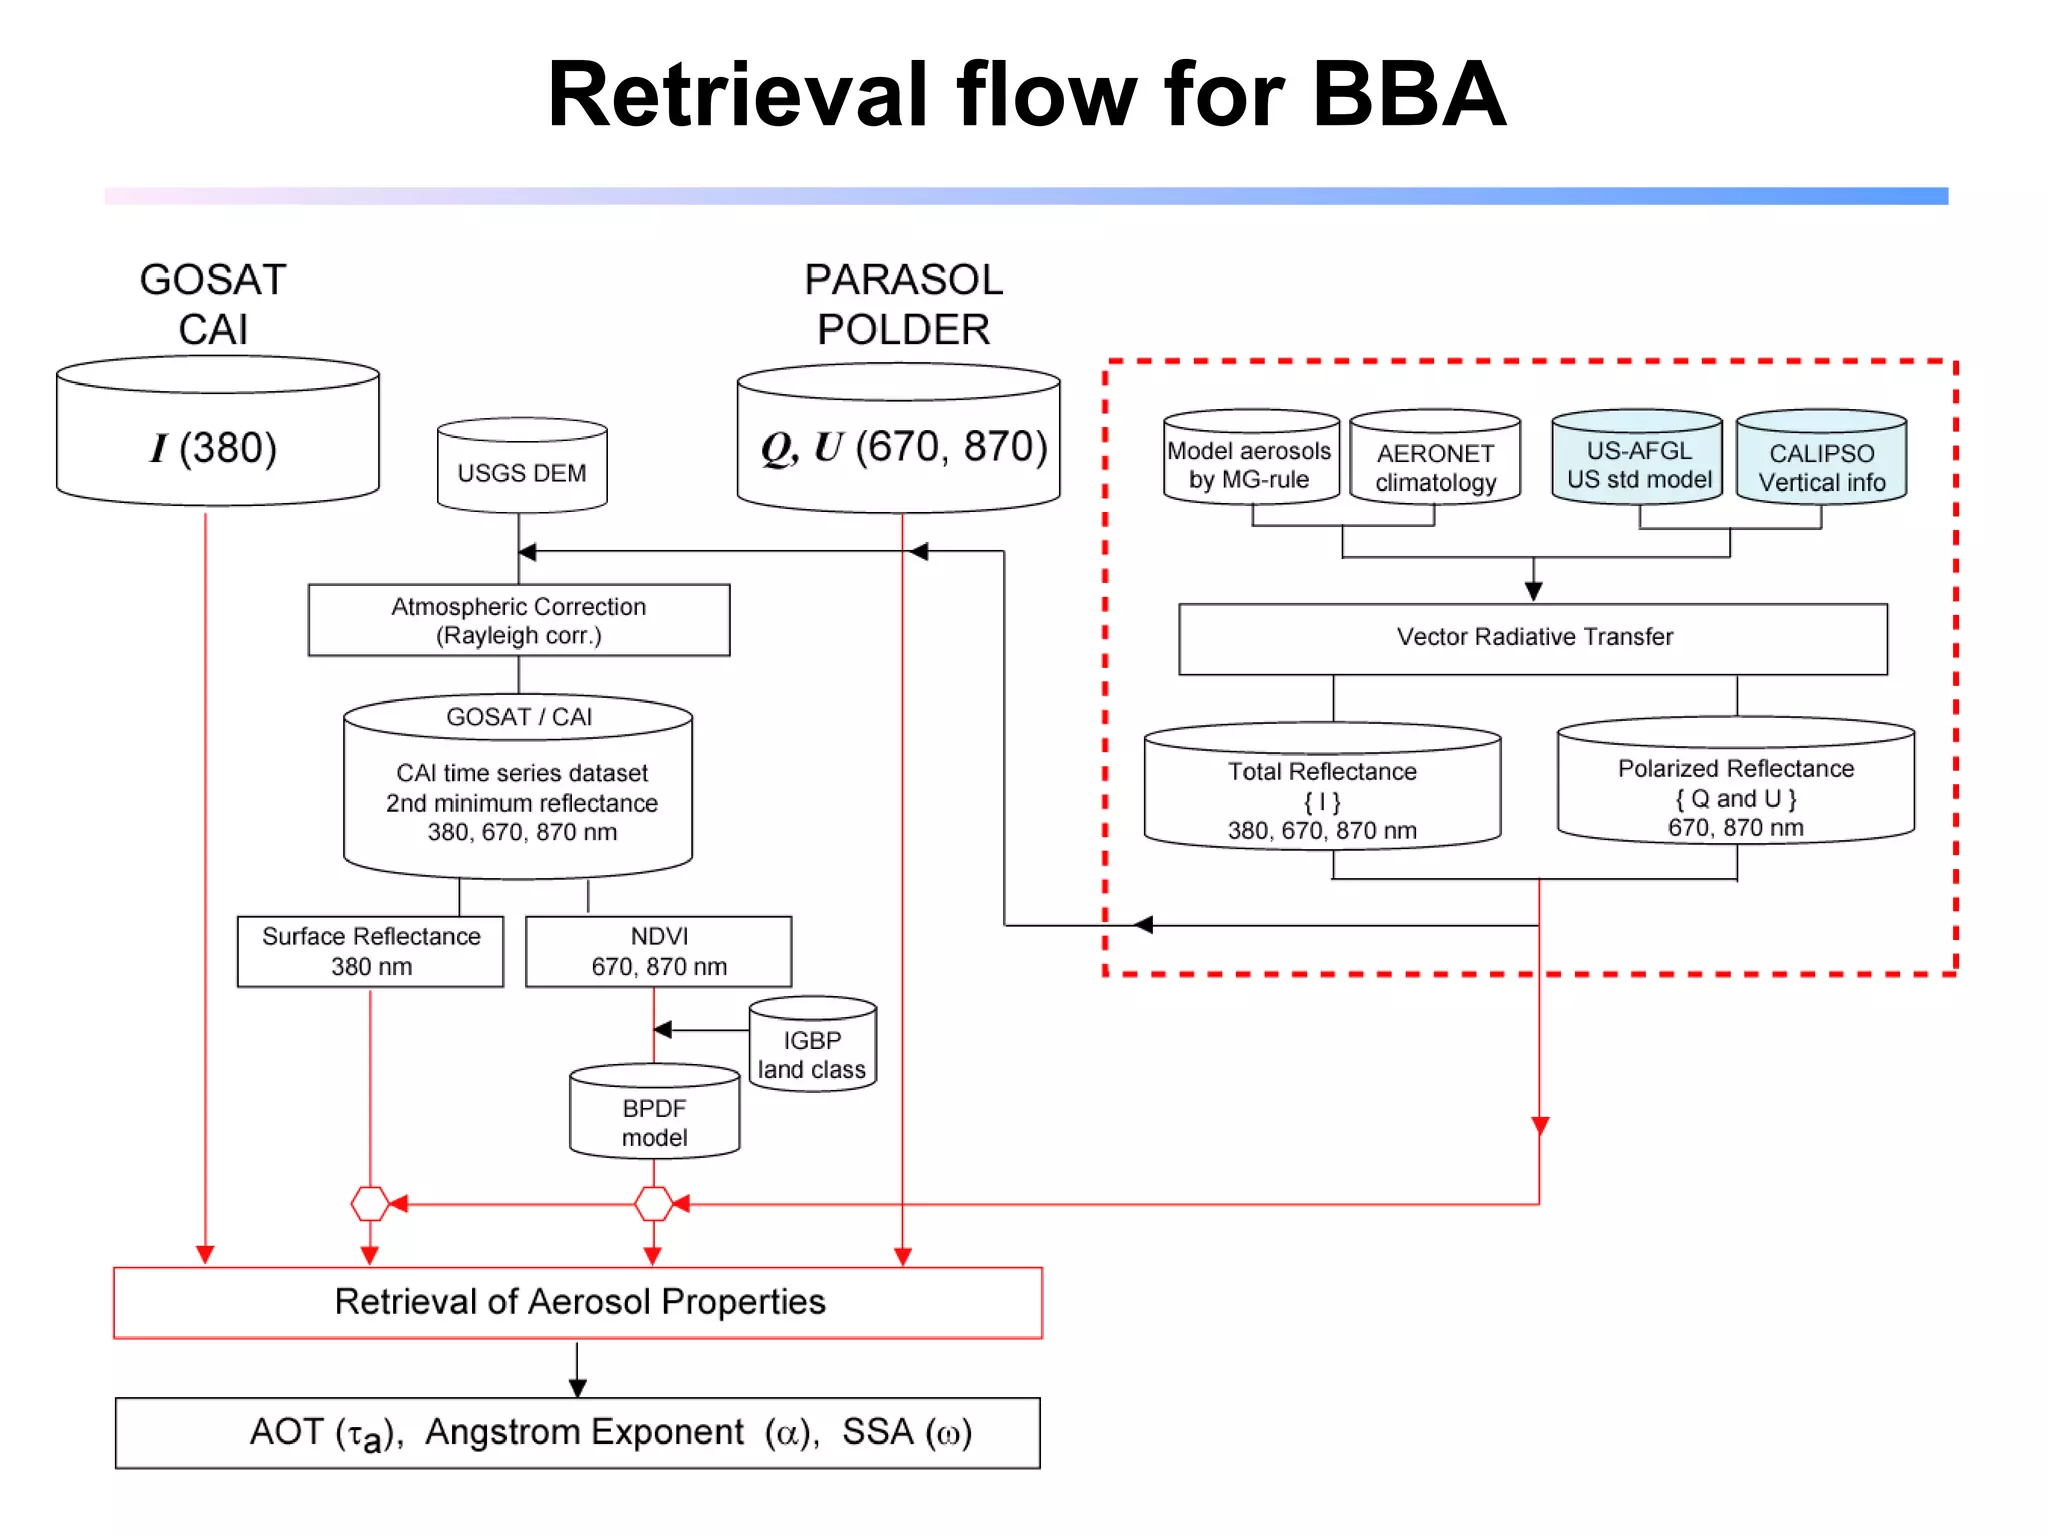
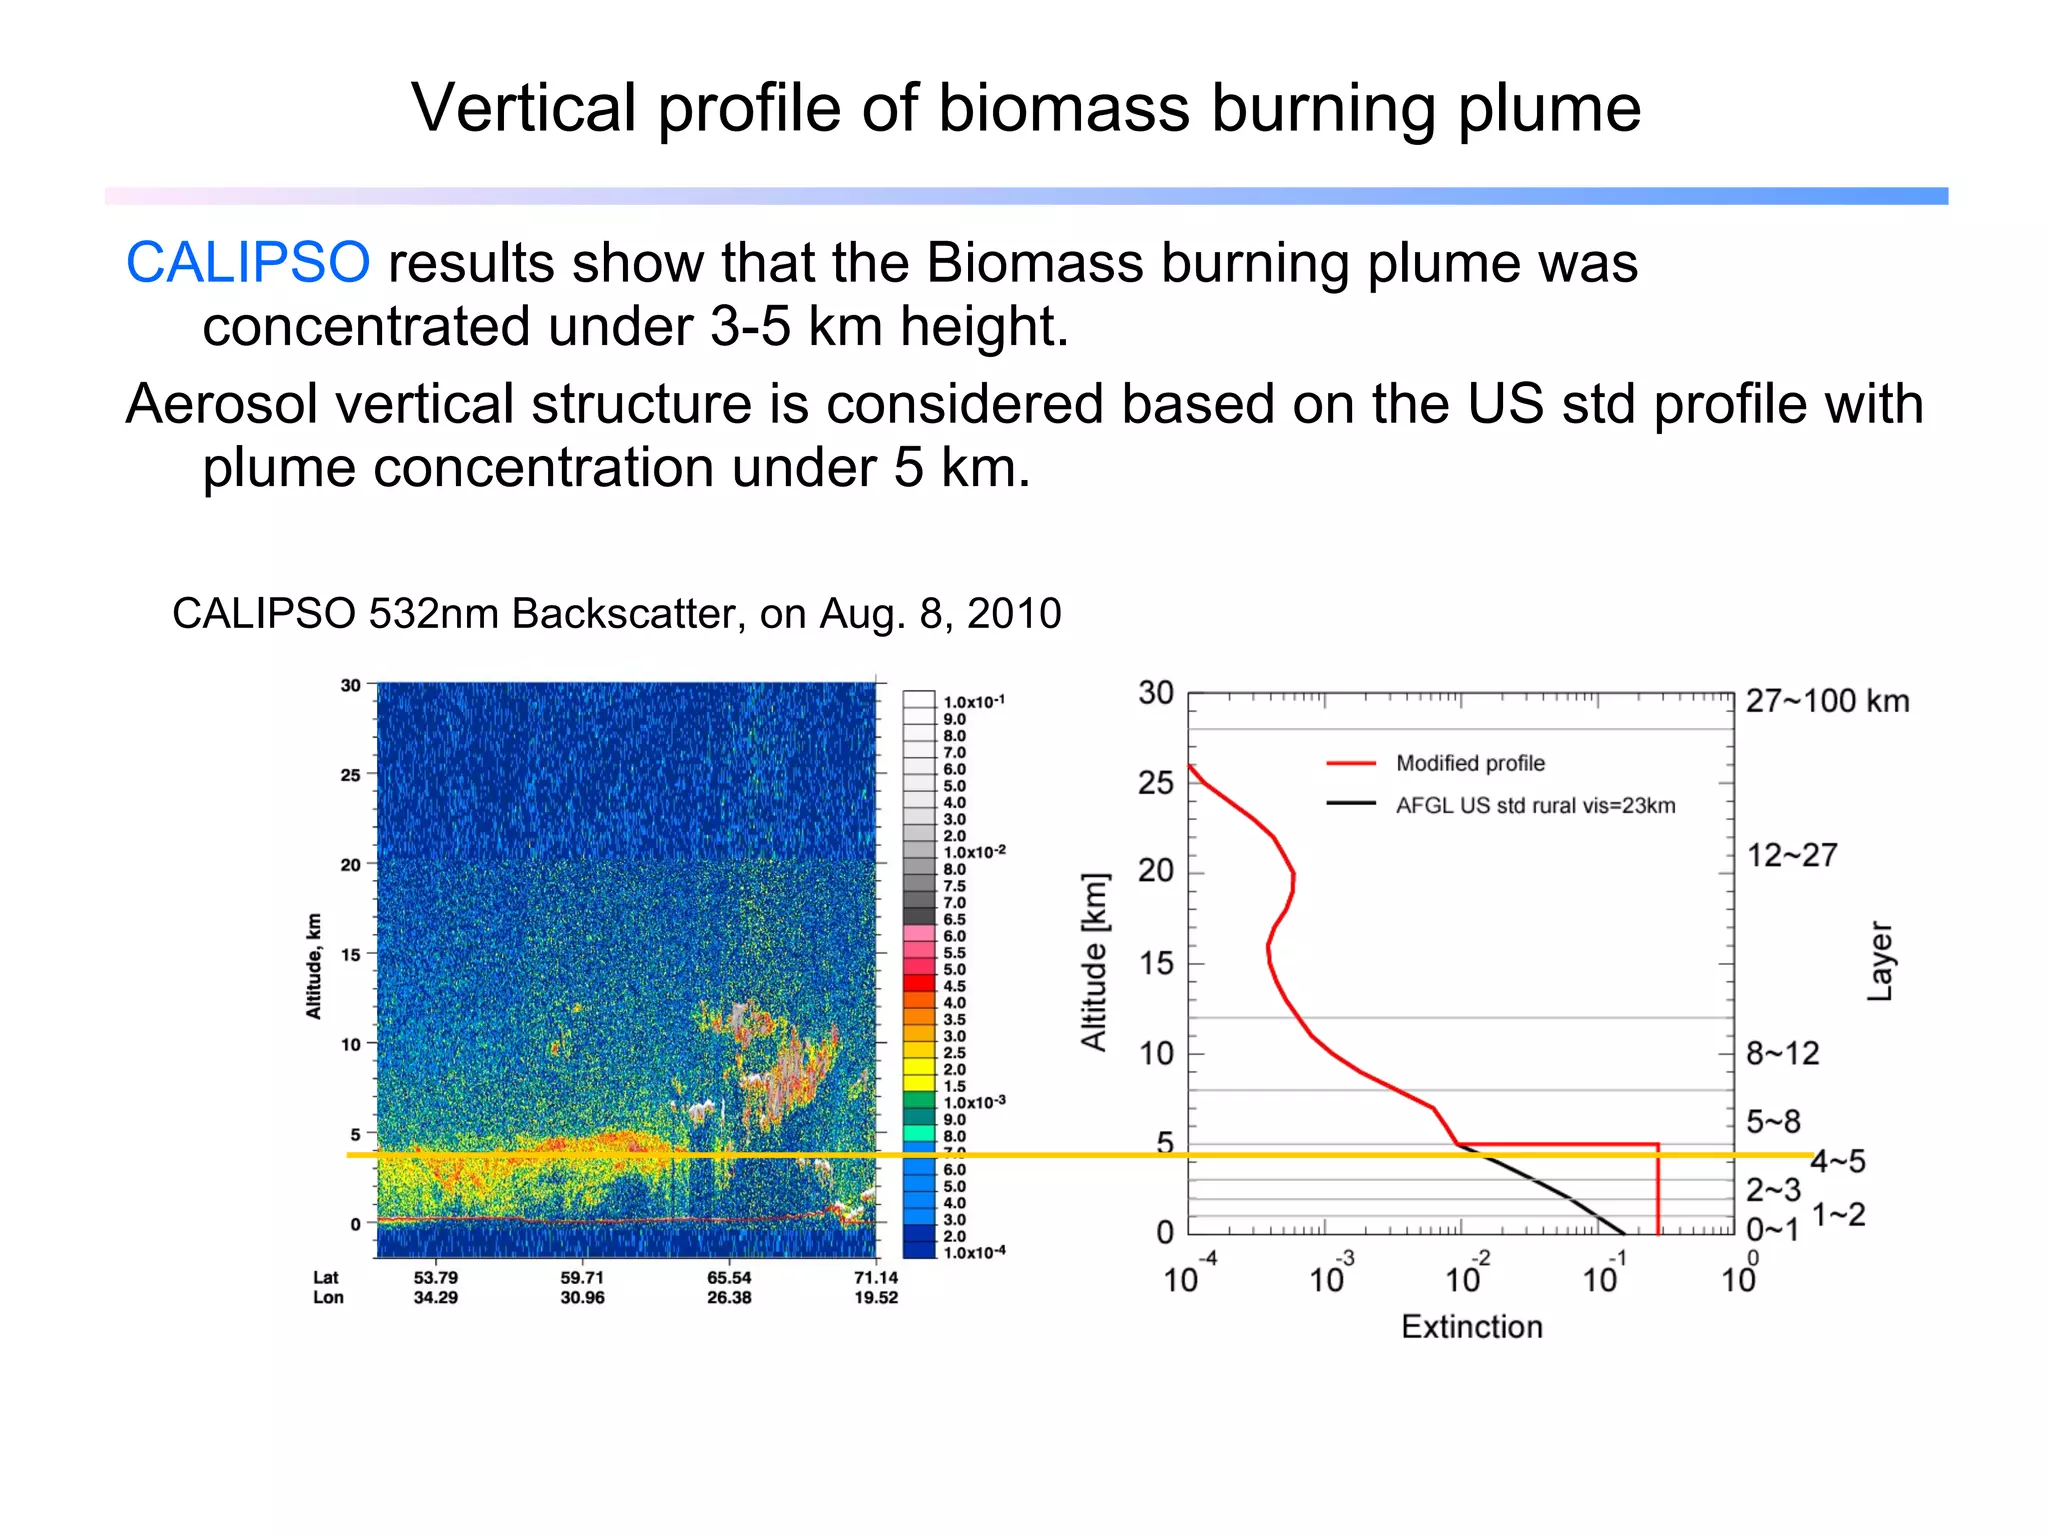
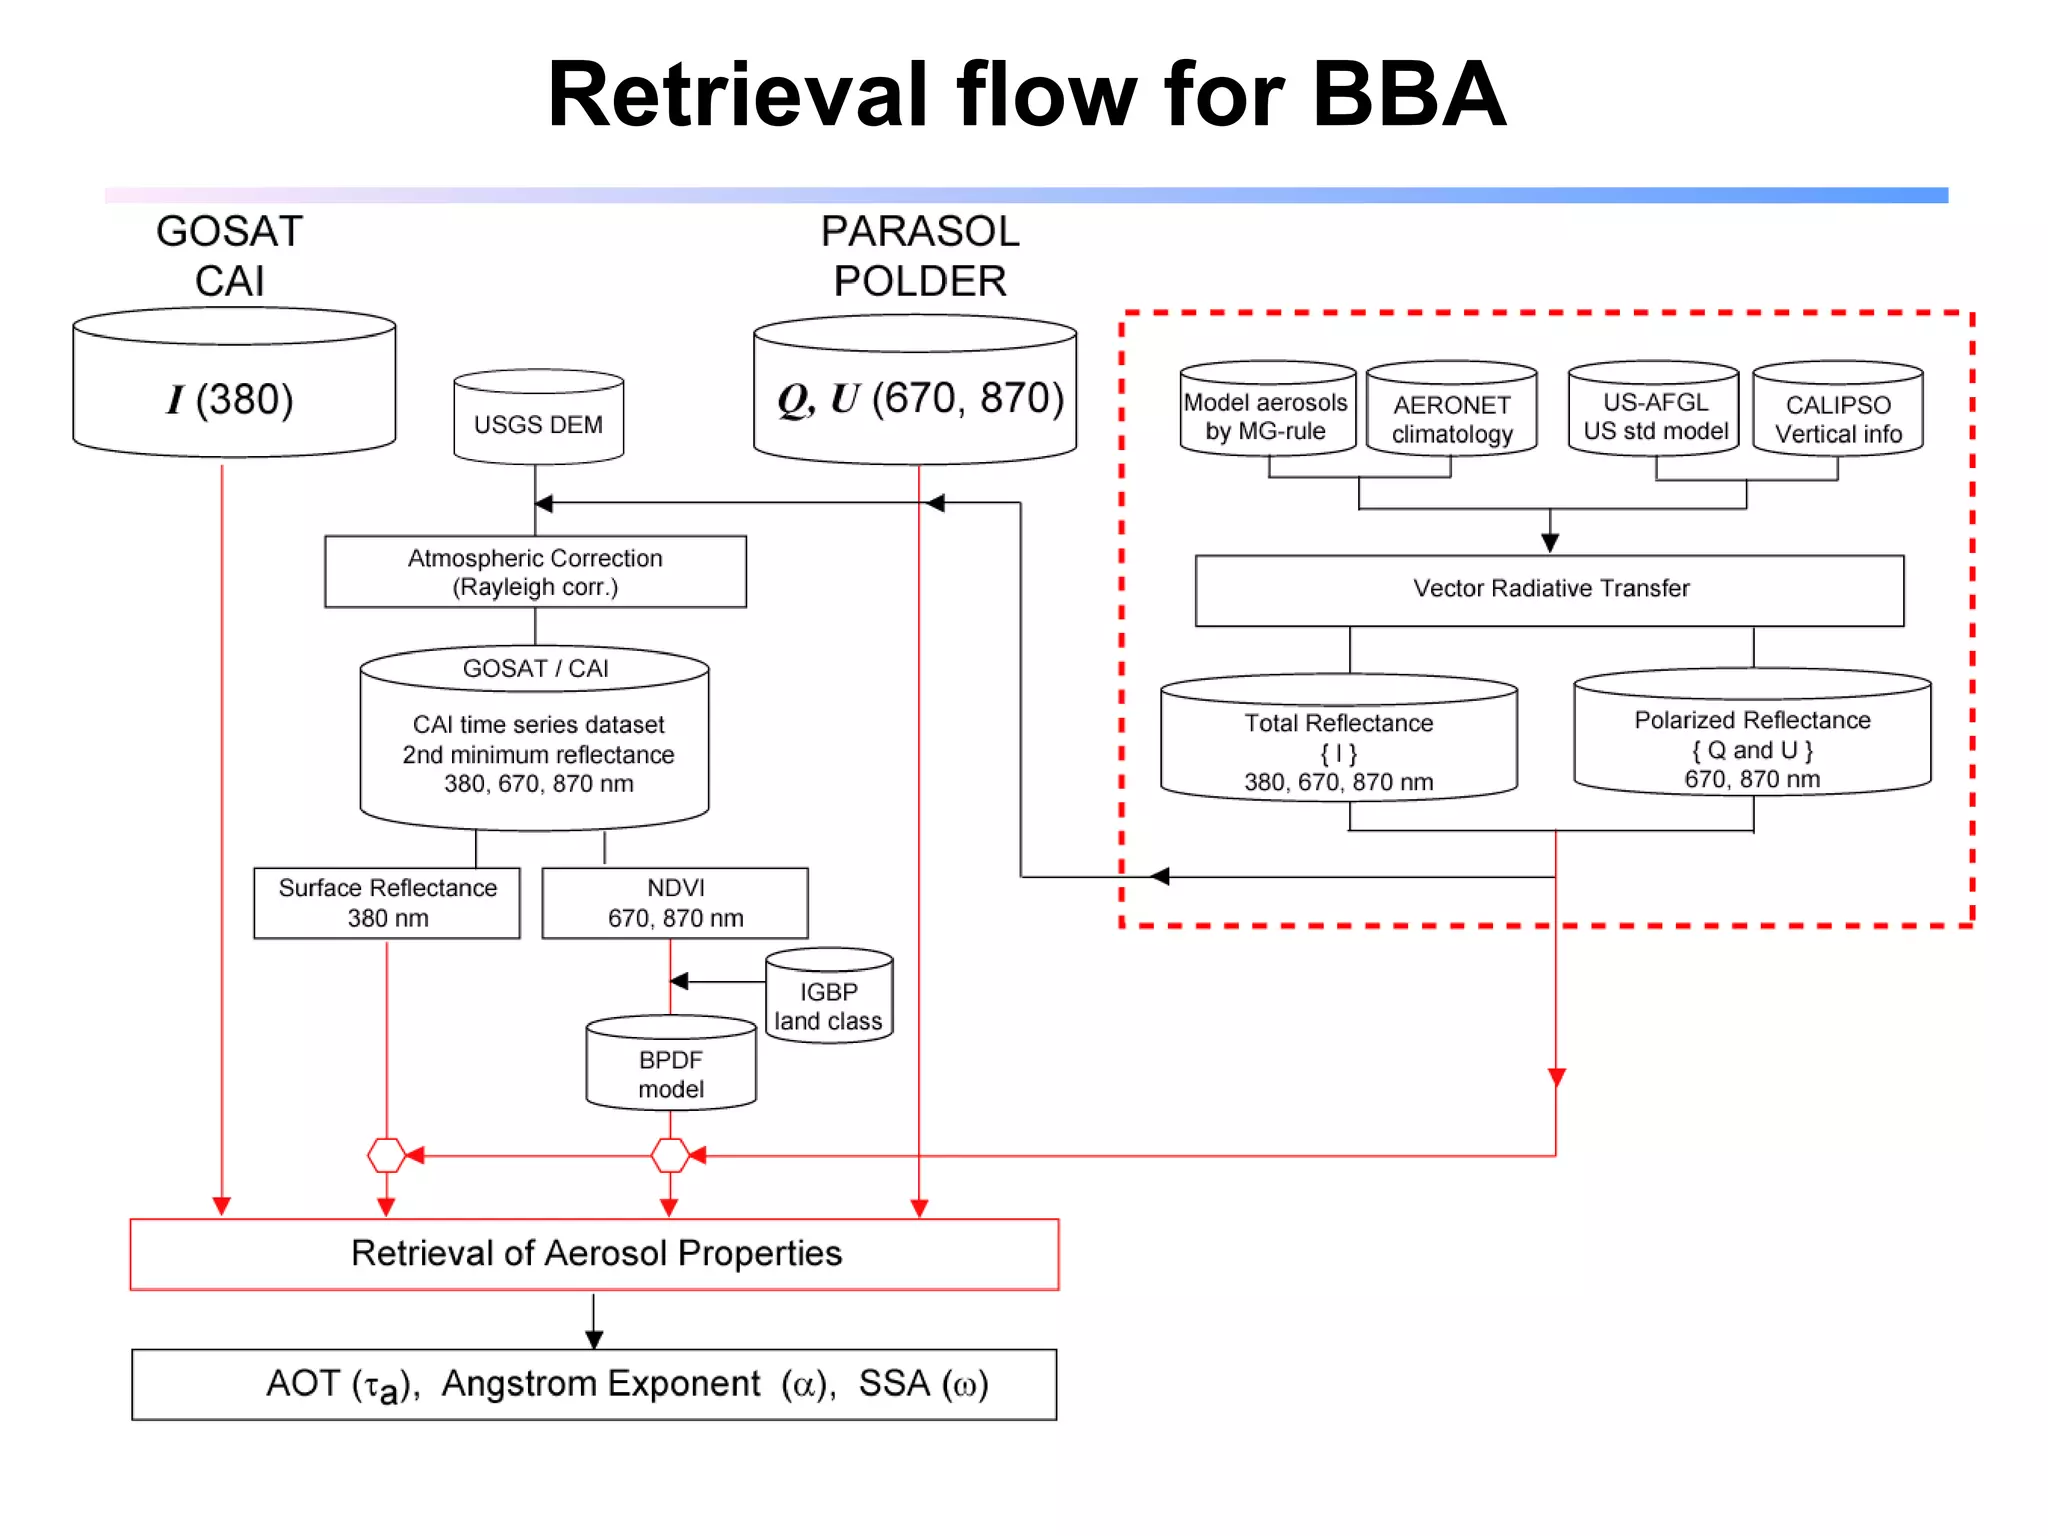
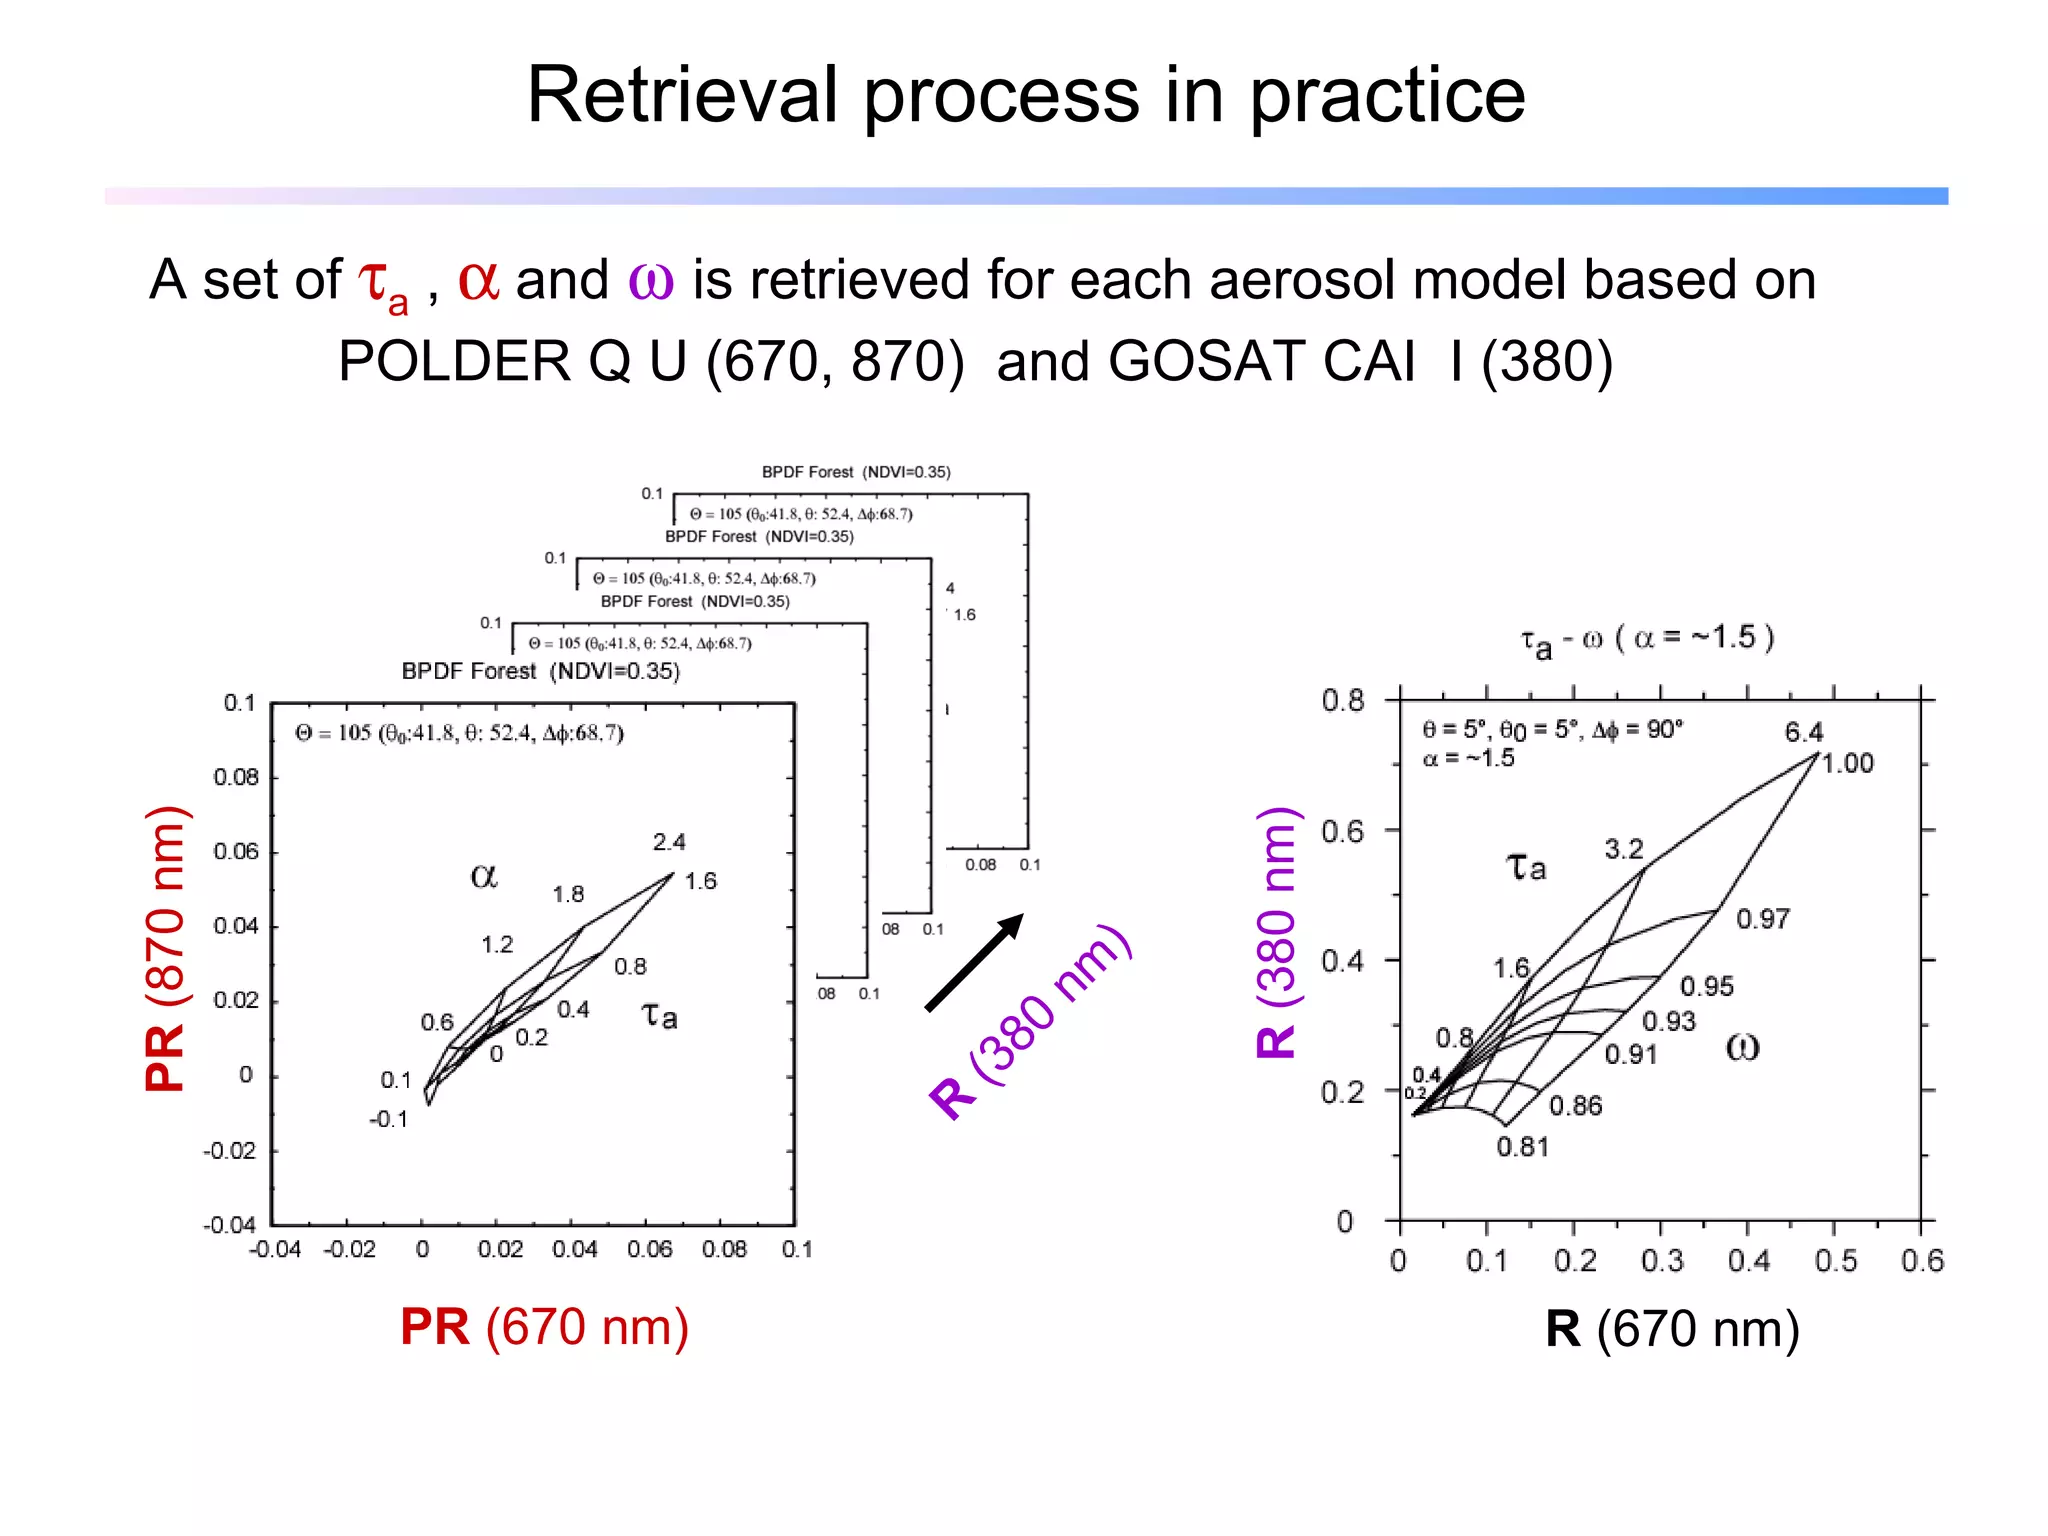
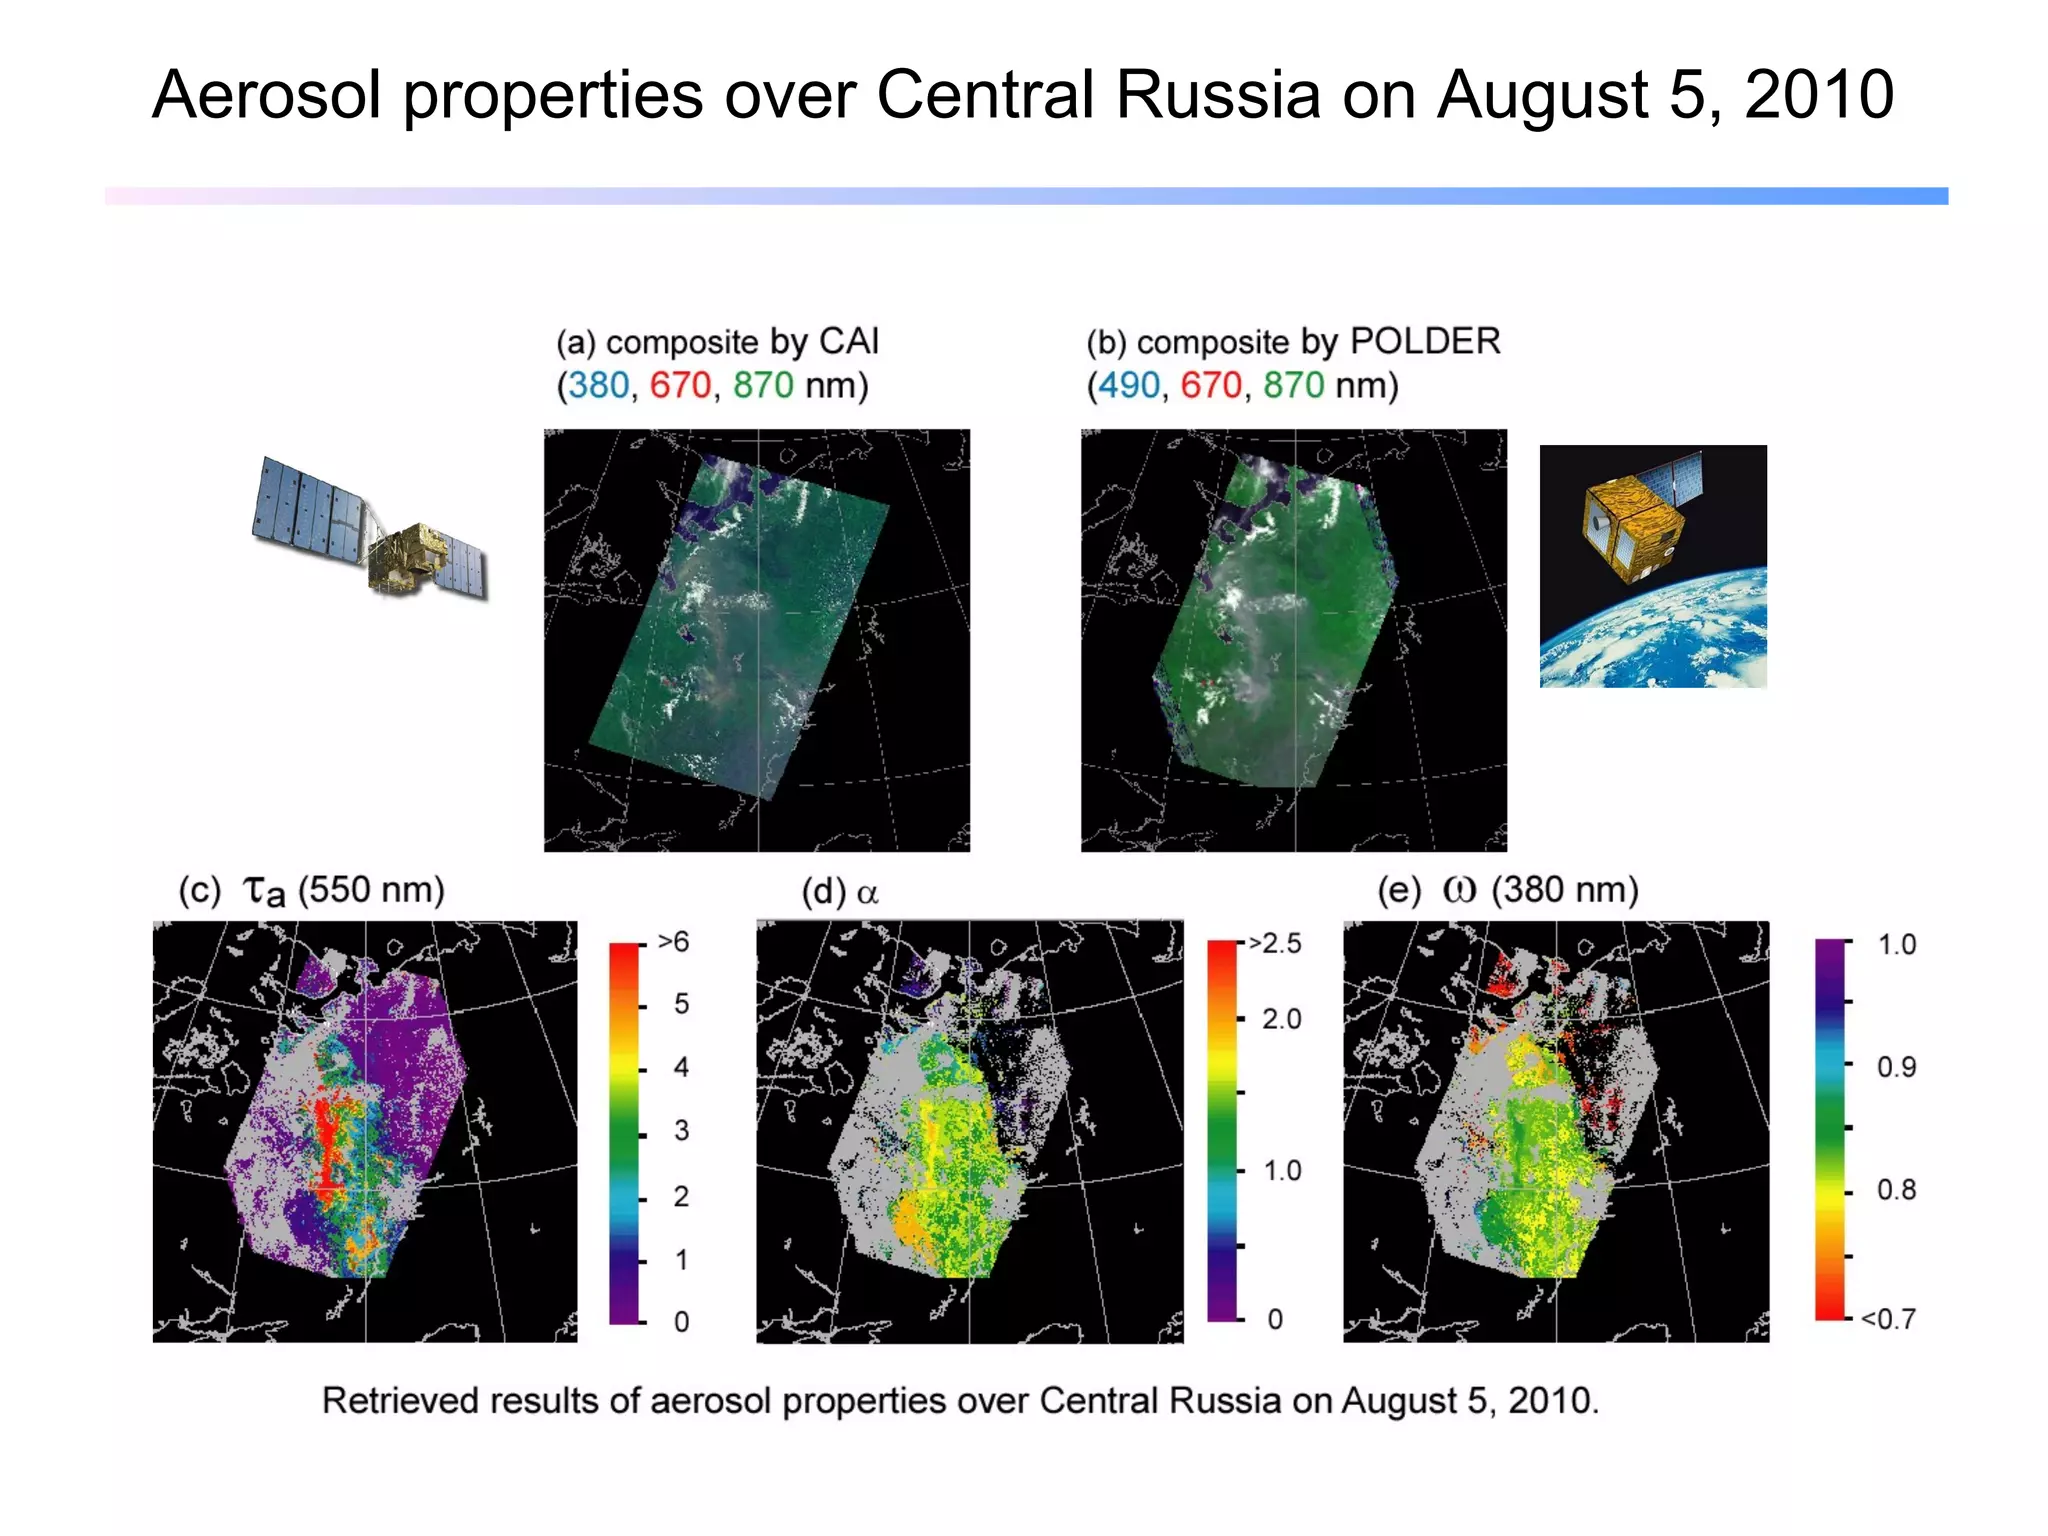
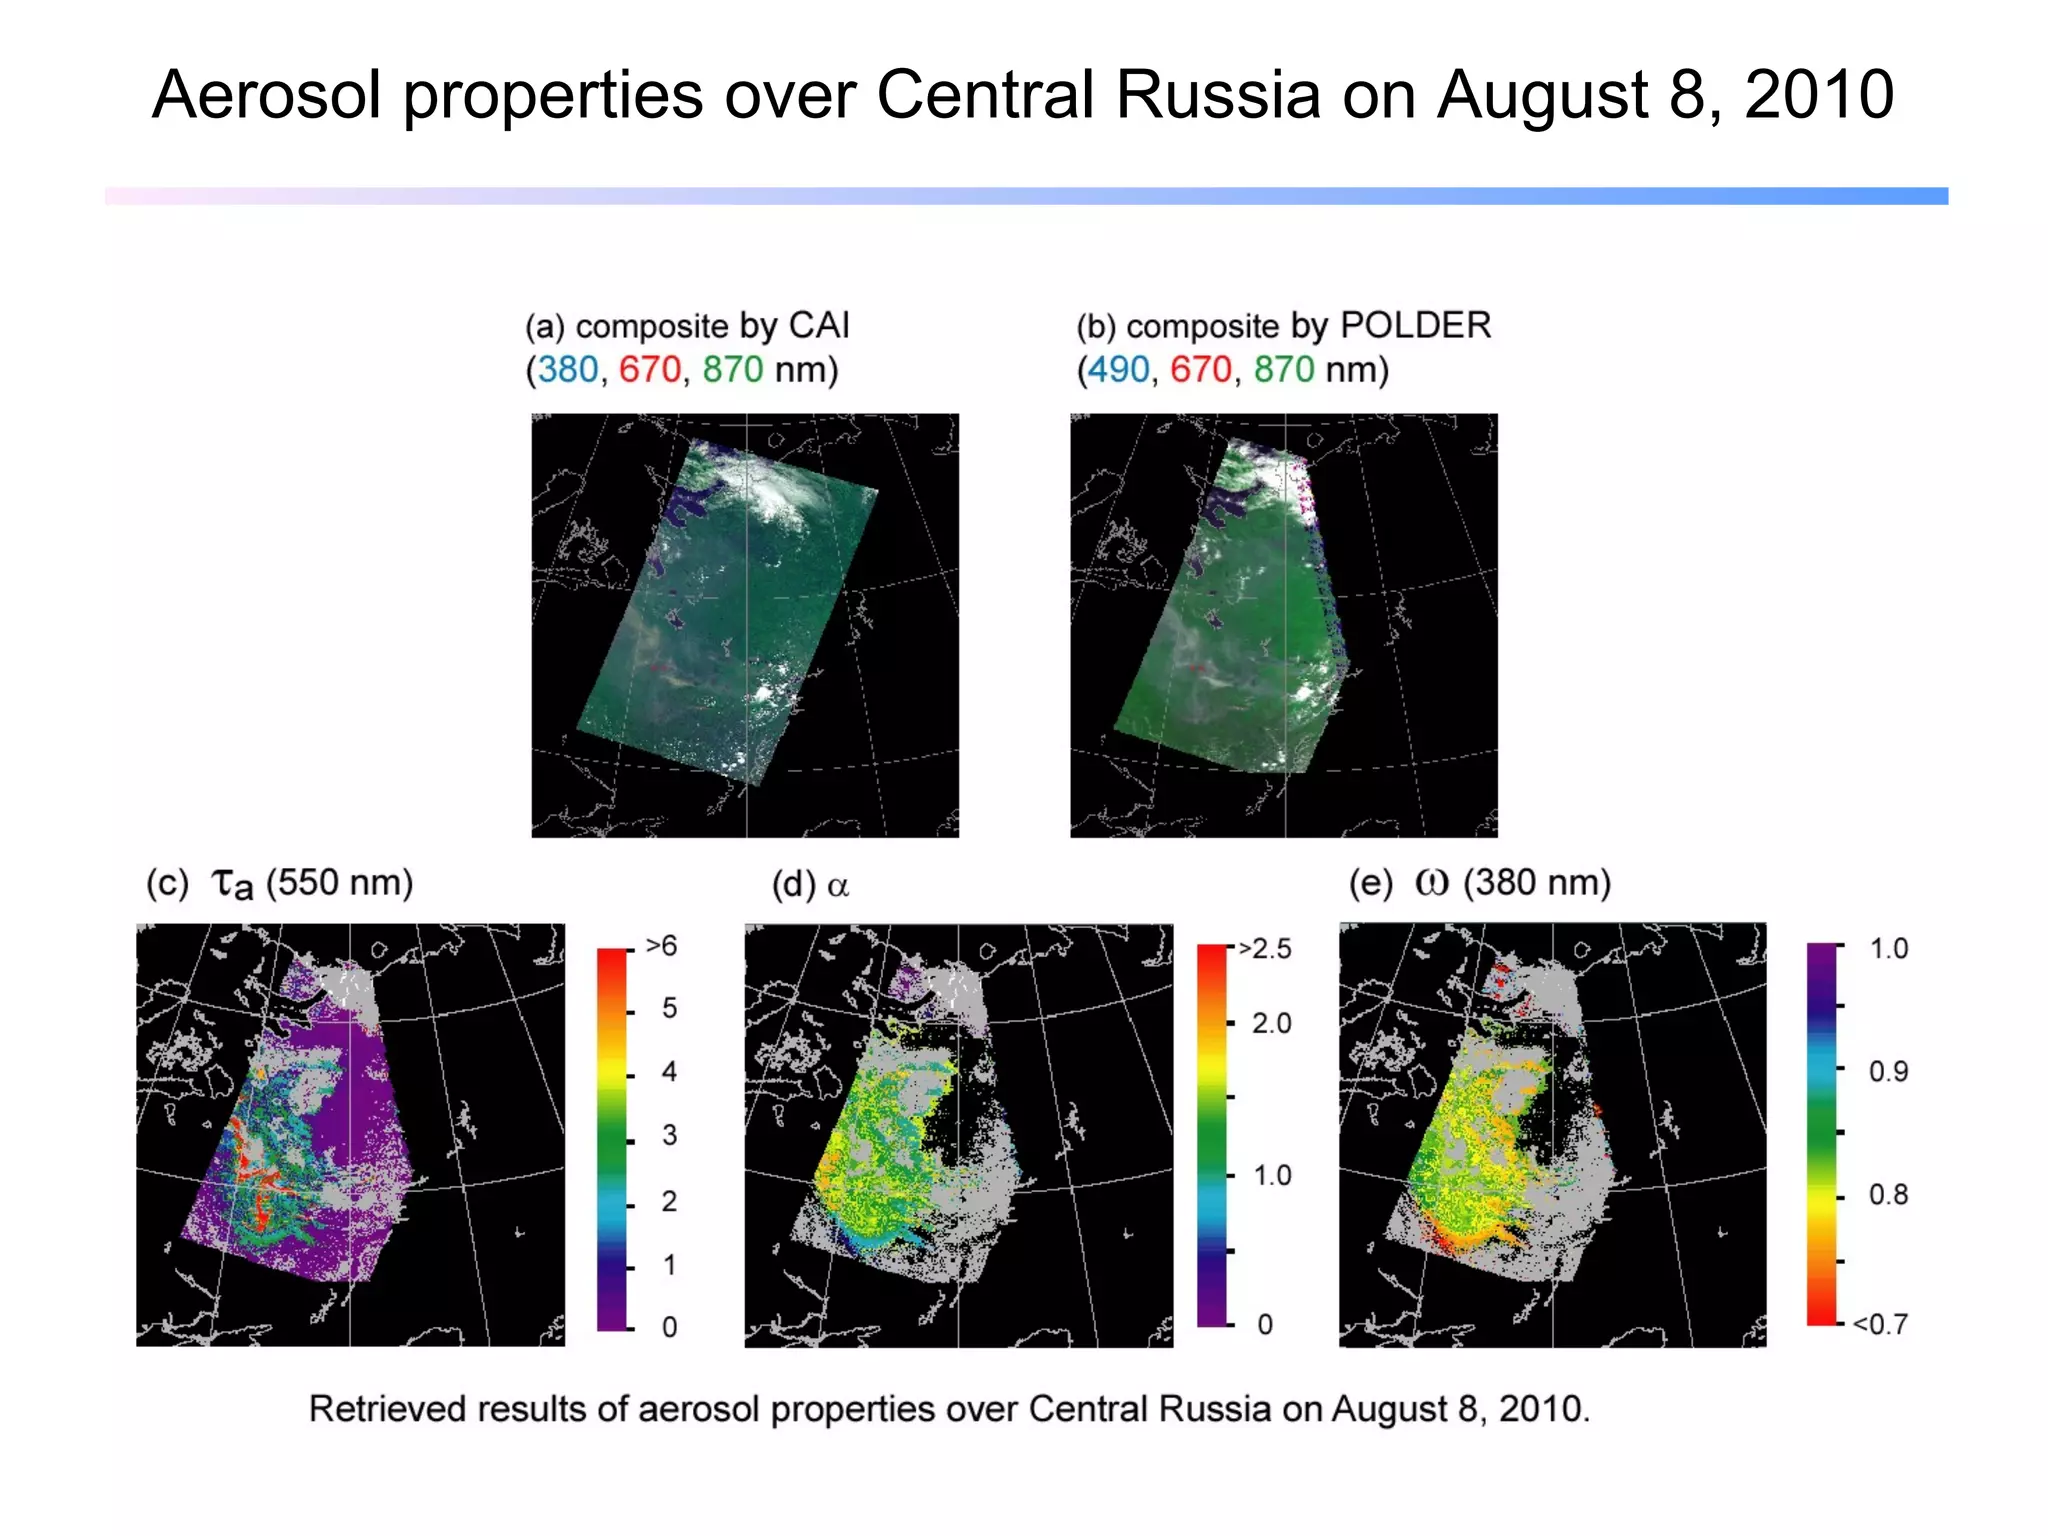
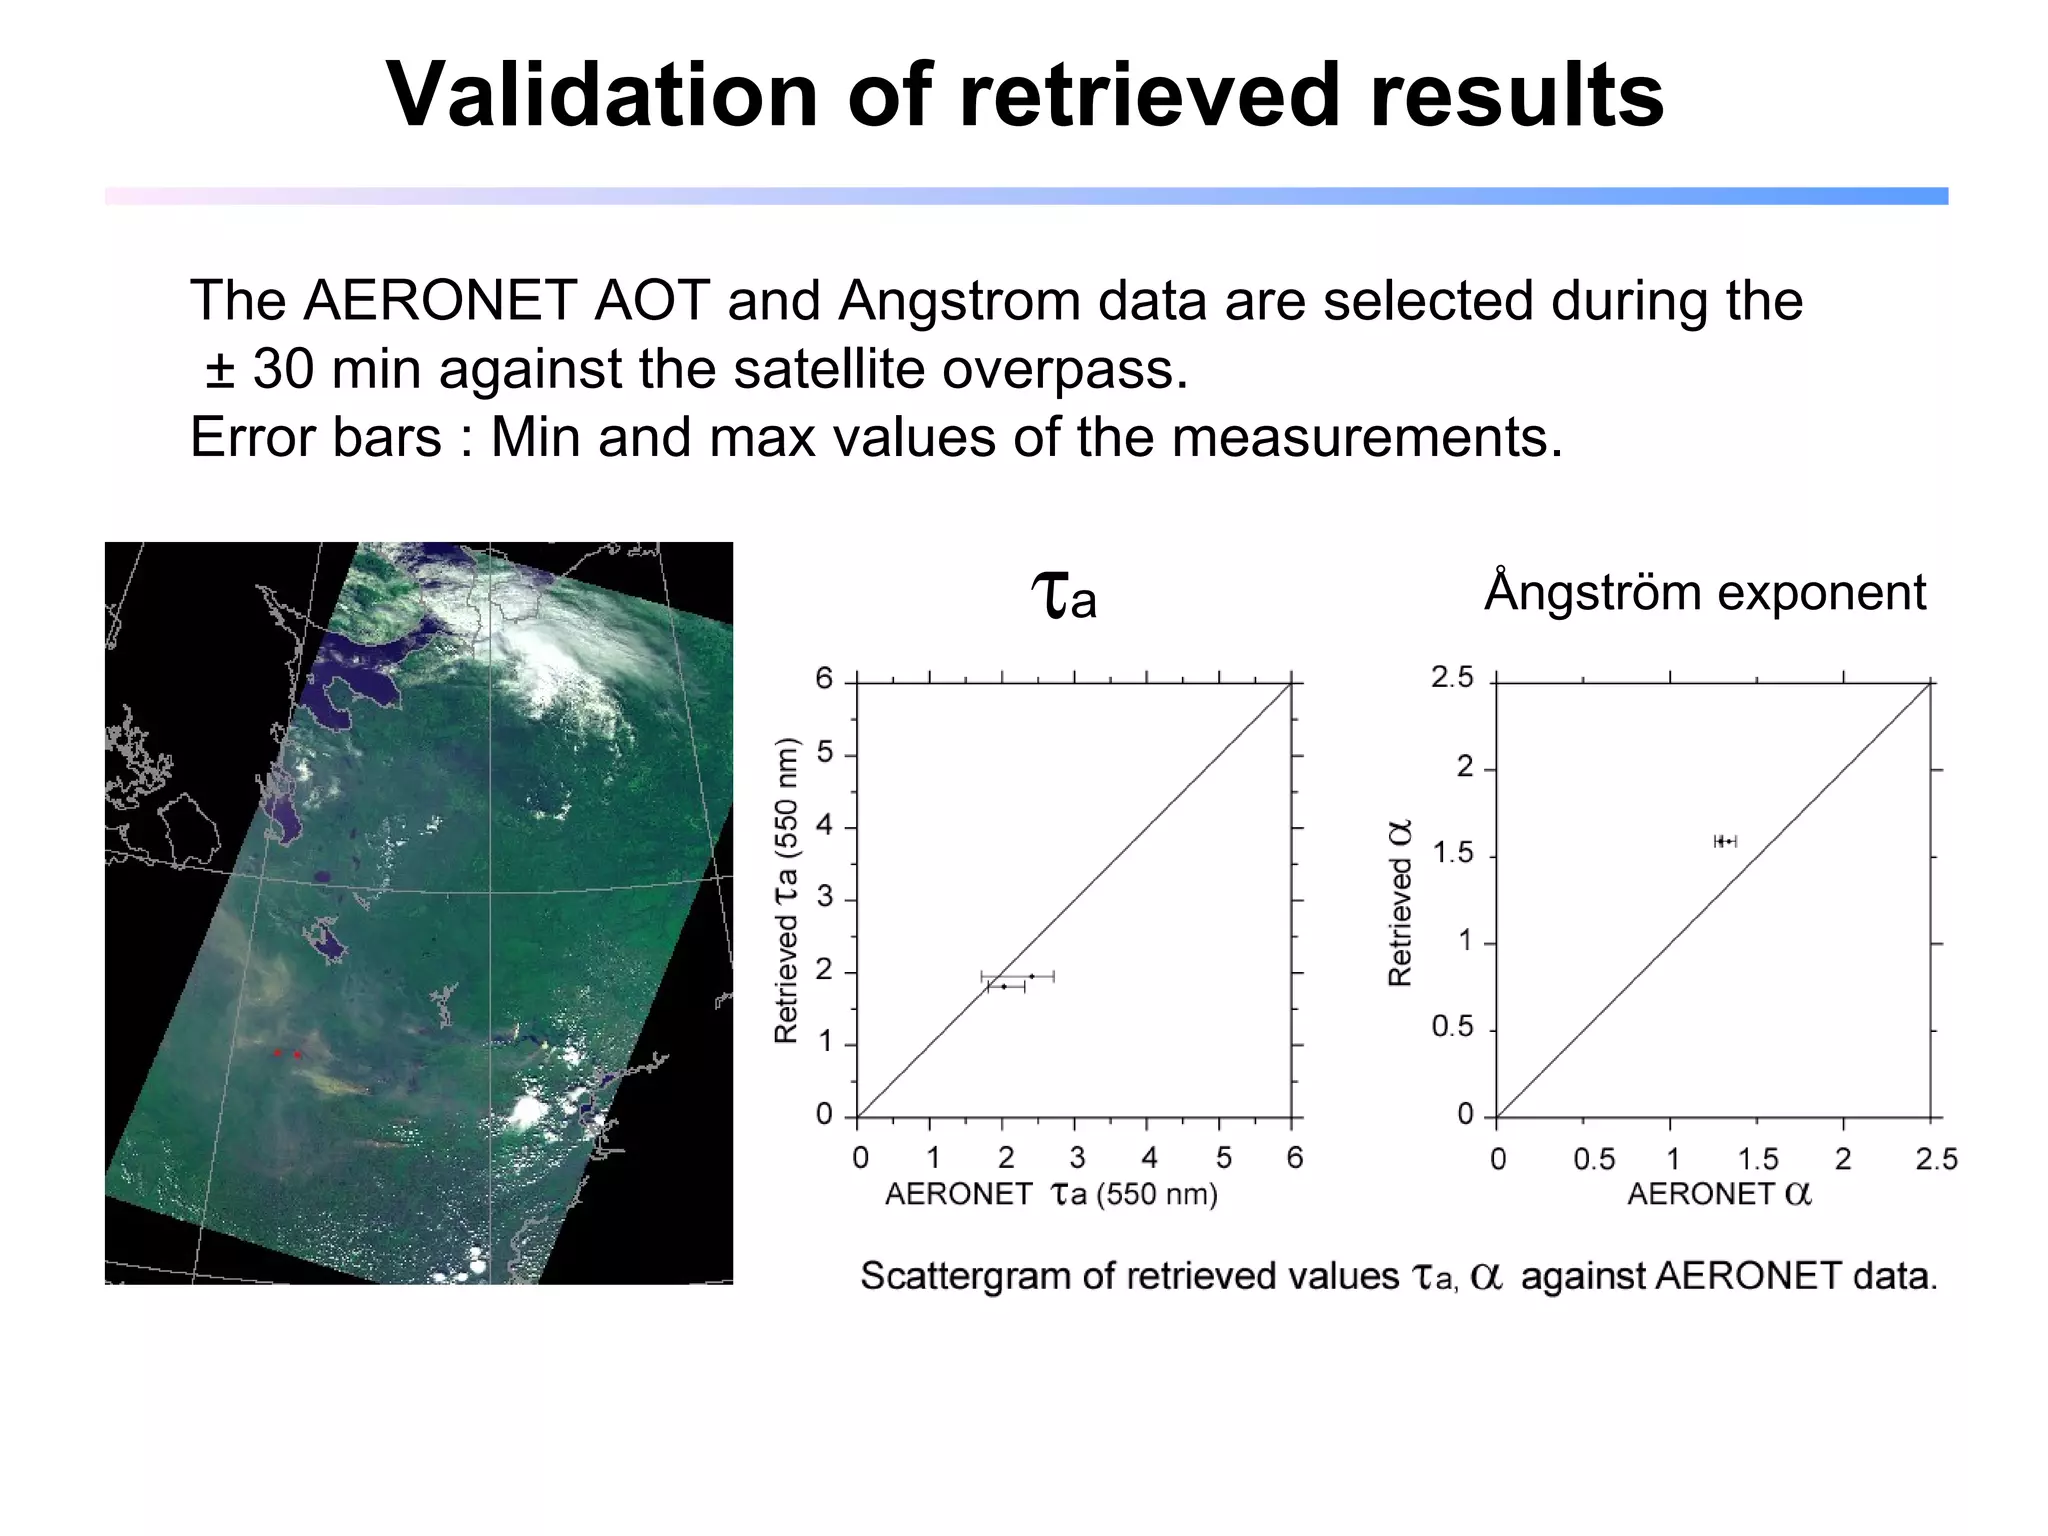
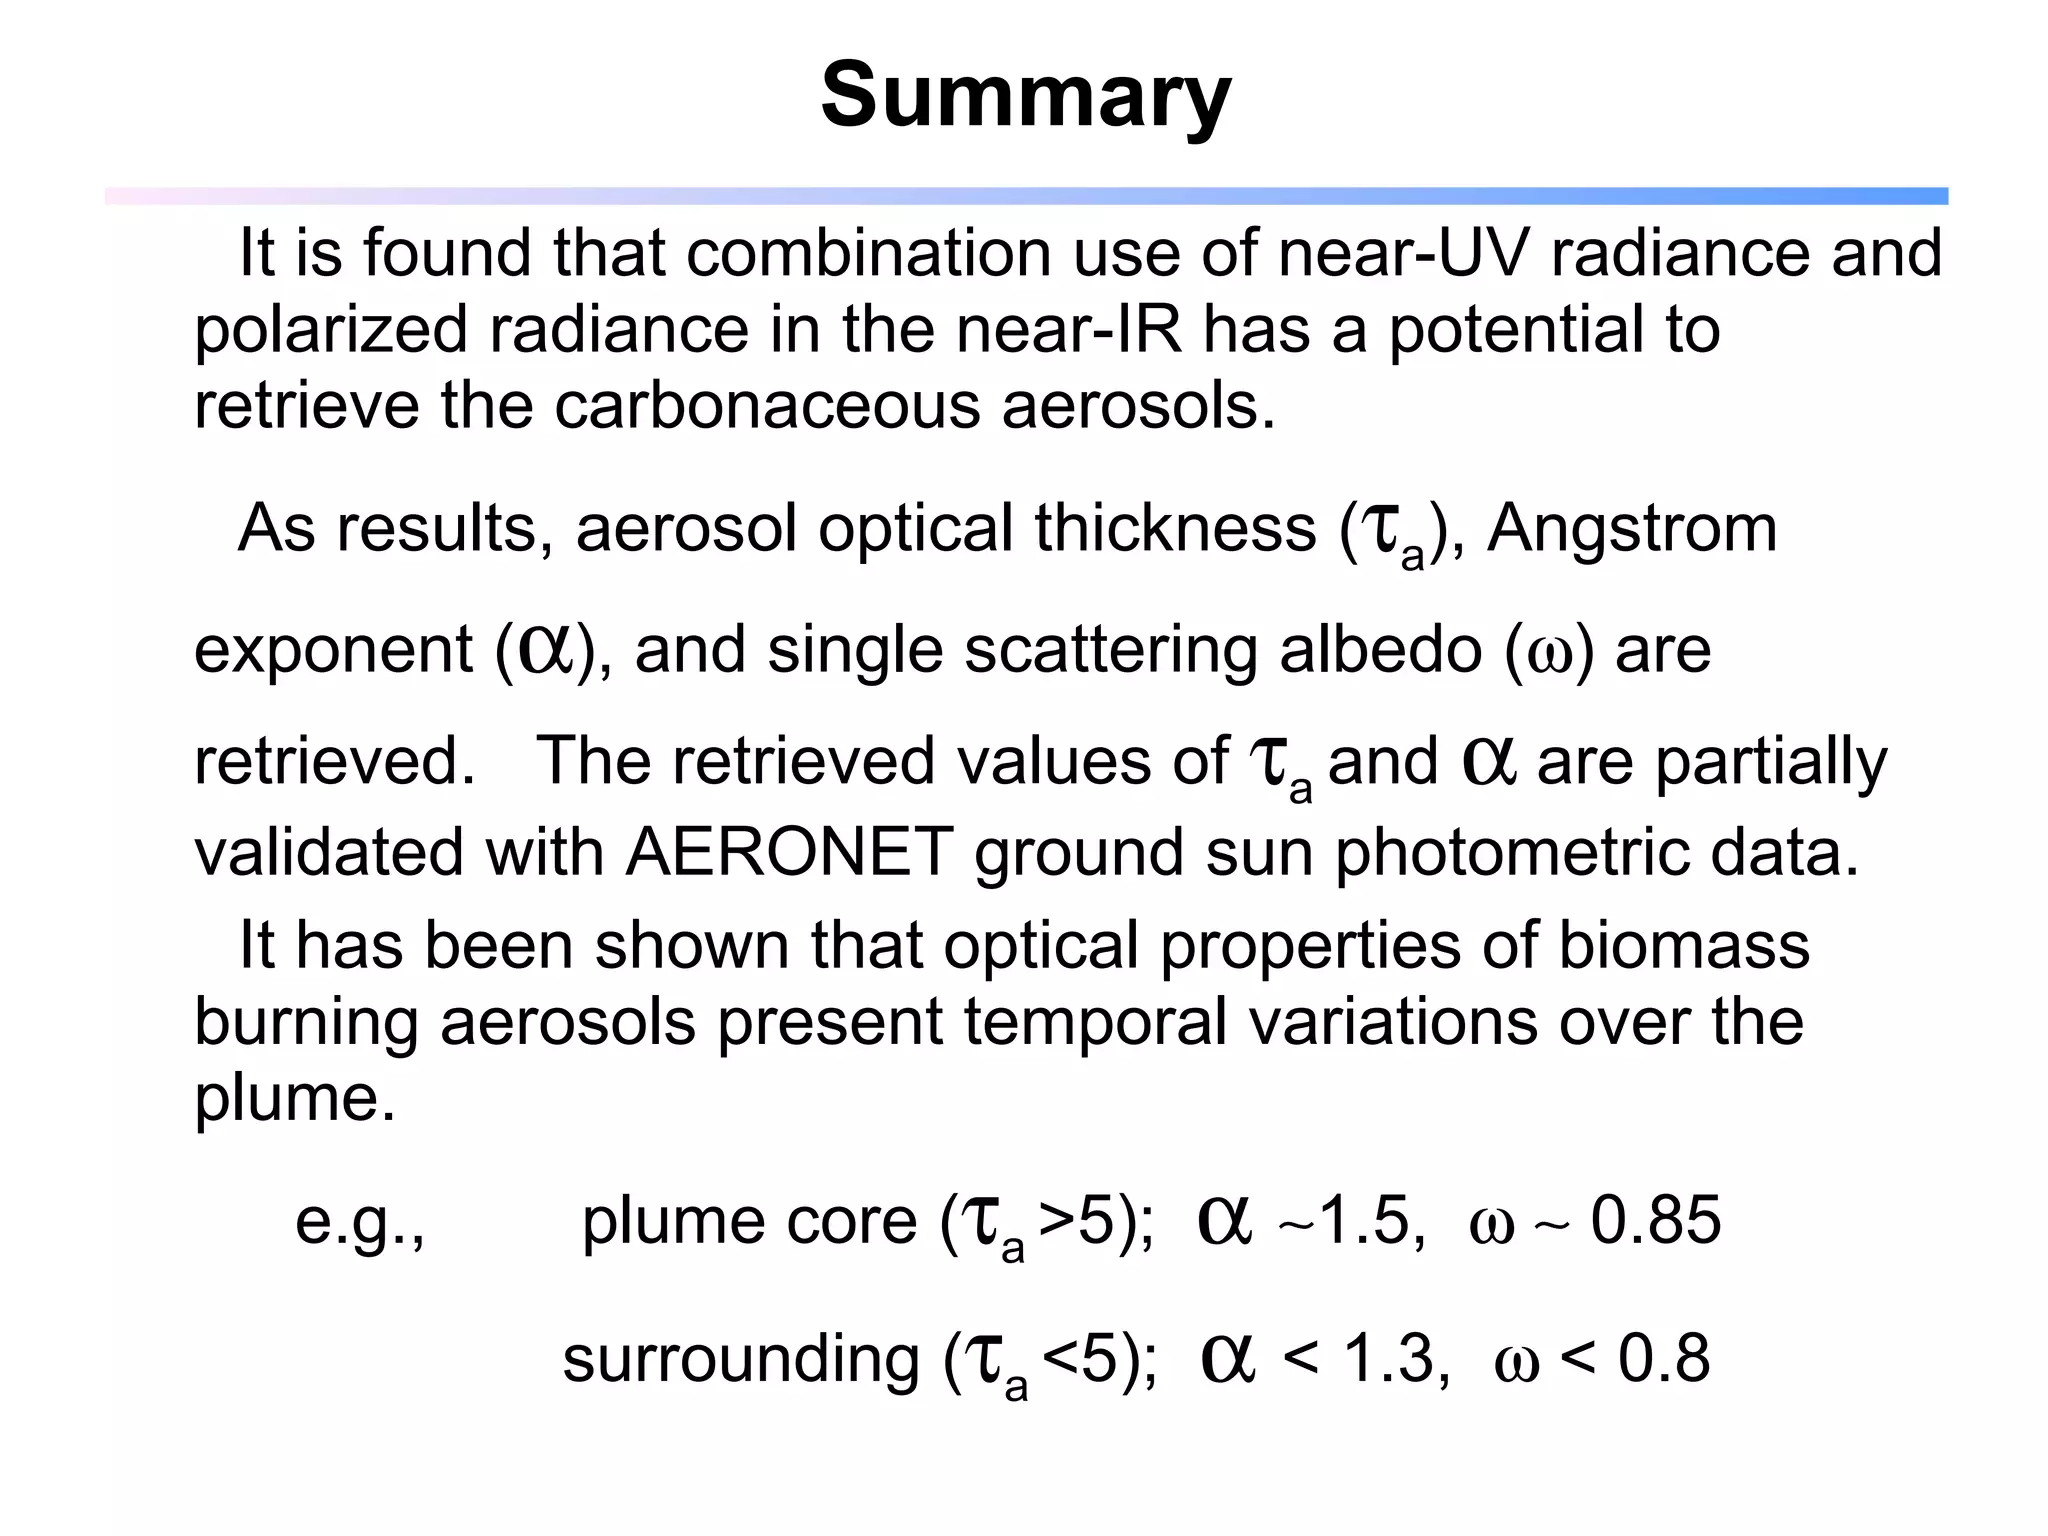
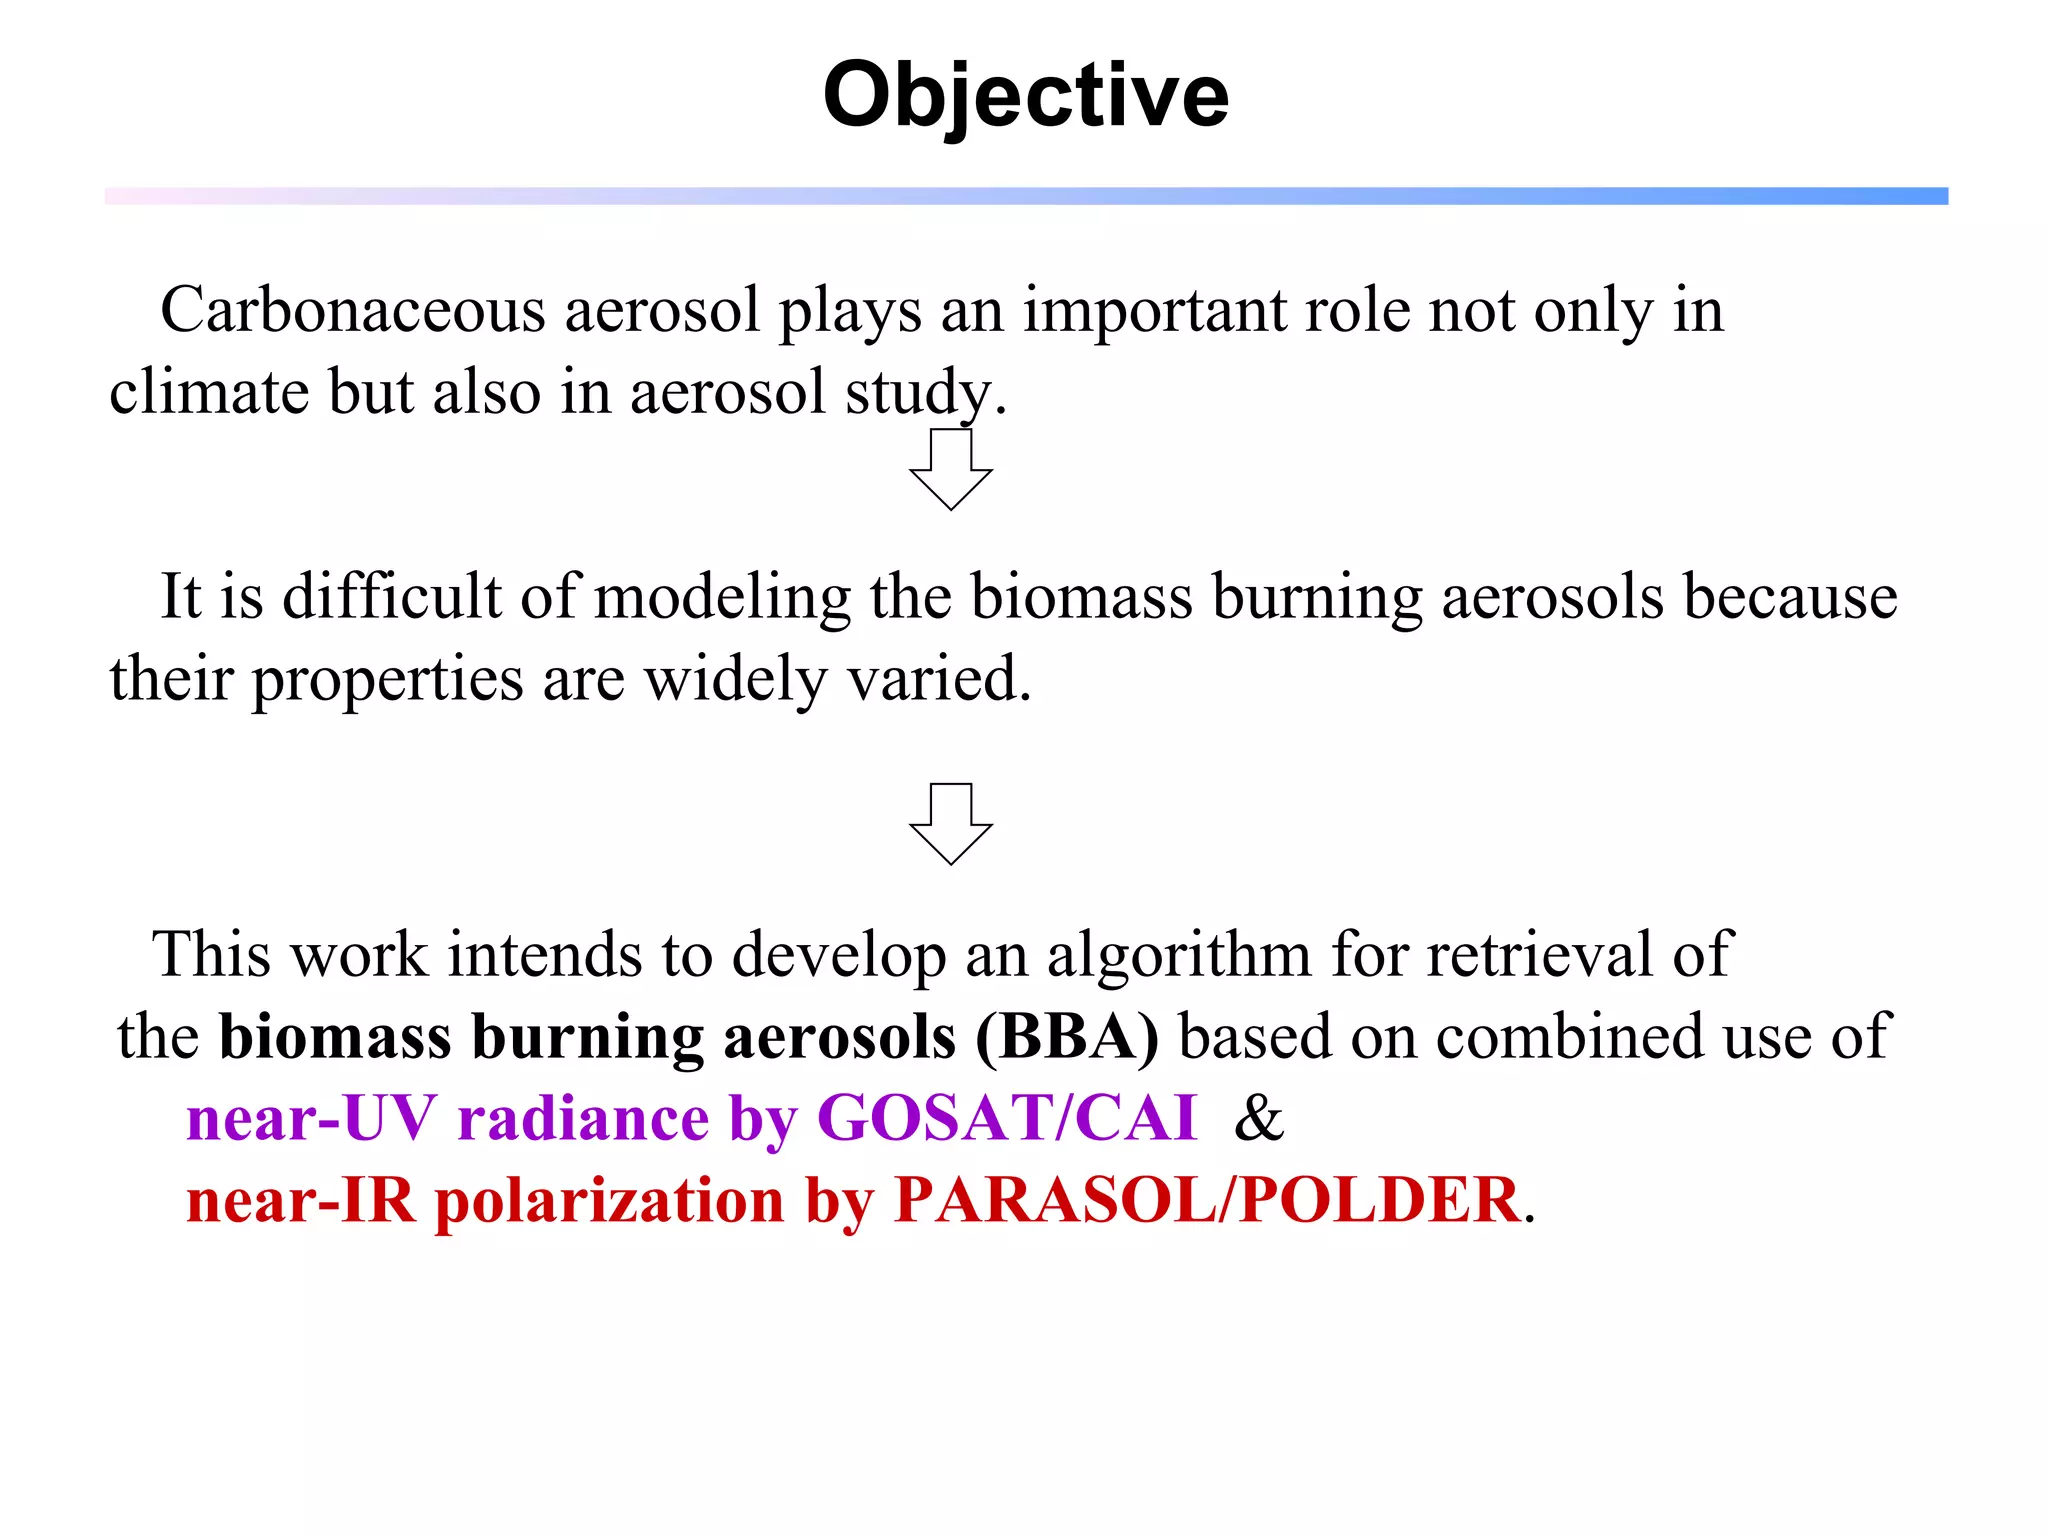
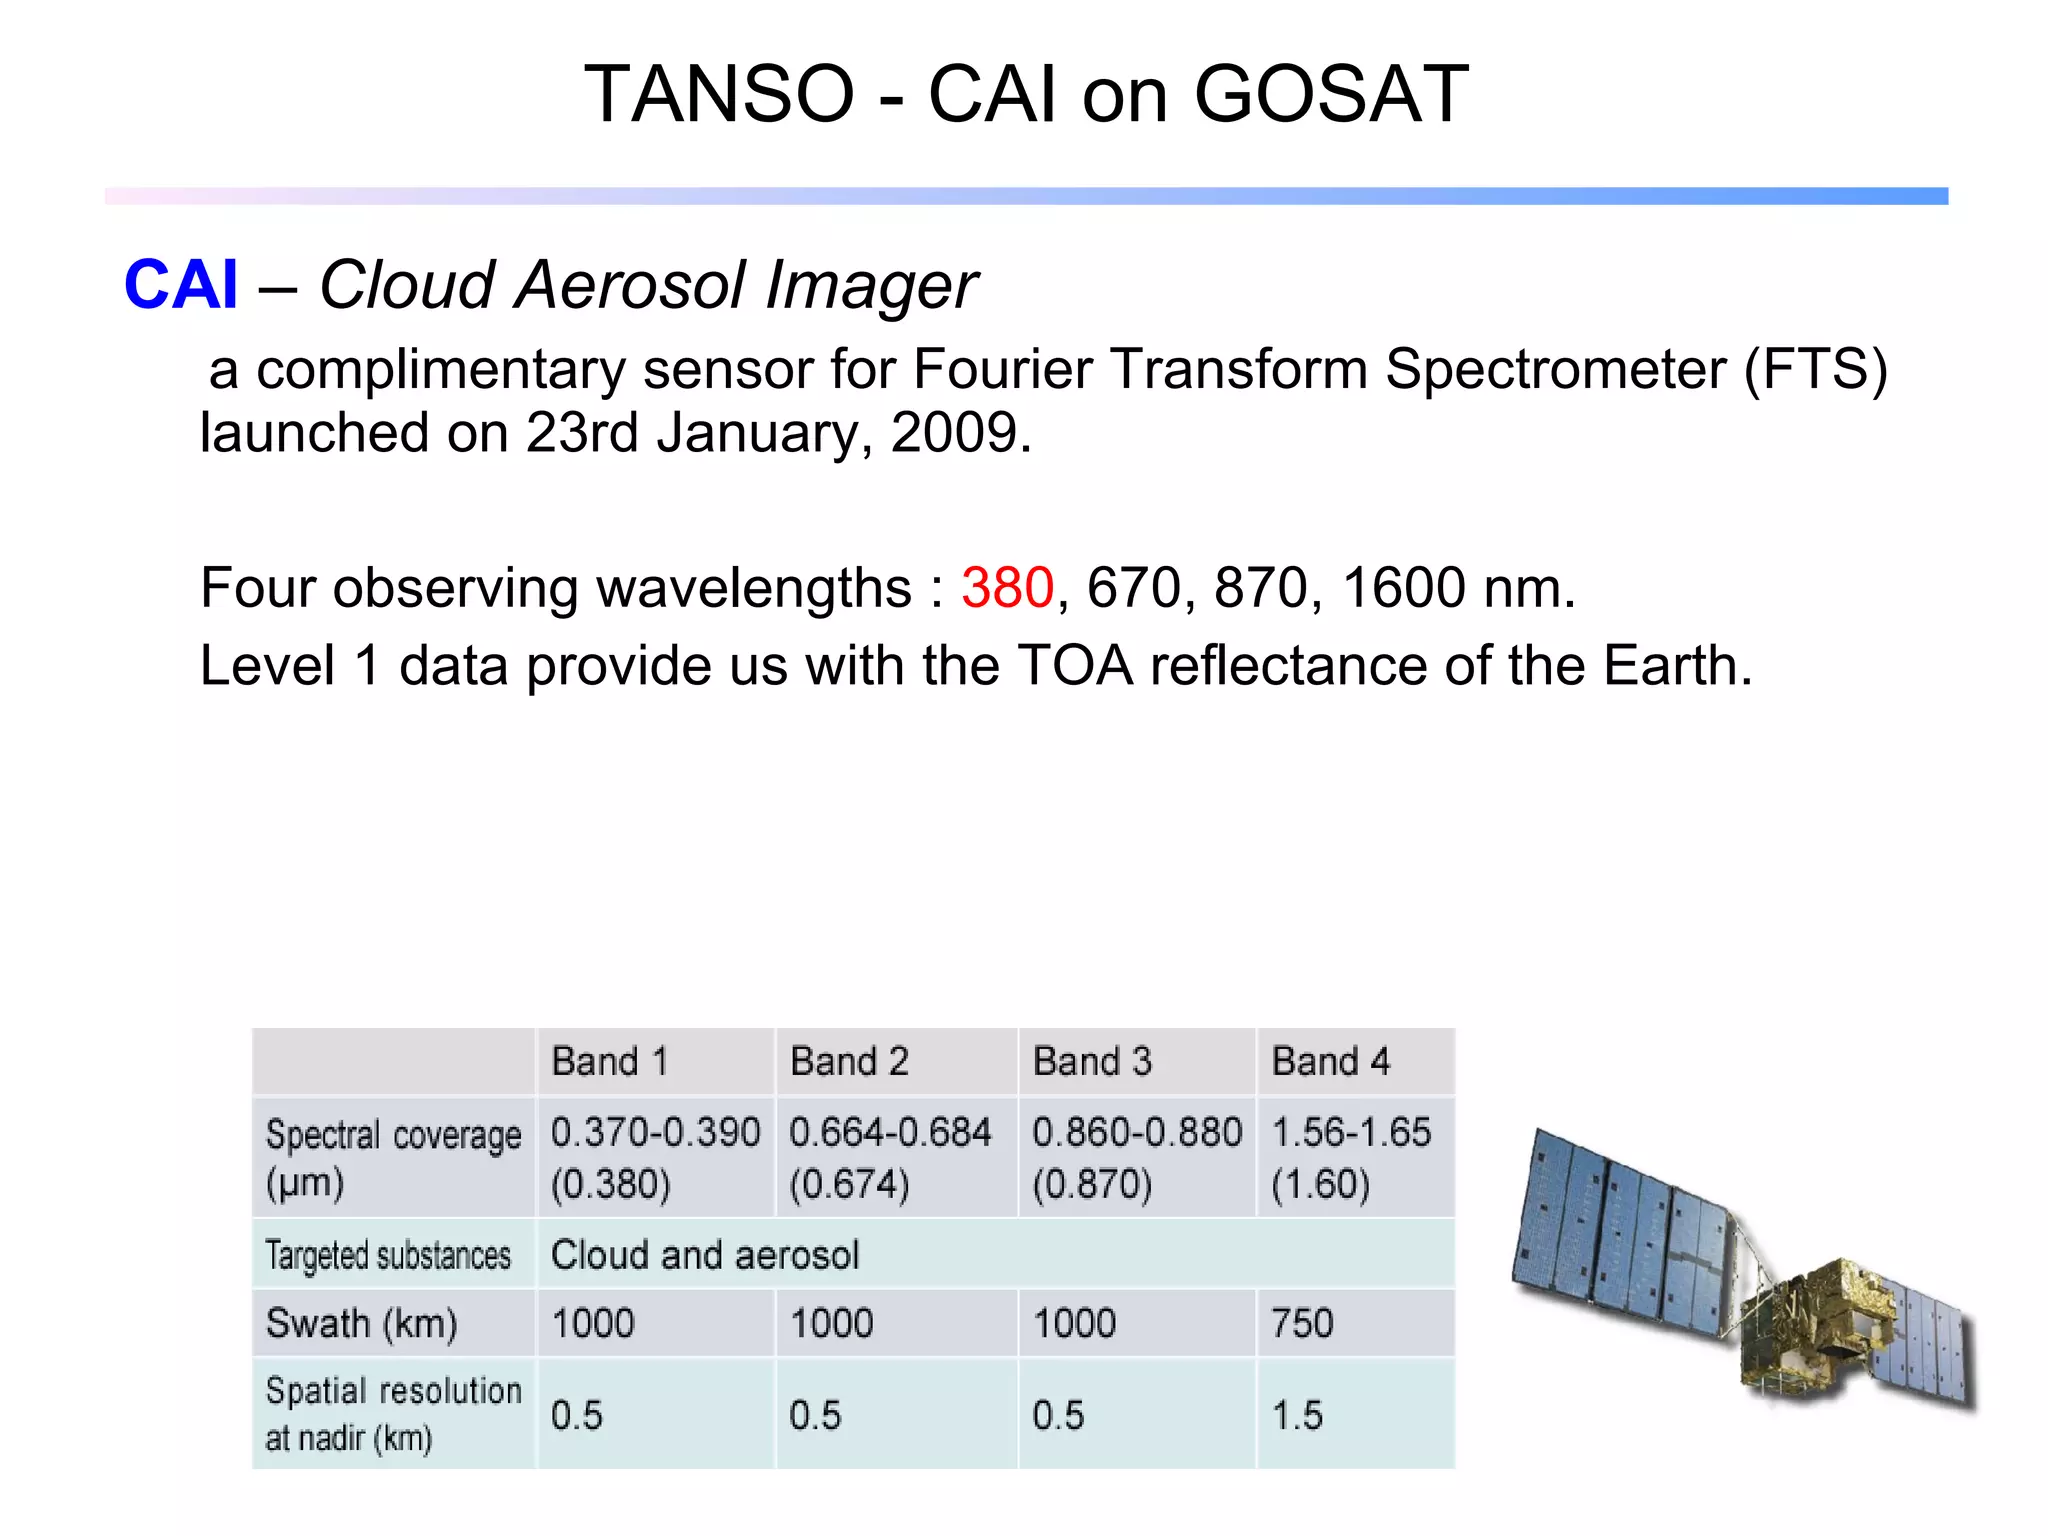
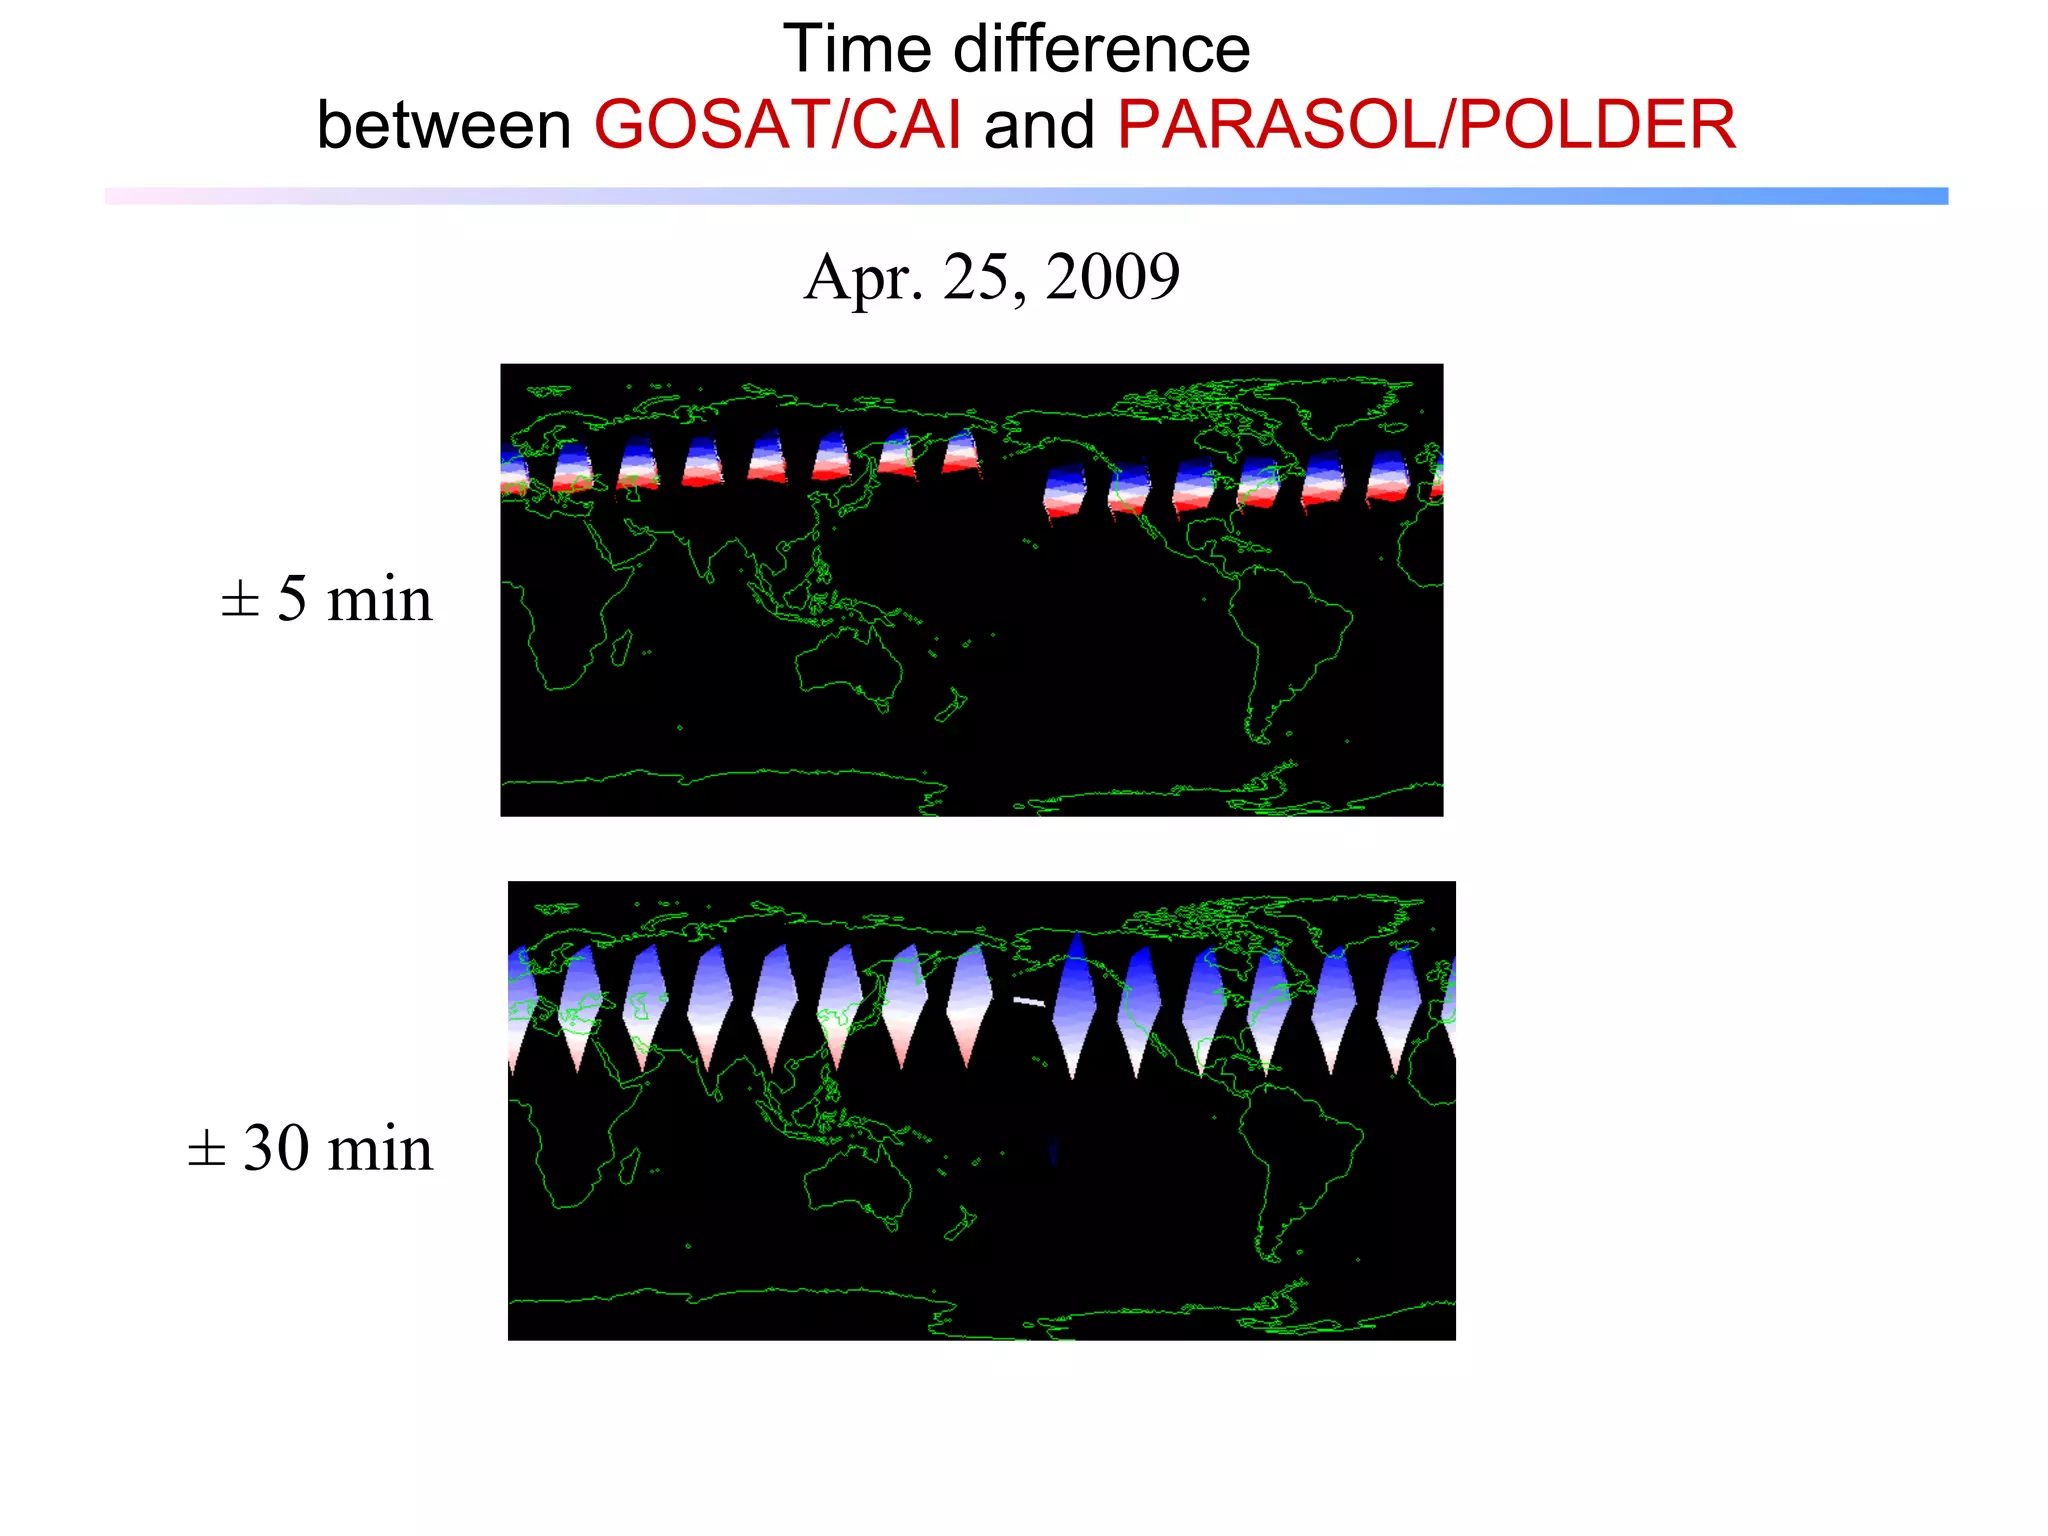
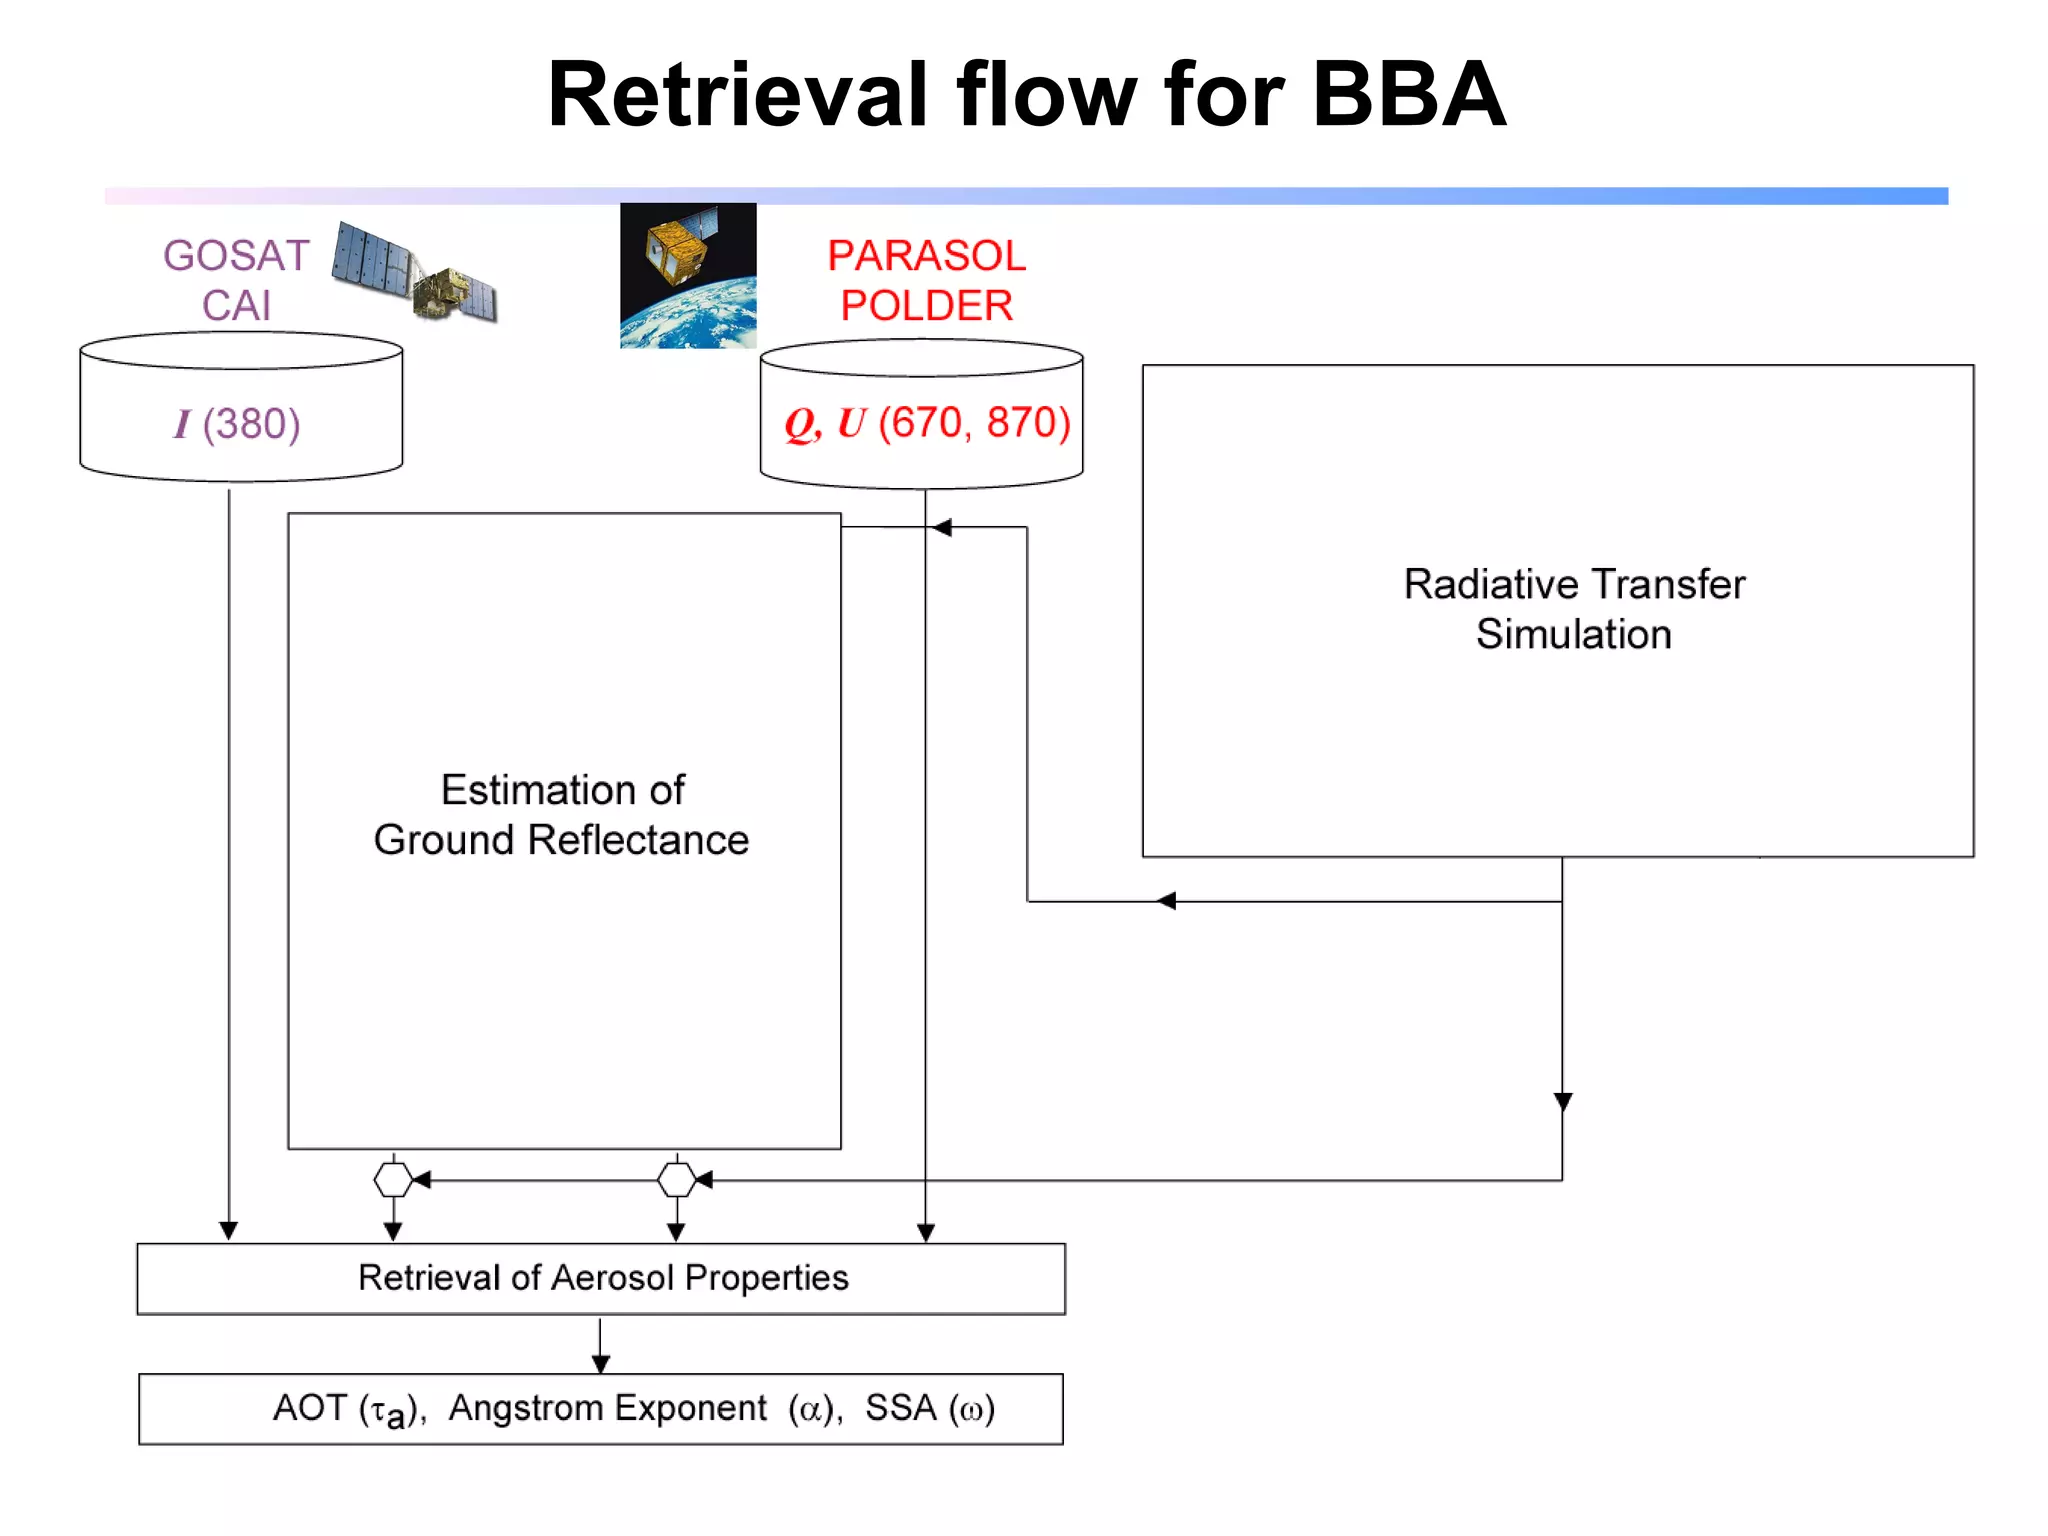
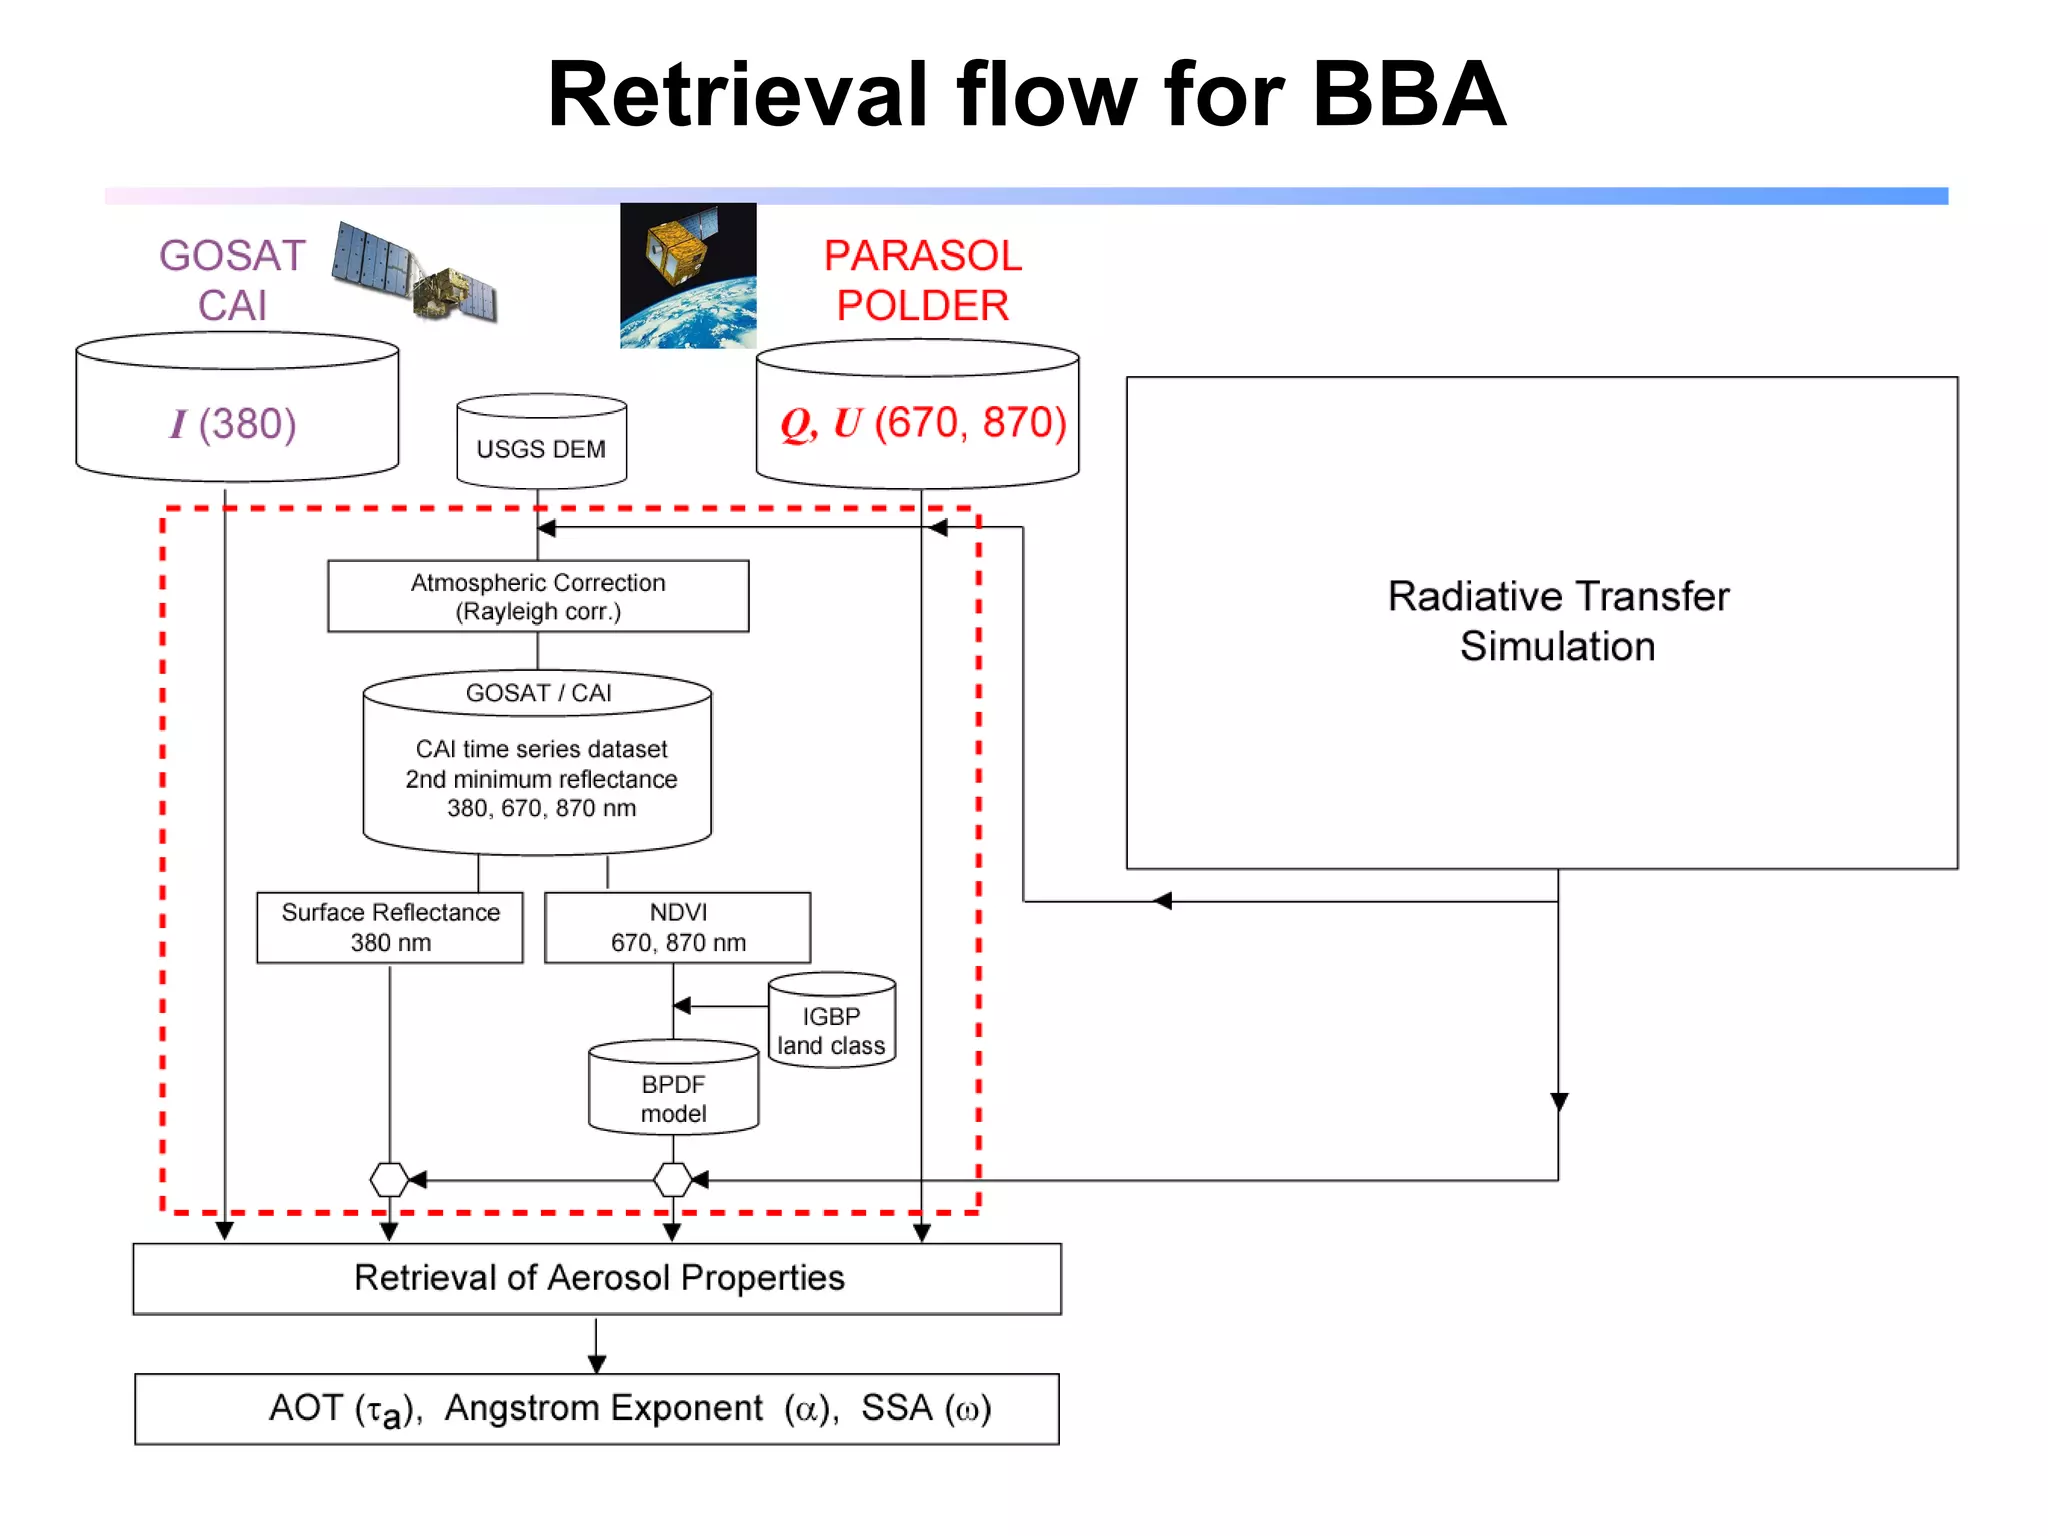
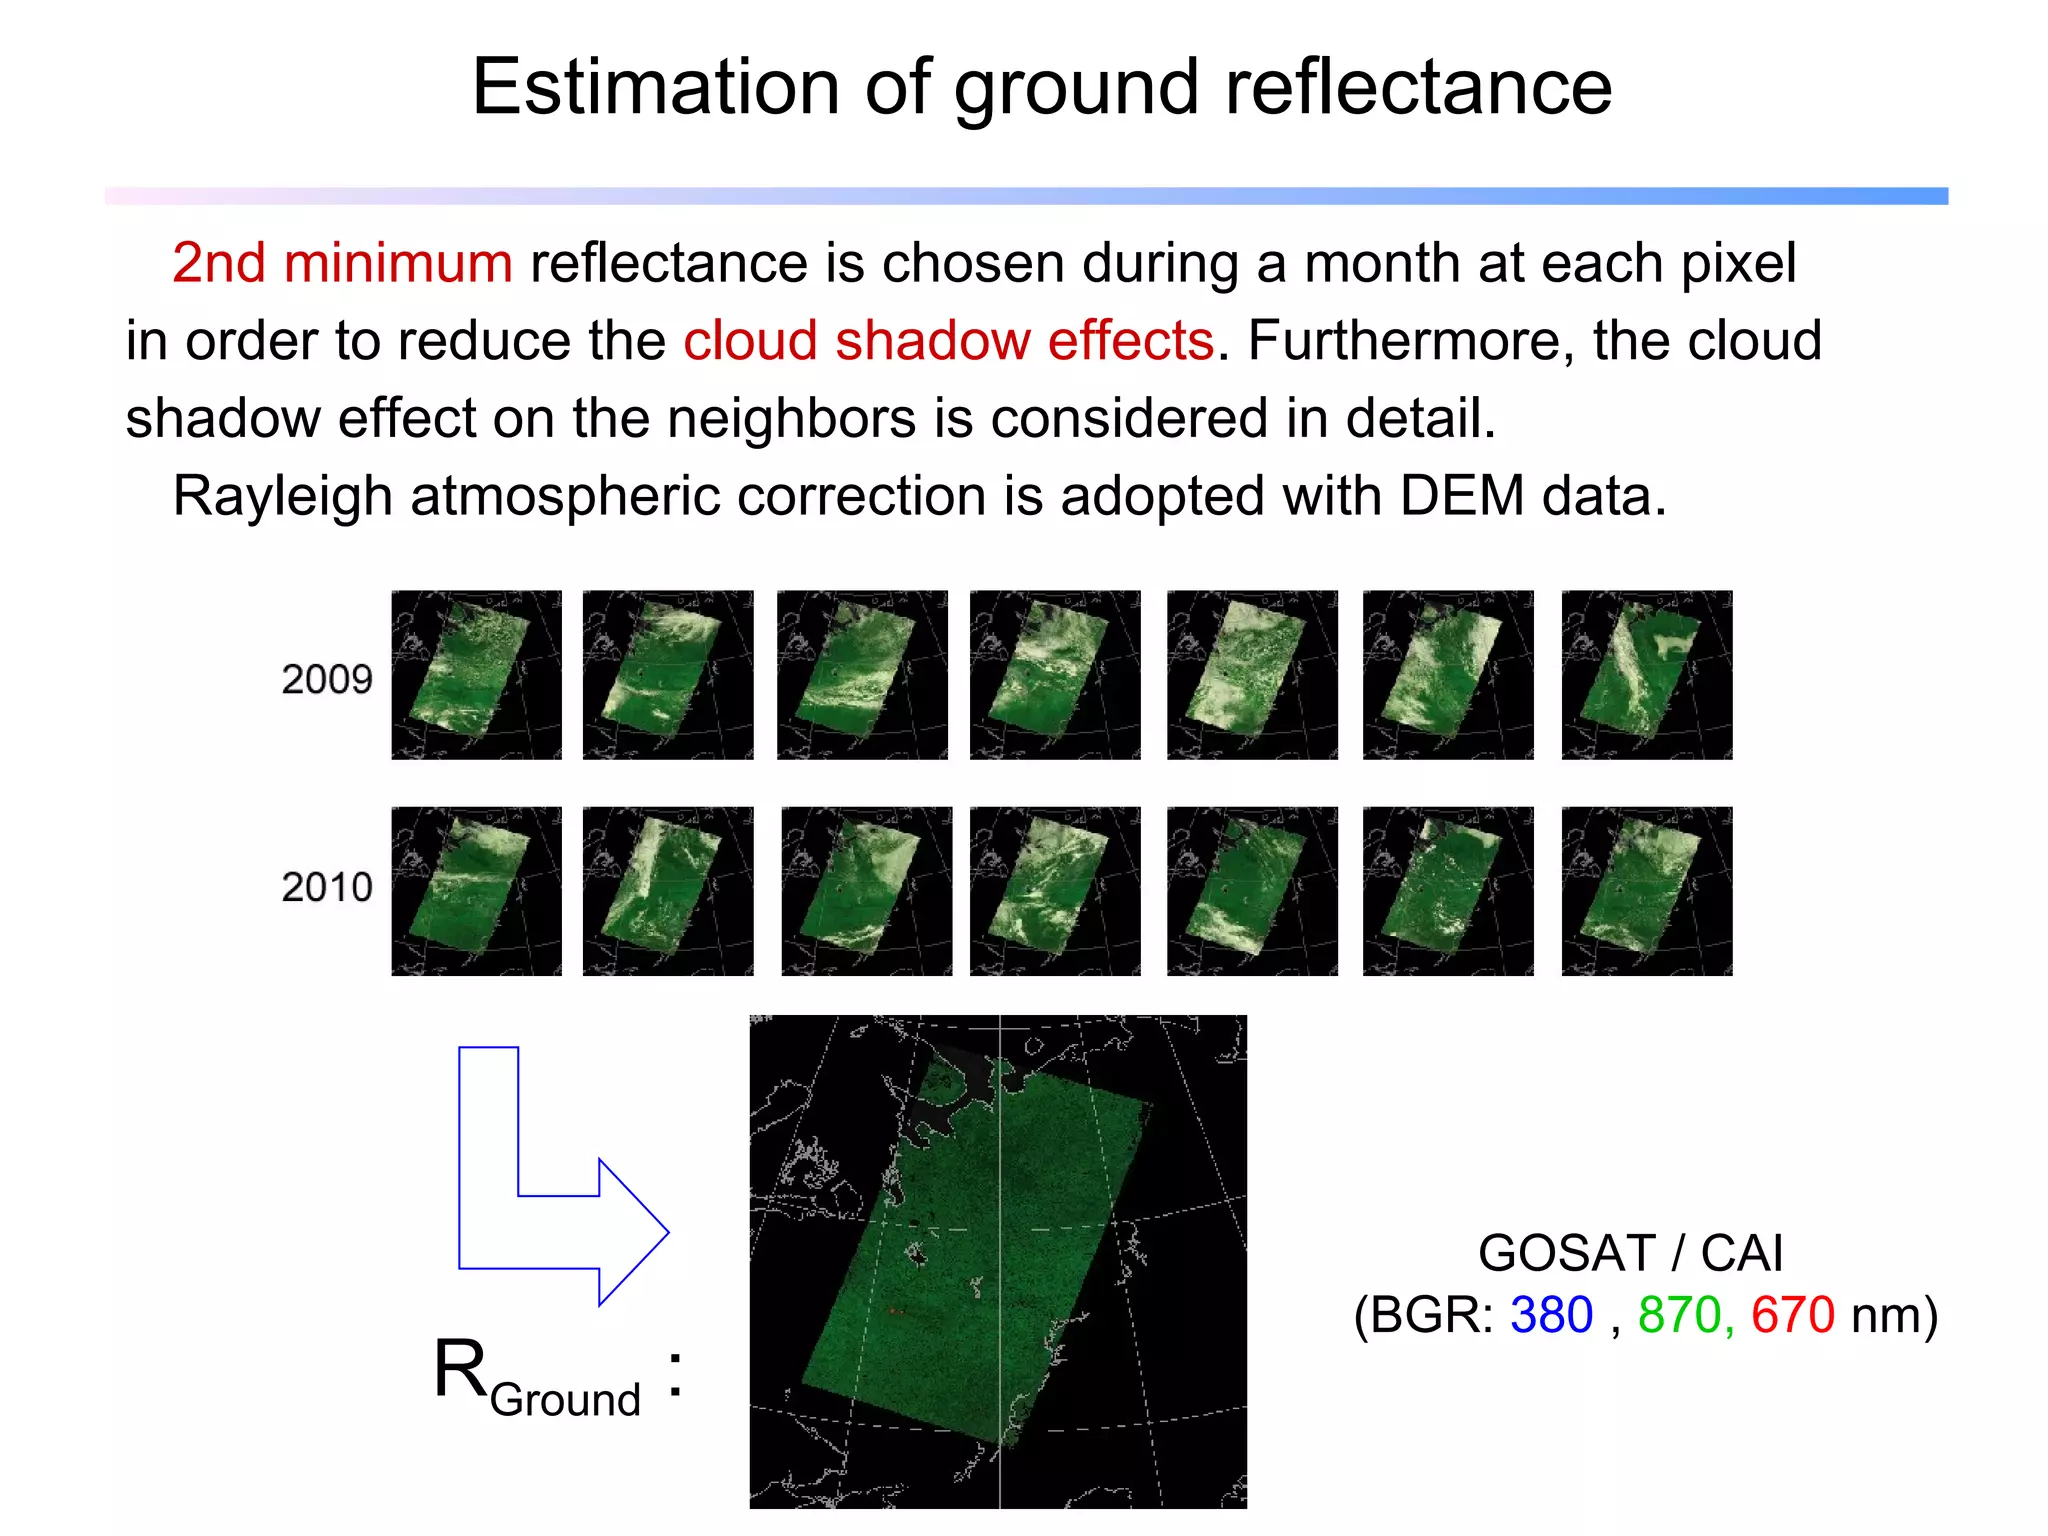
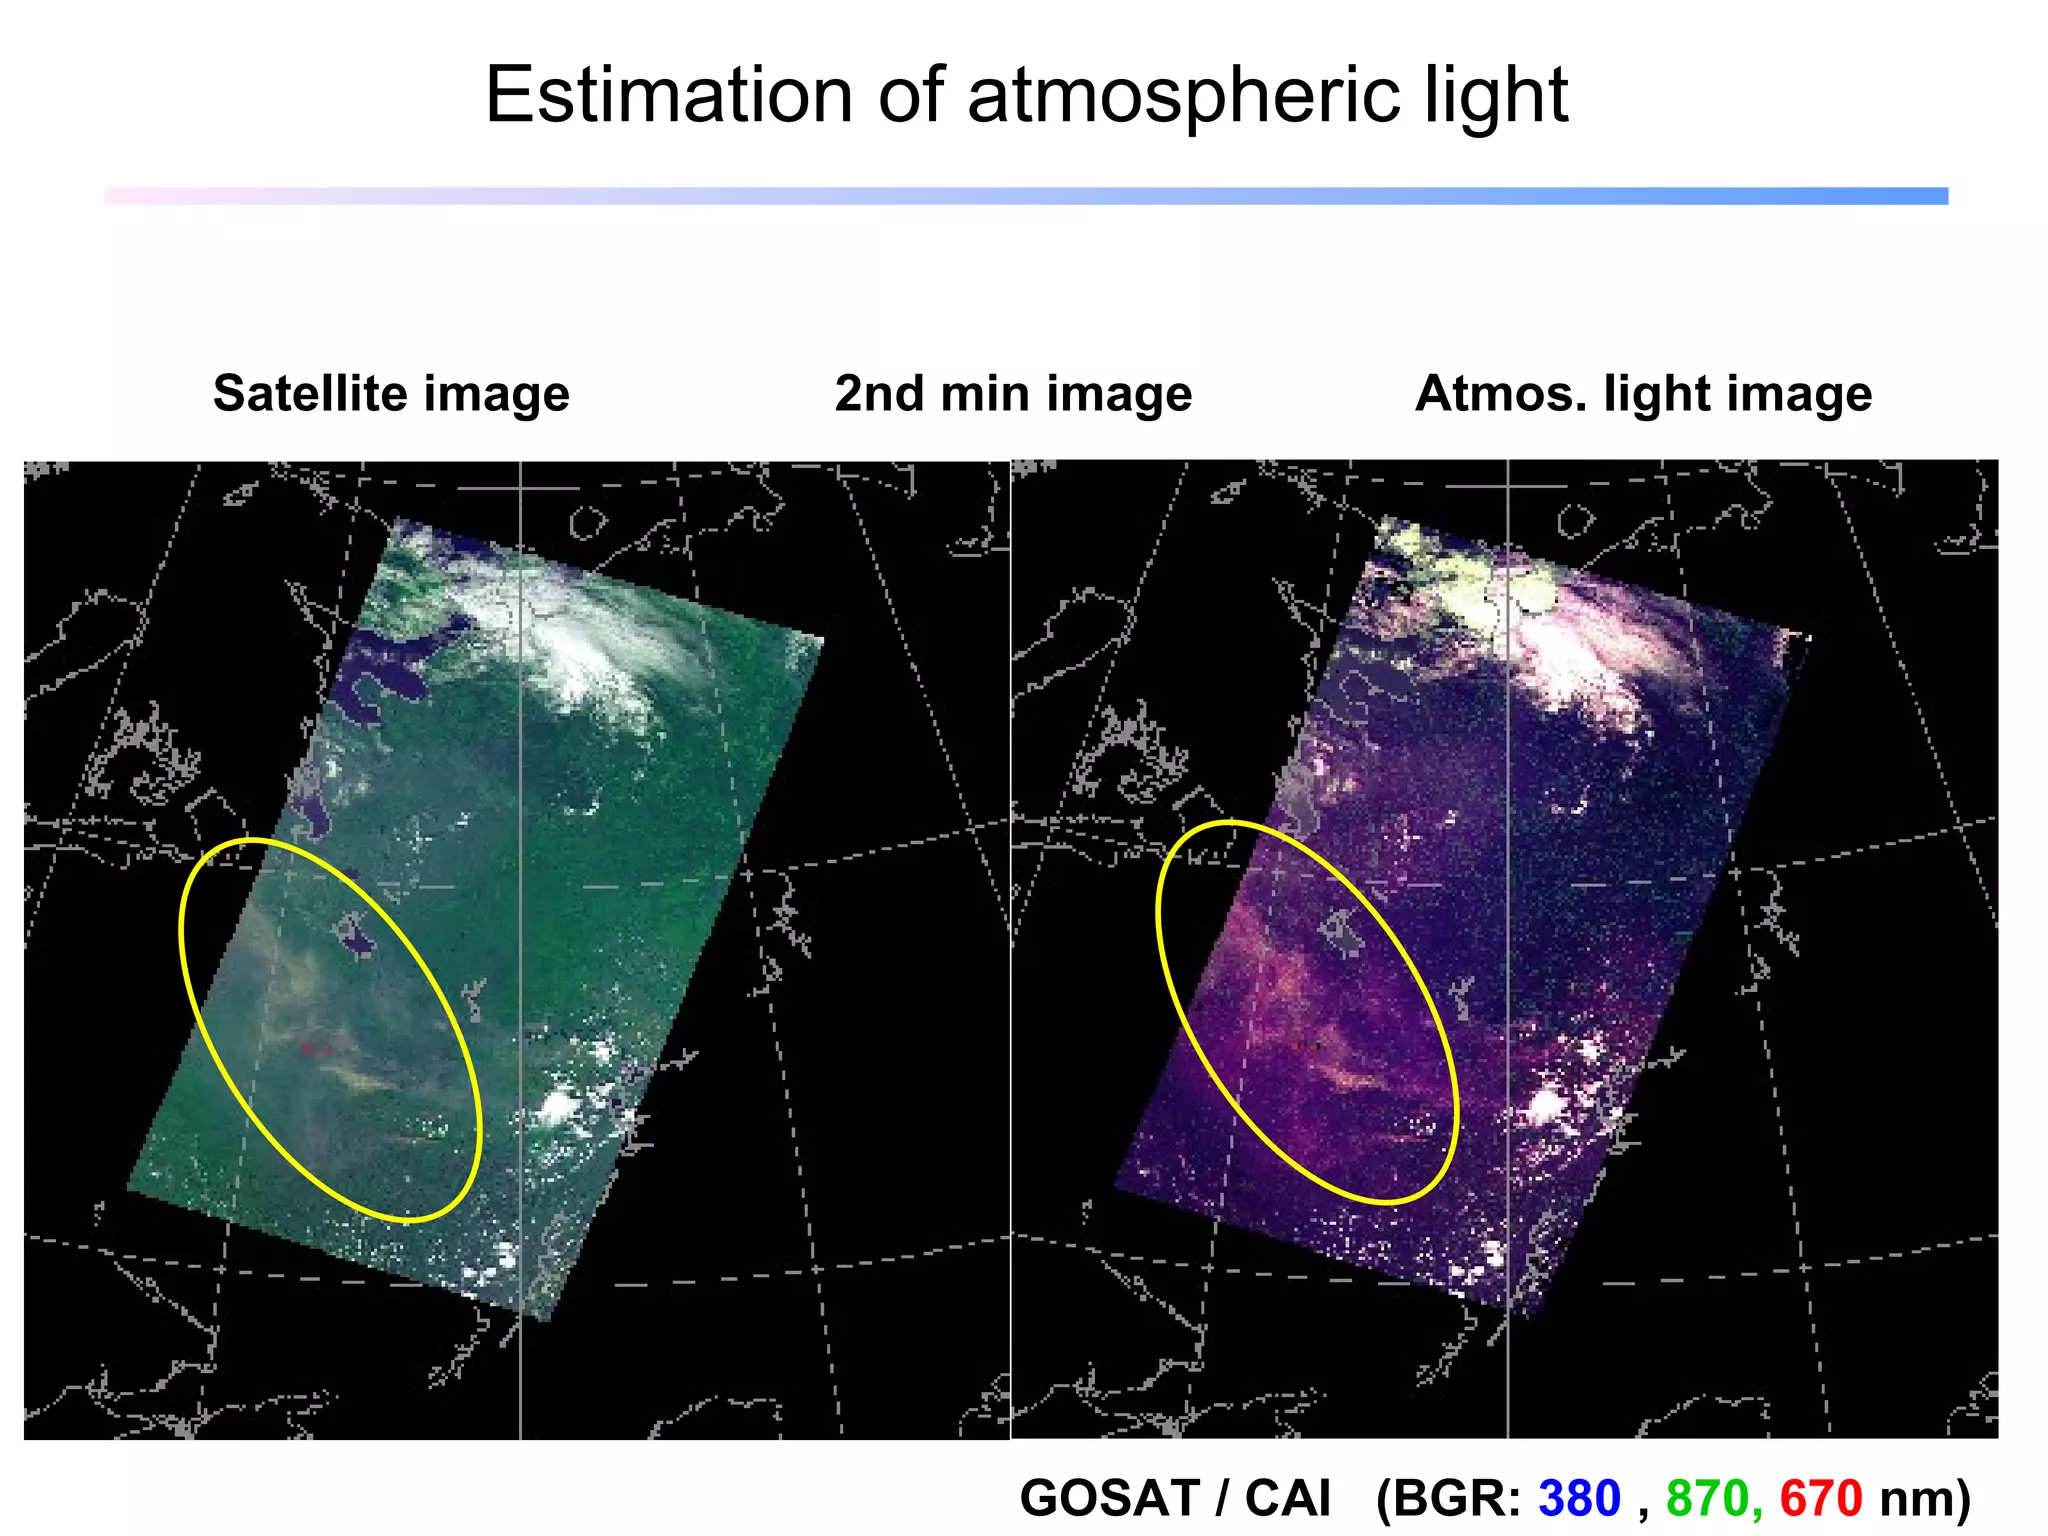
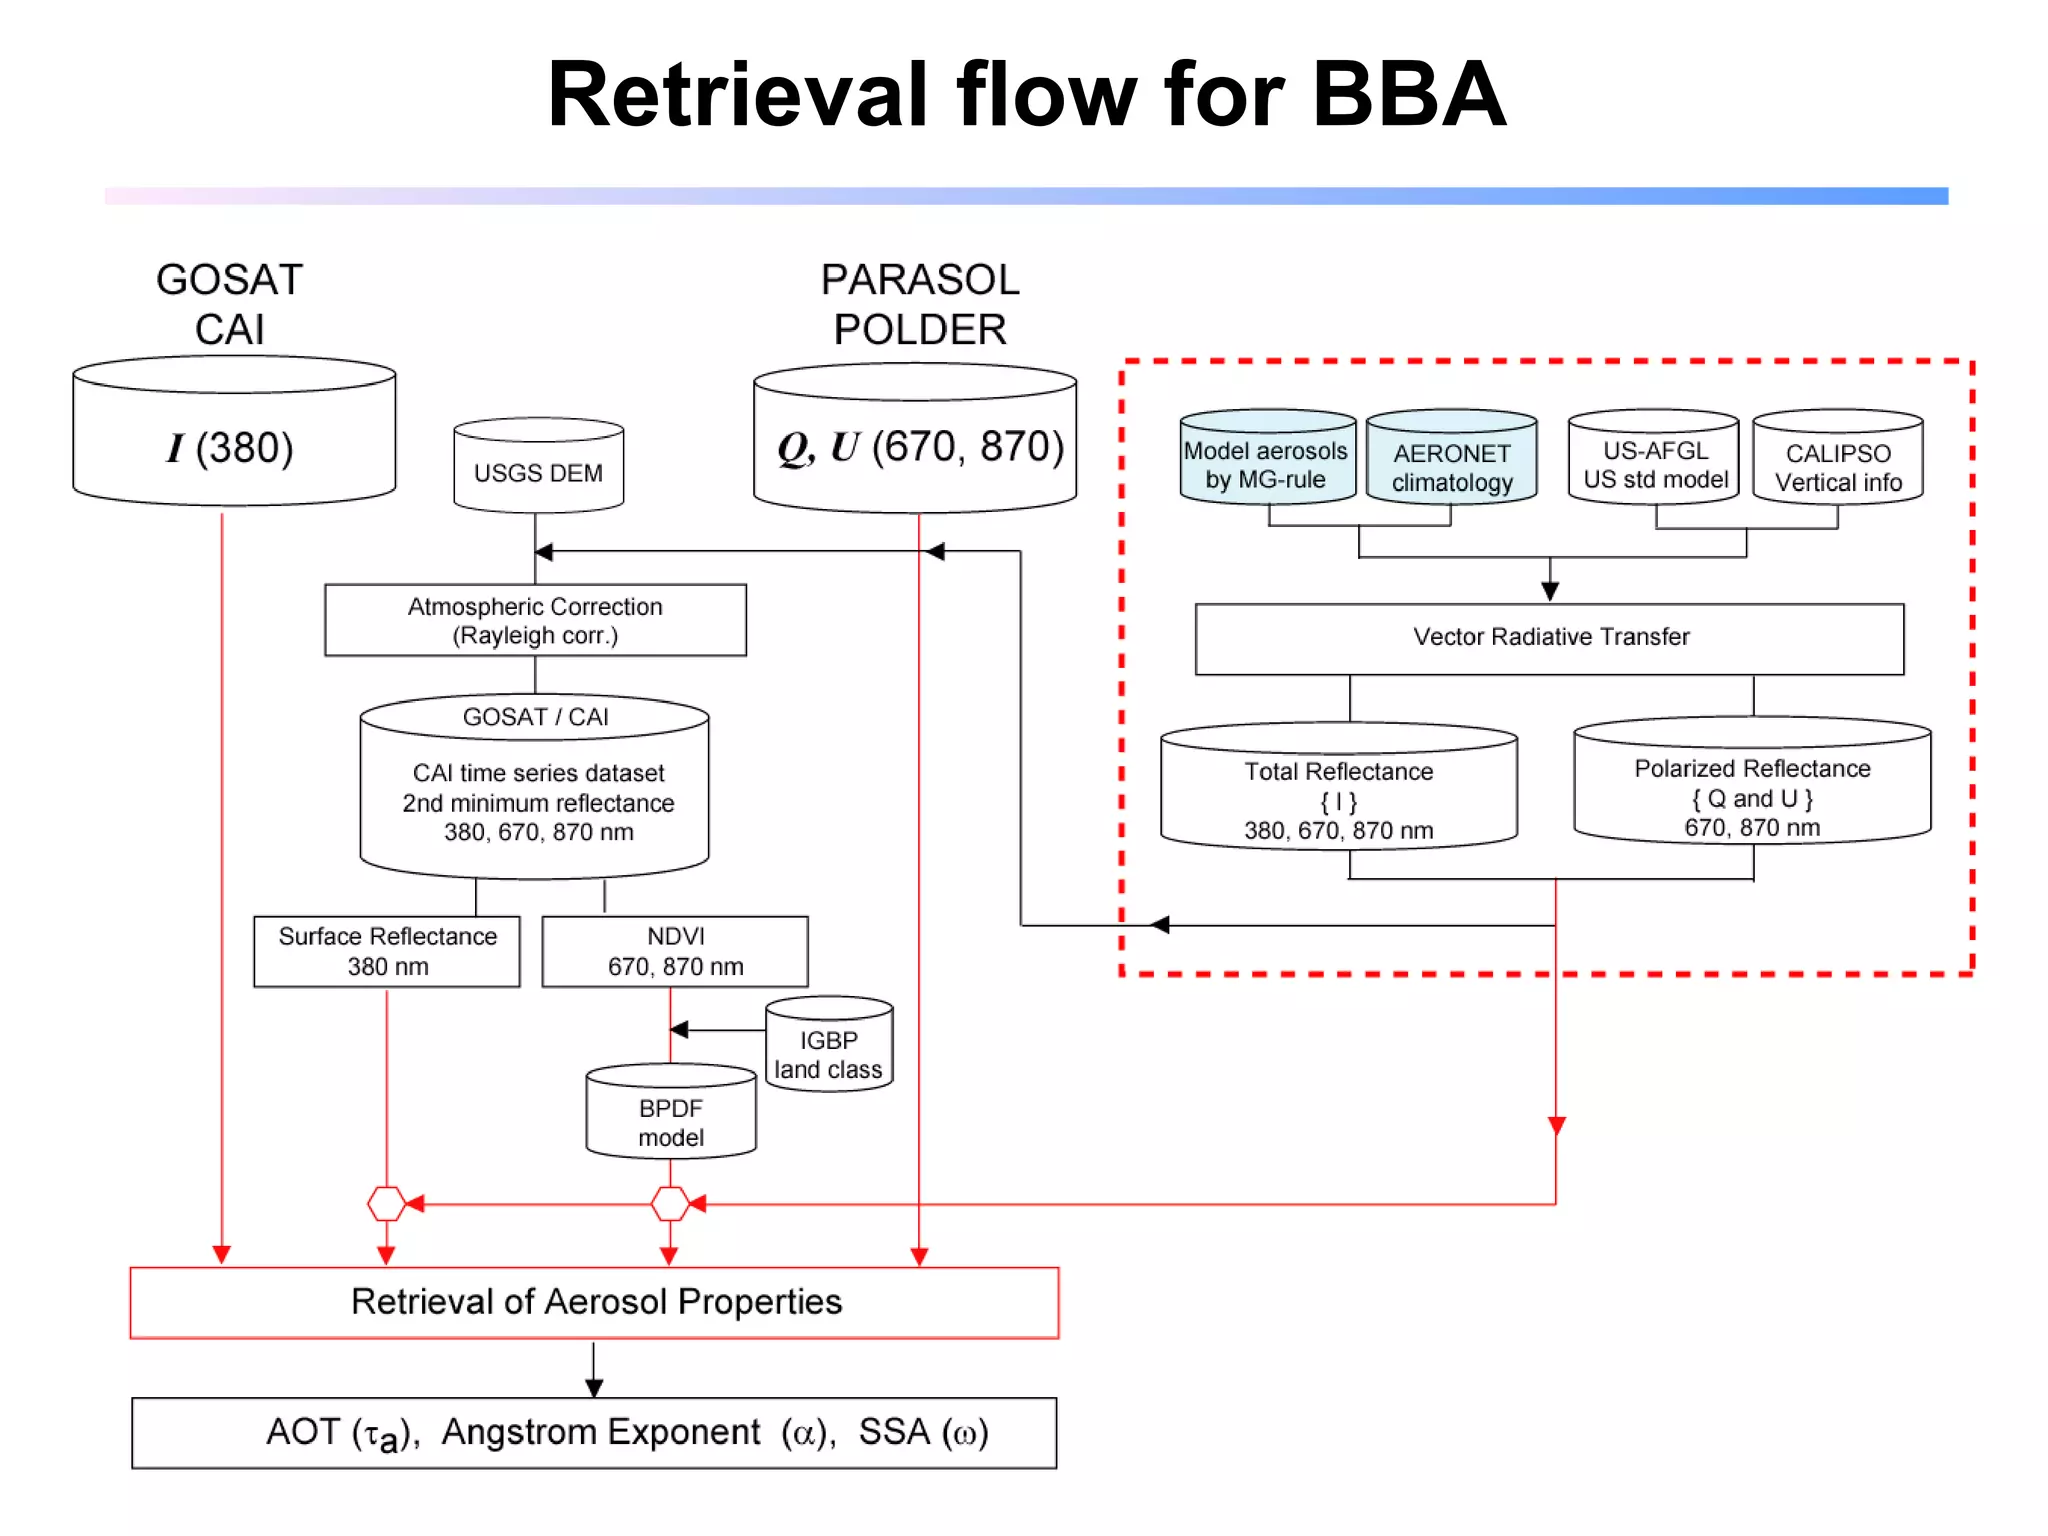
The document presents a method to retrieve properties of biomass burning aerosols using a combination of near-UV radiance measurements from the GOSAT/CAI sensor and near-IR polarimetry measurements from the PARASOL/POLDER sensor. The method involves estimating ground reflectance, atmospheric light, aerosol models using refractive indices, vertical aerosol profiles from CALIPSO data, and retrieving aerosol optical thickness, Angstrom exponent and single scattering albedo. Validation with AERONET data shows the retrieved aerosol optical thickness and Angstrom exponent values match partially. The method demonstrates the biomass burning aerosol properties vary over plumes with optical depth and Angstrom exponent
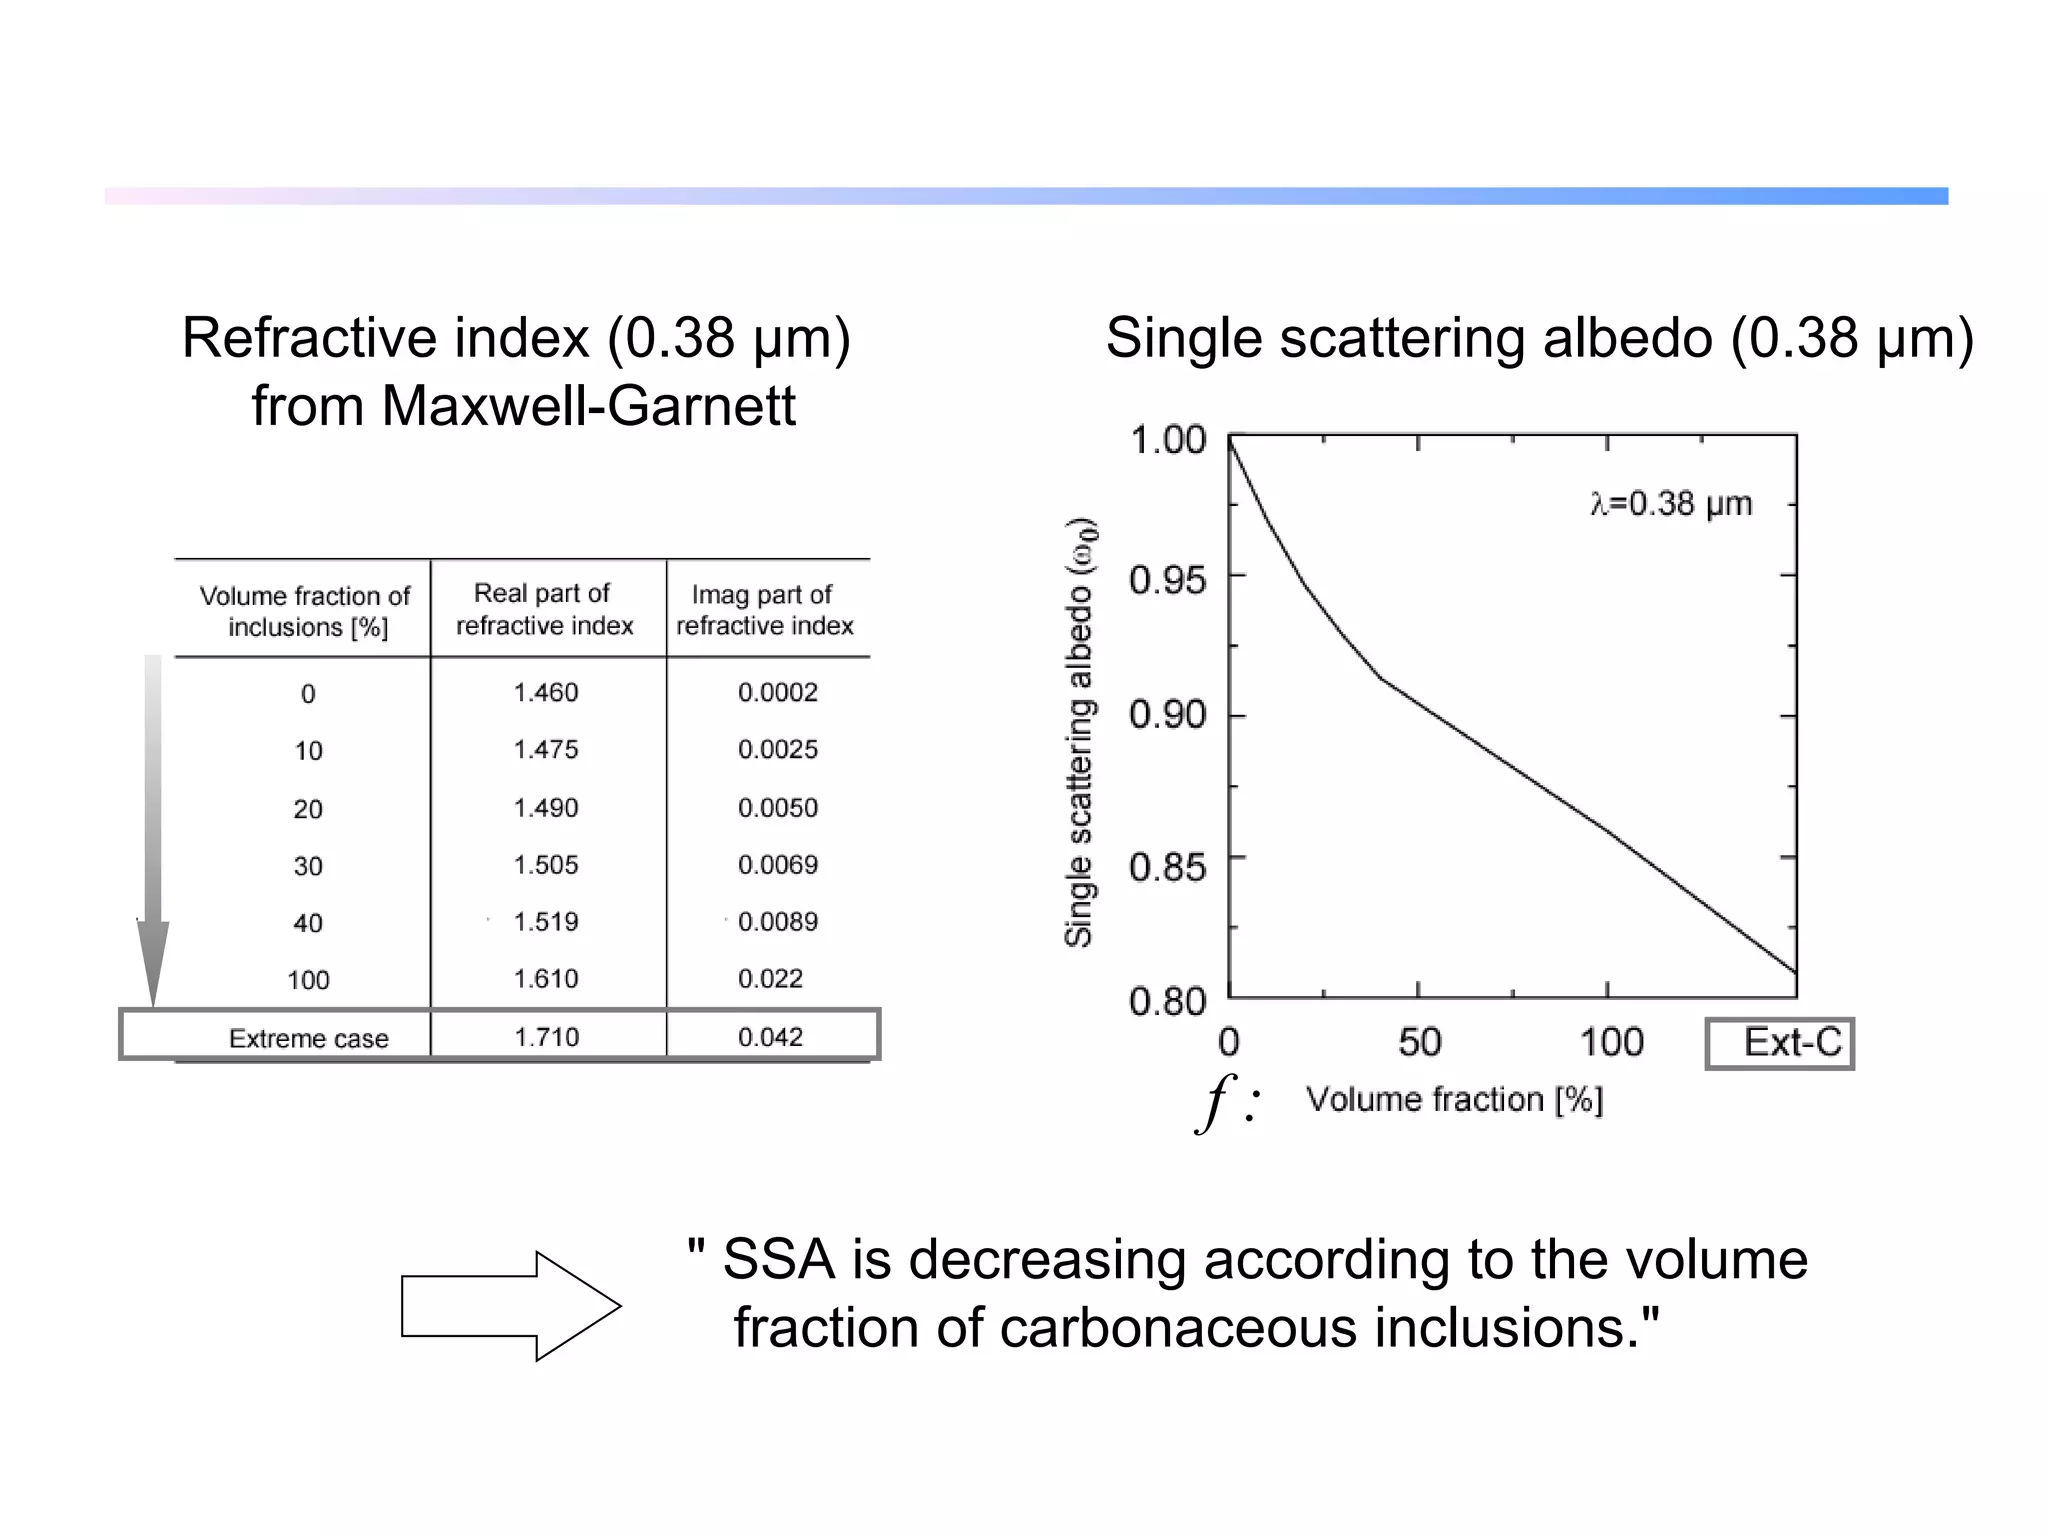
![Aerosol model : carbonaceous aerosols Heterogeneous particles should be considered for carbonaceous aerosols. Heterogeneous particles is approximately interpreted by using the refractive index calculated by Maxwell-Garnett mixing rule . ex) Matrix : m =1.46 - 0.0002 i Inclusions: m =1.61 - 0.022 i measurements value for carbon Matrix Inclusions f [%] : volume fraction of inclusions against matrix](https://image.slidesharecdn.com/sano-igarss2011-110729112150-phpapp01/75/Sano_IGARSS2011-ppt-10-2048.jpg)