Promising business cases for rice smallholders for income increasing and climate smart
interventions, Version 2
Han Soethoudt, Jan Broeze, Heike Axmann
May 2021
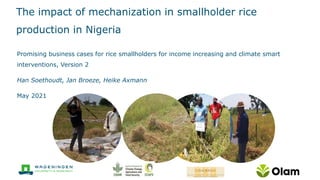
The impact of mechanization in smallholder rice
production in Nigeria
Background
Company : Olam
Region case study: Nigeria
Rice Farmers Olam: 66,000 (≈ 50% in Nigeria)
Product : Rice
Topic: food loss reduction, increase farmer profit, decrease
greenhous gas emissions
Rice loss reduction pilot Nigeria: intervention
analysis in rice harvest, threshing (and
winnowing)
Goal: analyse the impact on food loss and farmer profit and
greenhouse gas emissions
1. when switching from manually to mechanised rice harvesting
2. when switching from manually to mechanised rice threshing
Pilot set up: Harvest
• 5 farmers were selected
• each farmer marked 6 pieces of land of 24m2: 3 for manual harvesting and 3
for mechanised harvesting with a reaper
• weighing (using digital scale) of:
o harvested material (plant material + paddy) (before drying)
o paddy left on soil in harvested piece of land
o harvested material (plant material + paddy) (after drying)
o mechanically threshed paddy
• moisture content measurement of paddy before and after drying
Pilot set up: Threshing (and winnowing)
• same 5 farmers were selected
• each farmer marked 6 pieces of land of 24m2 for manual harvesting
• 3 harvested volumes were manually threshed as usual and the other 3 were
mechanically threshed
• weighing (using digital scale) of:
o harvested material (plant material + paddy) (after drying)
o mechanically threshed paddy
• winnowing was included (integrated in mechanised threshing) and assumed
to have no significant loss (according to Olam experts)
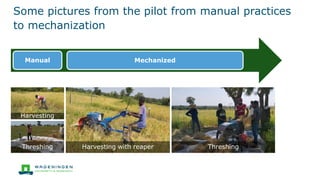
Harvesting
Threshing Harvesting with reaper Threshing
Some pictures from the pilot from manual practices
to mechanization
Manual Mechanized
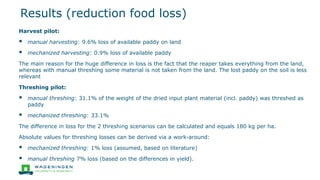
Results (reduction food loss)
Harvest pilot:
▪ manual harvesting: 9.6% loss of available paddy on land
▪ mechanized harvesting: 0.9% loss of available paddy
The main reason for the huge difference in loss is the fact that the reaper takes everything from the land,
whereas with manual threshing some material is not taken from the land. The lost paddy on the soil is less
relevant
Threshing pilot:
▪ manual threshing: 31.1% of the weight of the dried input plant material (incl. paddy) was threshed as
paddy
▪ mechanized threshing: 33.1%
The difference in loss for the 2 threshing scenarios can be calculated and equals 180 kg per ha.
Absolute values for threshing losses can be derived via a work-around:
▪ mechanized threshing: 1% loss (assumed, based on literature)
▪ manual threshing 7% loss (based on the differences in yield).
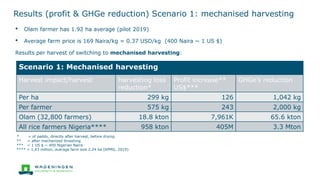
Results (profit & GHGe reduction) Scenario 1: mechanised harvesting
• Olam farmer has 1.92 ha average (pilot 2019)
• Average farm price is 169 Naira/kg = 0.37 USD/kg (400 Naira ~ 1 US $)
Results per harvest of switching to mechanised harvesting:
* = of paddy, directly after harvest, before drying
** = after mechanized threshing
*** = 1 US $ ~ 400 Nigerian Naira
**** = 1,43 million, average farm size 2.24 ha (KPMG, 2019)
Scenario 1: Mechanised harvesting
Harvest impact/harvest Harvesting loss
reduction*
Profit increase**
US$***
GHGe’s reduction
Per ha 299 kg 126 1,042 kg
Per farmer 575 kg 243 2,000 kg
Olam (32,800 farmers) 18.8 kton 7,961K 65.6 kton
All rice farmers Nigeria**** 958 kton 405M 3.3 Mton
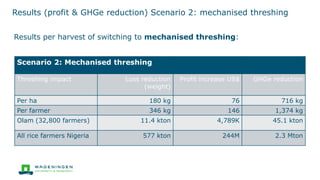
Results (profit & GHGe reduction) Scenario 2: mechanised threshing
Results per harvest of switching to mechanised threshing:
Scenario 2: Mechanised threshing
Threshing impact Loss reduction
(weight)
Profit increase US$ GHGe reduction
Per ha 180 kg 76 716 kg
Per farmer 346 kg 146 1,374 kg
Olam (32,800 farmers) 11.4 kton 4,789K 45.1 kton
All rice farmers Nigeria 577 kton 244M 2.3 Mton
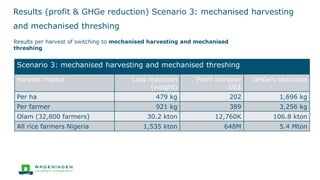
Results (profit & GHGe reduction) Scenario 3: mechanised harvesting
and mechanised threshing
Results per harvest of switching to mechanised harvesting and mechanised
threshing
Scenario 3: mechanised harvesting and mechanised threshing
Harvest impact Loss reduction
(weight)
Profit increase
US$
GHGe’s reduction
Per ha 479 kg 202 1,696 kg
Per farmer 921 kg 389 3,256 kg
Olam (32,800 farmers) 30.2 kton 12,760K 106.8 kton
All rice farmers Nigeria 1,535 kton 648M 5.4 Mton
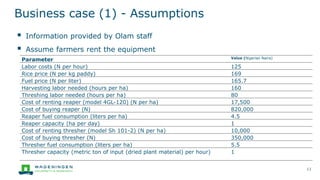
Business case (1) - Assumptions
▪ Information provided by Olam staff
▪ Assume farmers rent the equipment
11
Parameter Value (Nigerian Naira)
Labor costs (N per hour) 125
Rice price (N per kg paddy) 169
Fuel price (N per liter) 165.7
Harvesting labor needed (hours per ha) 160
Threshing labor needed (hours per ha) 80
Cost of renting reaper (model 4GL-120) (N per ha) 17,500
Cost of buying reaper (N) 820,000
Reaper fuel consumption (liters per ha) 4.5
Reaper capacity (ha per day) 1
Cost of renting thresher (model Sh 101-2) (N per ha) 10,000
Cost of buying thresher (N) 350,000
Thresher fuel consumption (liters per ha) 5.5
Thresher capacity (metric ton of input (dried plant material) per hour) 1
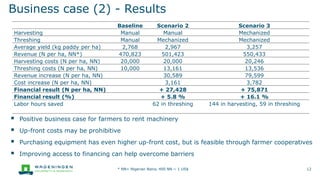
Business case (2) - Results
▪ Positive business case for farmers to rent machinery
▪ Up-front costs may be prohibitive
▪ Purchasing equipment has even higher up-front cost, but is feasible through farmer cooperatives
▪ Improving access to financing can help overcome barriers
* NN= Nigerian Naira, 400 NN ~ 1 US$ 12
Baseline Scenario 2 Scenario 3
Harvesting Manual Manual Mechanized
Threshing Manual Mechanized Mechanized
Average yield (kg paddy per ha) 2,768 2,967 3,257
Revenue (N per ha, NN*) 470,823 501,423 550,433
Harvesting costs (N per ha, NN) 20,000 20,000 20,246
Threshing costs (N per ha, NN) 10,000 13,161 13,536
Revenue increase (N per ha, NN) 30,589 79,599
Cost increase (N per ha, NN) 3,161 3,782
Financial result (N per ha, NN) + 27,428 + 75,871
Financial result (%) + 5.8 % + 16.1 %
Labor hours saved 62 in threshing 144 in harvesting, 59 in threshing
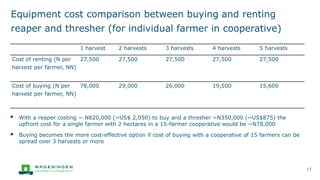
Equipment cost comparison between buying and renting
reaper and thresher (for individual farmer in cooperative)
▪ With a reaper costing ~ N820,000 (~US$ 2,050) to buy and a thresher ~N350,000 (~US$875) the
upfront cost for a single farmer with 2 hectares in a 15-farmer cooperative would be ~N78,000
▪ Buying becomes the more cost-effective option if cost of buying with a cooperative of 15 farmers can be
spread over 3 harvests or more
13
1 harvest 2 harvests 3 harvests 4 harvests 5 harvests
Cost of renting (N per
harvest per farmer, NN)
27,500 27,500 27,500 27,500 27,500
Cost of buying (N per
harvest per farmer, NN)
78,000 29,000 26,000 19,500 15,600
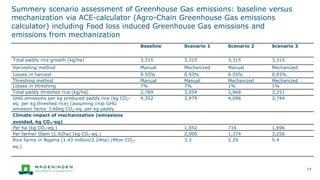
Summery scenario assessment of Greenhouse Gas emissions: baseline versus
mechanization via ACE-calculator (Agro-Chain Greenhouse Gas emissions
calculator) including Food loss induced Greenhouse Gas emissions and
emissions from mechanization
14
Baseline Scenario 1 Scenario 2 Scenario 3
Total paddy rice growth (kg/ha) 3,315 3,315 3,315 3,315
Harvesting method Manual Mechanized Manual Mechanized
Losses in harvest 9.55% 0.93% 9.55% 0.93%
Threshing method Manual Manual Mechanized Mechanized
Losses in threshing 7% 7% 1% 1%
Total paddy threshed rice (kg/ha) 2,789 3,054 2,968 3,251
GHG emissions per kg produced paddy rice (kg CO2-
eq. per kg threshed rice) (assuming crop GHG
emission factor 3.66kg CO2-eq. per kg paddy
4,352 3,979 4,096 3,744
Climate impact of mechanization (emissions
avoided, kg CO2-eq)
Per ha (kg CO2-eq.) 1,042 716 1,696
Per farmer Olam (1.92ha) (kg CO2-eq.) 2,000 1,374 3,256
Rice farms in Nigeria (1.43 million/2.24ha) (Mton CO2-
eq.)
3.3 2.29 5.4
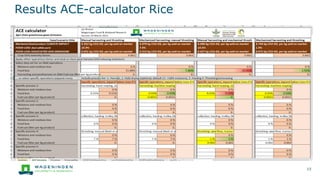
Results ACE-calculator Rice
15
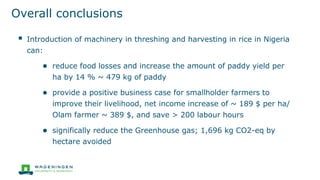
Overall conclusions
▪ Introduction of machinery in threshing and harvesting in rice in Nigeria
can:
● reduce food losses and increase the amount of paddy yield per
ha by 14 % ~ 479 kg of paddy
● provide a positive business case for smallholder farmers to
improve their livelihood, net income increase of ~ 189 $ per ha/
Olam farmer ~ 389 $, and save > 200 labour hours
● significally reduce the Greenhouse gas; 1,696 kg CO2-eq by
hectare avoided
* 400 Naira ~ 1 US $
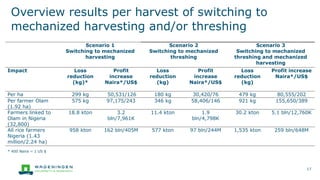
Overview results per harvest of switching to
mechanized harvesting and/or threshing
17
Scenario 1
Switching to mechanized
harvesting
Scenario 2
Switching to mechanized
threshing
Scenario 3
Switching to mechanized
threshing and mechanized
harvesting
Impact Loss
reduction
(kg)*
Profit
increase
Naira*/US$
Loss
reduction
(kg)
Profit
increase
Naira*/US$
Loss
reduction
(kg)
Profit increase
Naira*/US$
Per ha 299 kg 50,531/126 180 kg 30,420/76 479 kg 80,555/202
Per farmer Olam
(1.92 ha)
575 kg 97,175/243 346 kg 58,406/146 921 kg 155,650/389
Farmers linked to
Olam in Nigeria
(32,800)
18.8 kton 3.2
bln/7,961K
11.4 kton 1.9
bln/4,798K
30.2 kton 5.1 bln/12,760K
All rice farmers
Nigeria (1.43
million/2.24 ha)
958 kton 162 bln/405M 577 kton 97 bln/244M 1,535 kton 259 bln/648M
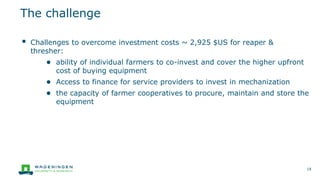
▪ Challenges to overcome investment costs ~ 2,925 $US for reaper &
thresher:
● ability of individual farmers to co-invest and cover the higher upfront
cost of buying equipment
● Access to finance for service providers to invest in mechanization
● the capacity of farmer cooperatives to procure, maintain and store the
equipment
The challenge
18
Thank you
contact information:
heike.axmann@wur.nl
19
DISCLAIMERS:
This work was implemented as part of the CGIAR Research Program on Climate Change, Agriculture and Food Security (CCAFS), which is carried
out with support from the CGIAR Trust Fund and through bilateral funding agreements. For details please visit https://ccafs.cgiar.org/donors.
The views expressed in this document cannot be taken to reflect the official opinions of these organizations.
Estimate your food products’ climate impact through our ACGE calculator
https://ccafs.cgiar.org/agro-chain-greenhouse-gas-emissions-acge-calculator
Acknowledgement: this work is financially supported via Climate Change, Agriculture and Food Security (CCAFS), the
Consortium for Innovation in Post-Harvest Loss & Food Waste Reduction, and Olam International who supported the food loss
data collection for this study.