Downloaded 153 times
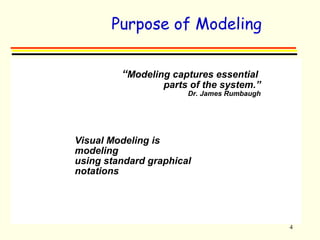
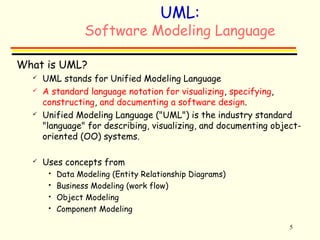
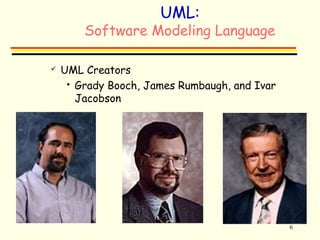

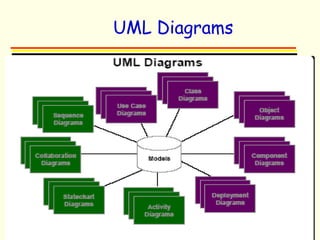

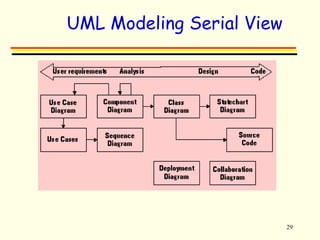
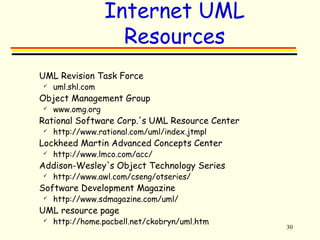

This document provides an introduction to using the Unified Modeling Language (UML) for object-oriented design and modeling. It describes UML as a standard language for visualizing, specifying, and documenting software designs using concepts from data, business, object, and component modeling. The document outlines the history and creators of UML, the different types of UML diagrams for modeling various aspects of systems, and internet resources for further information on UML.