Downloaded 246 times


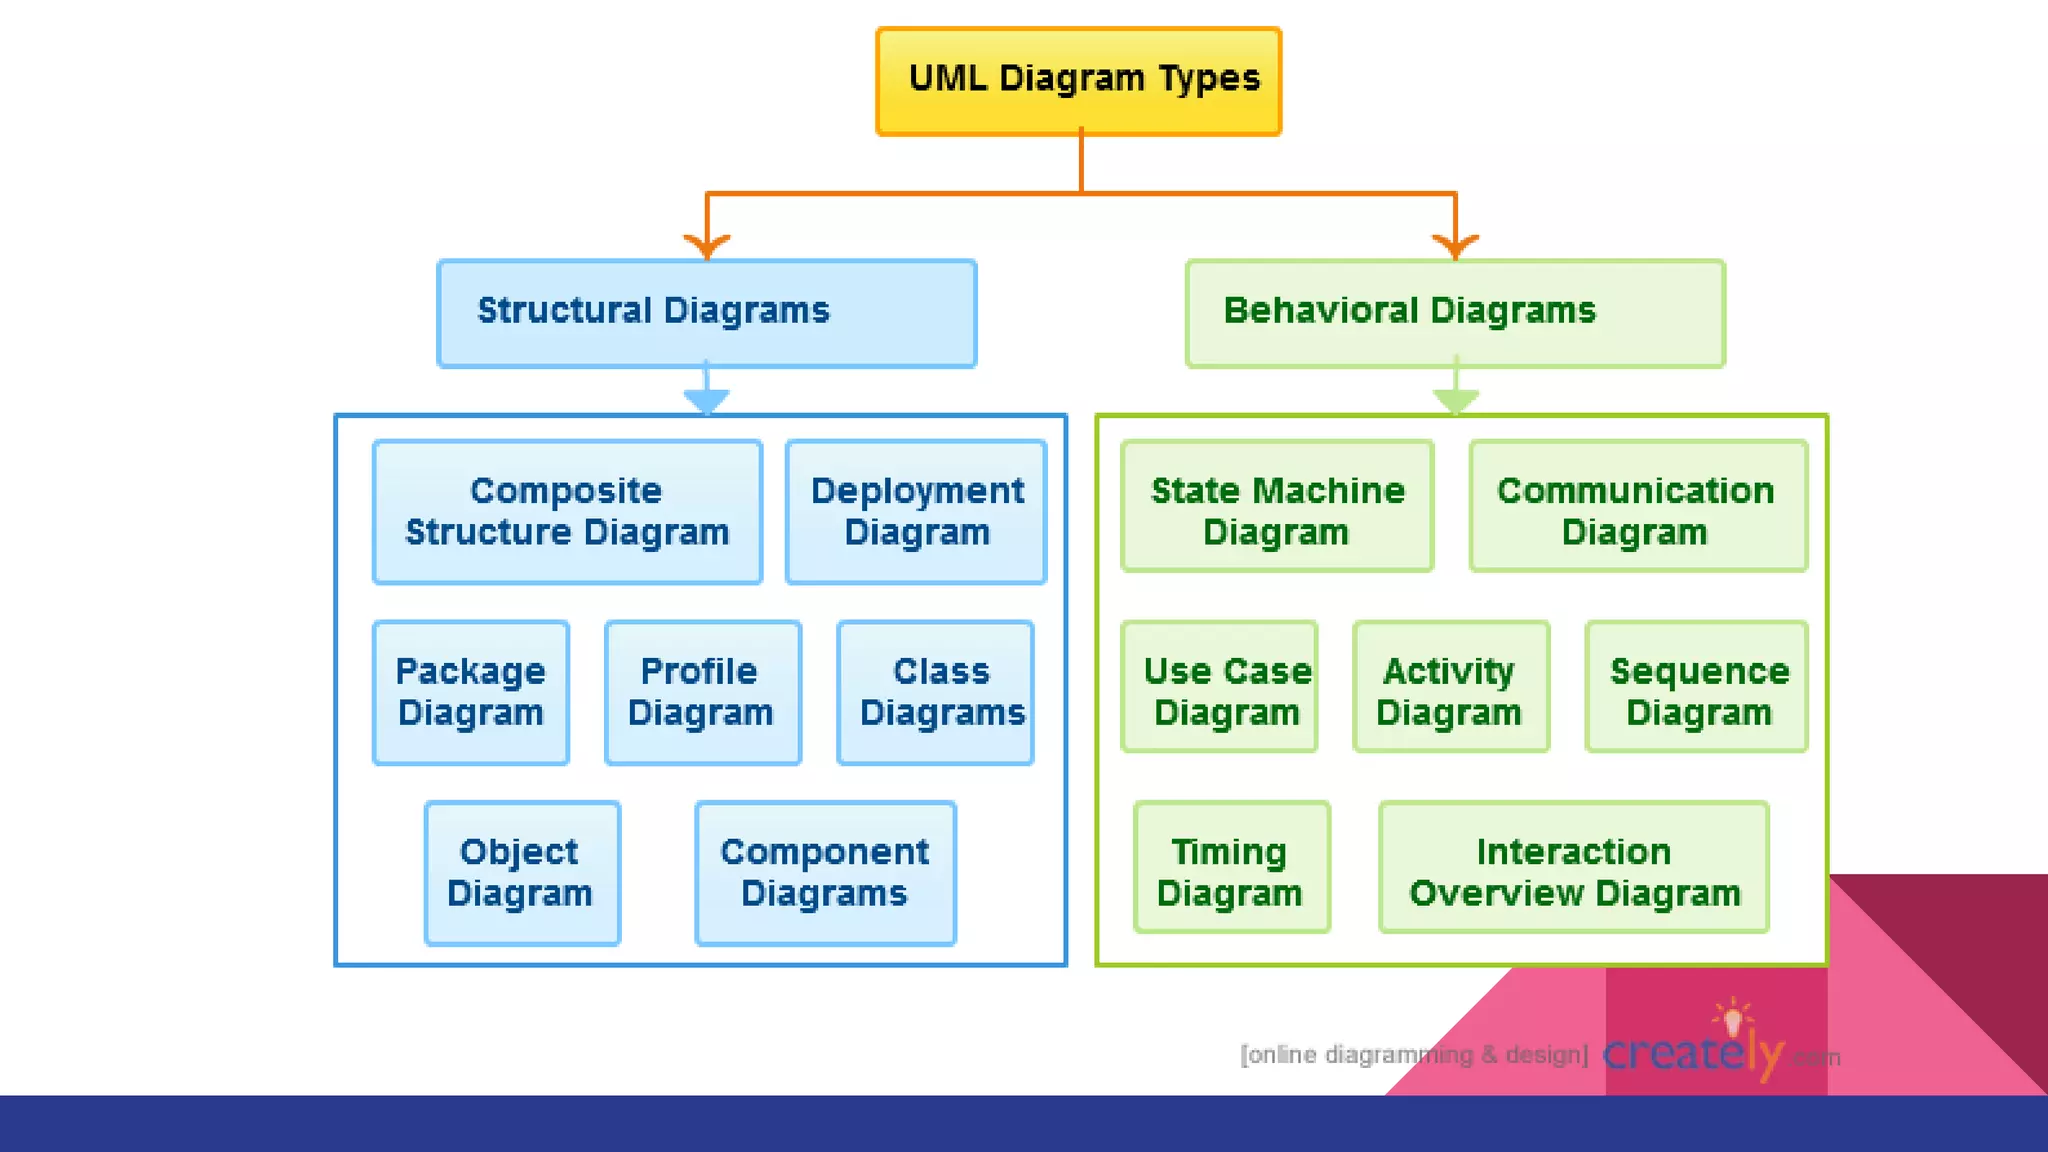
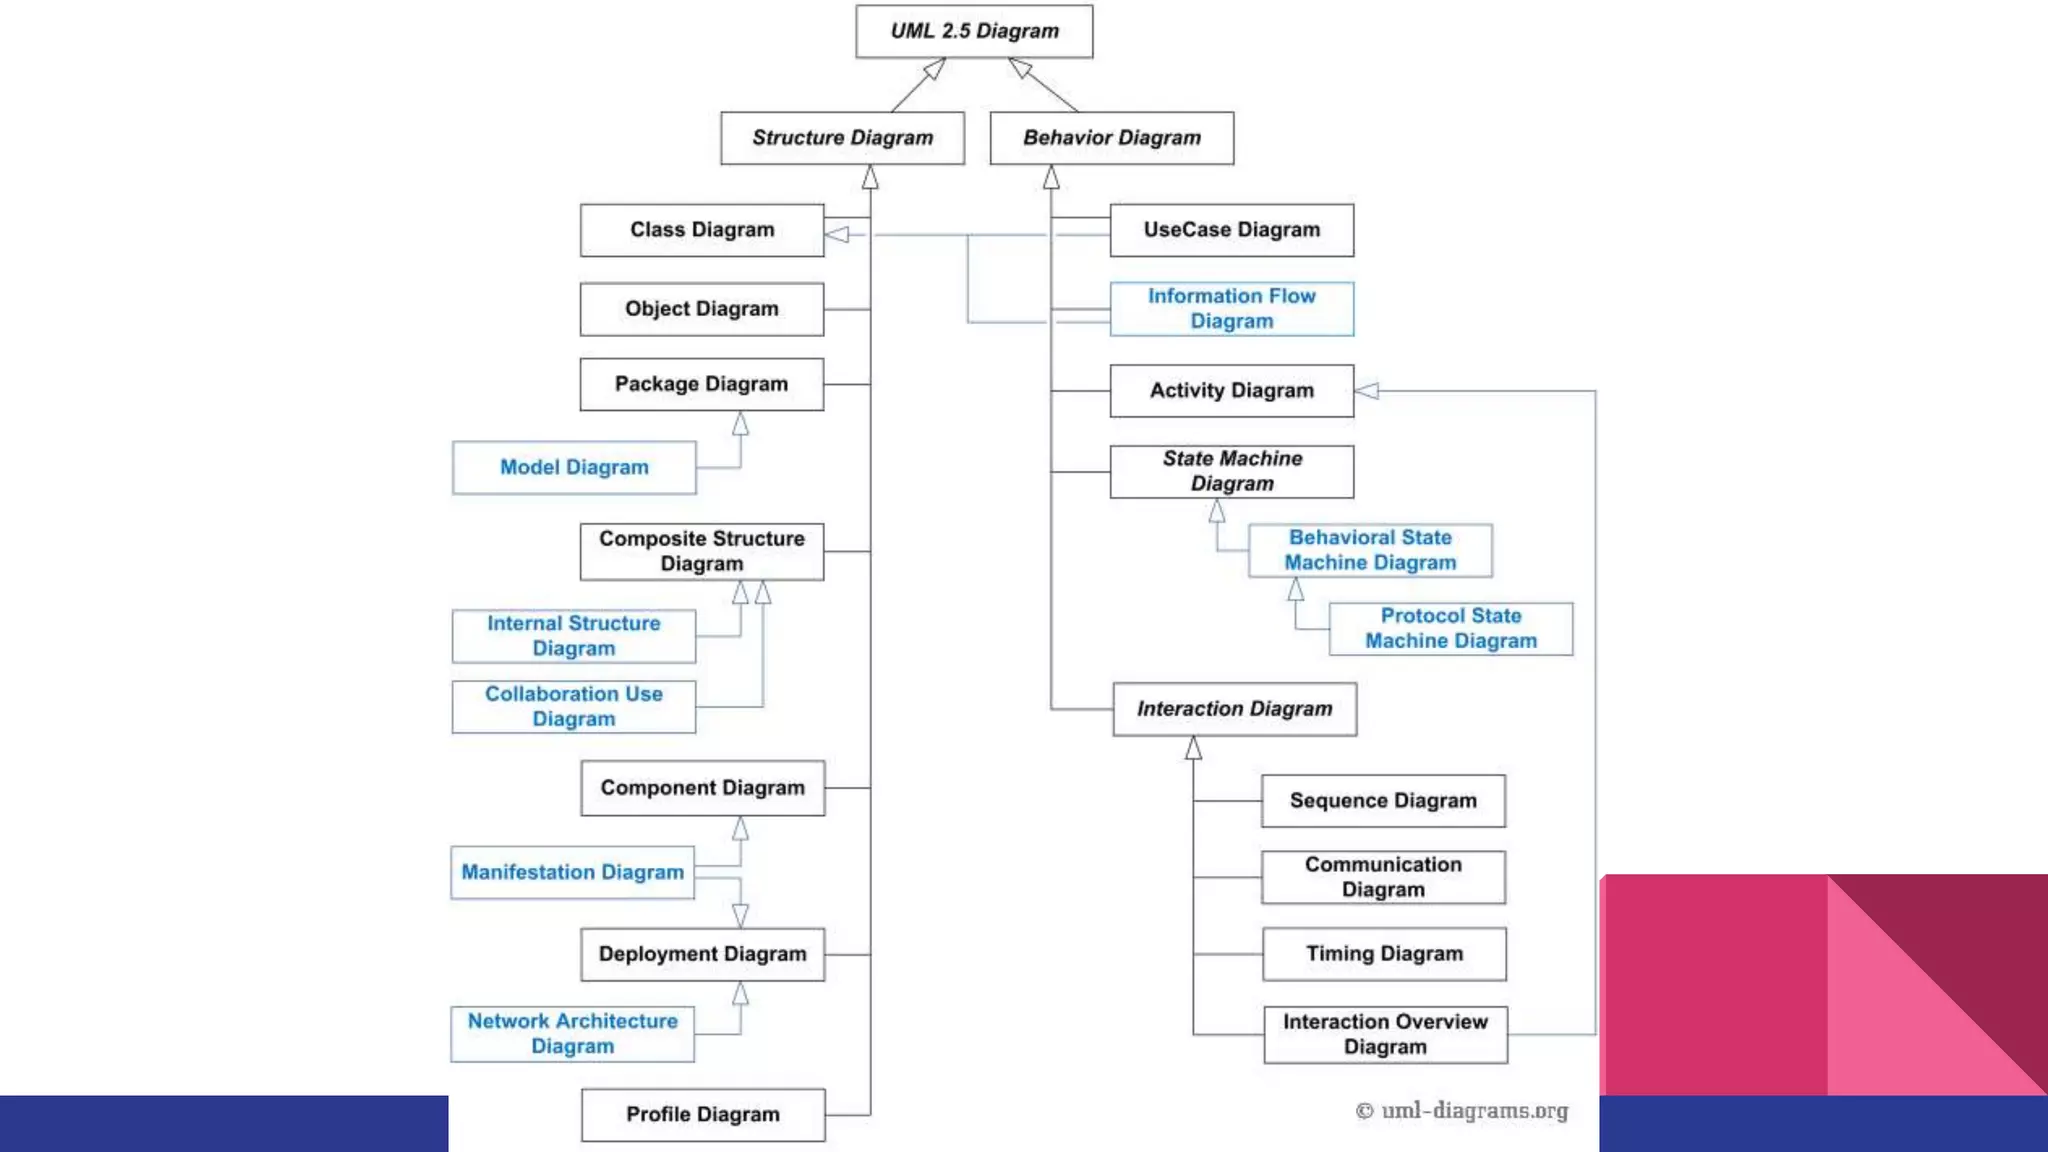


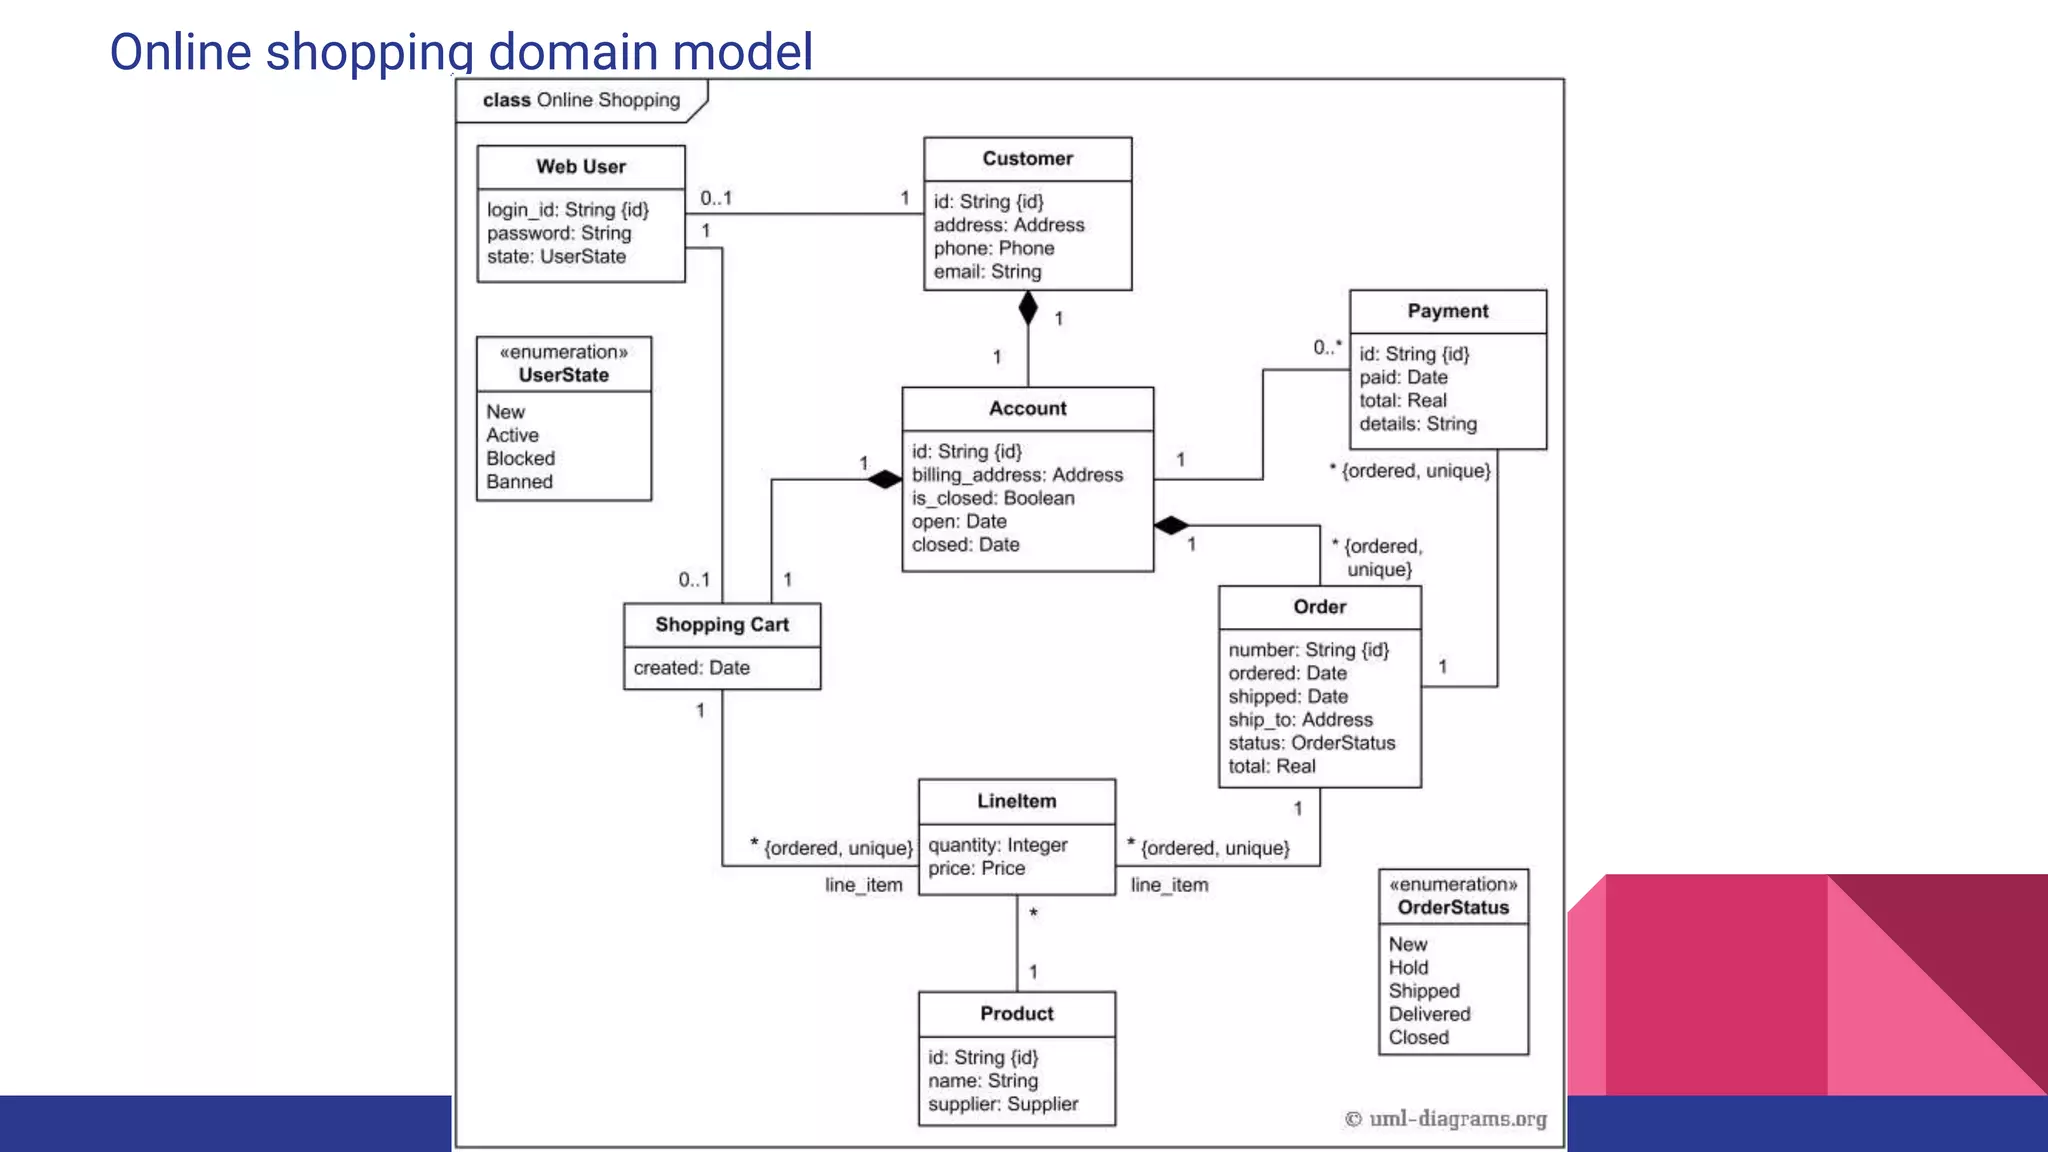
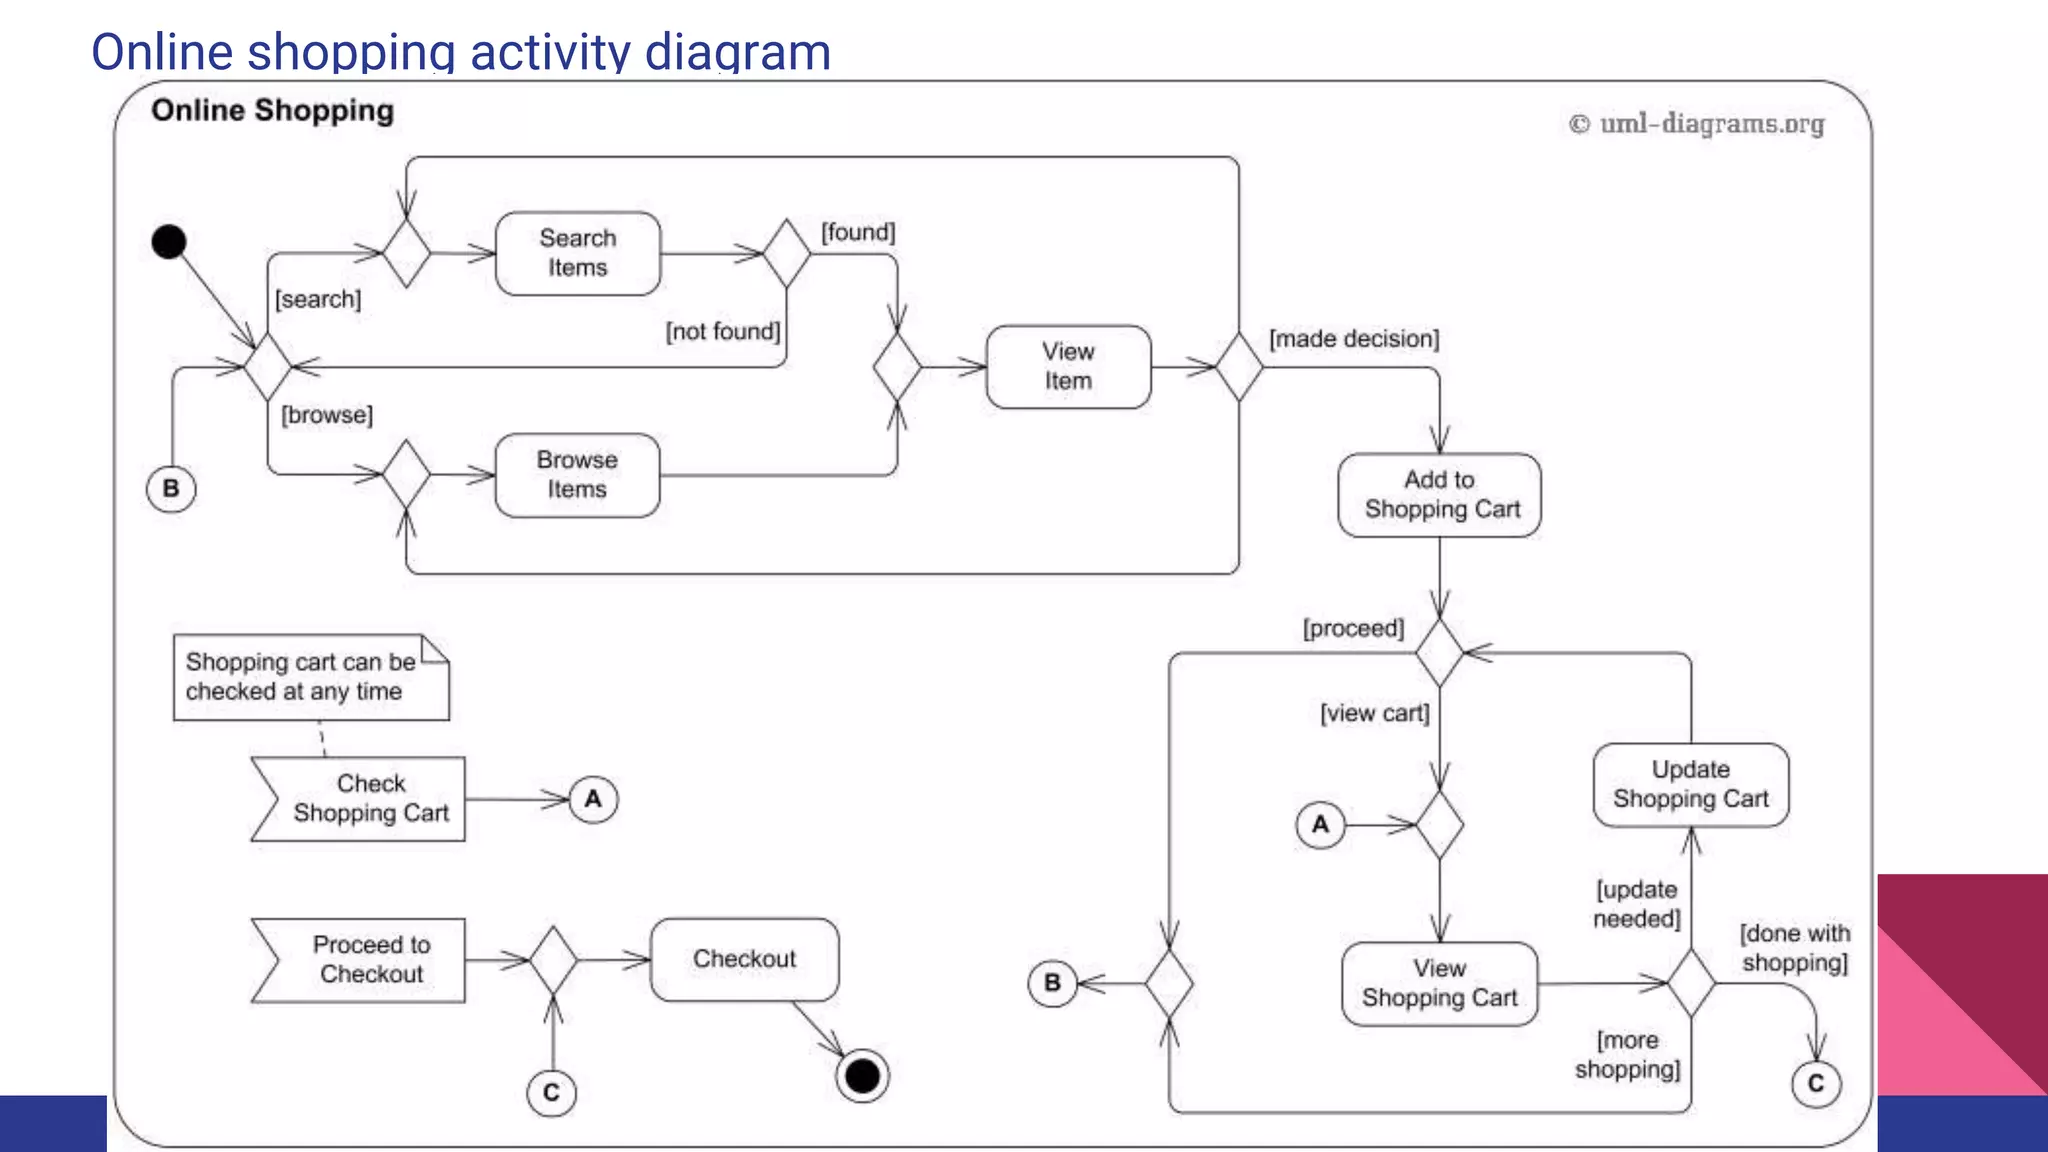
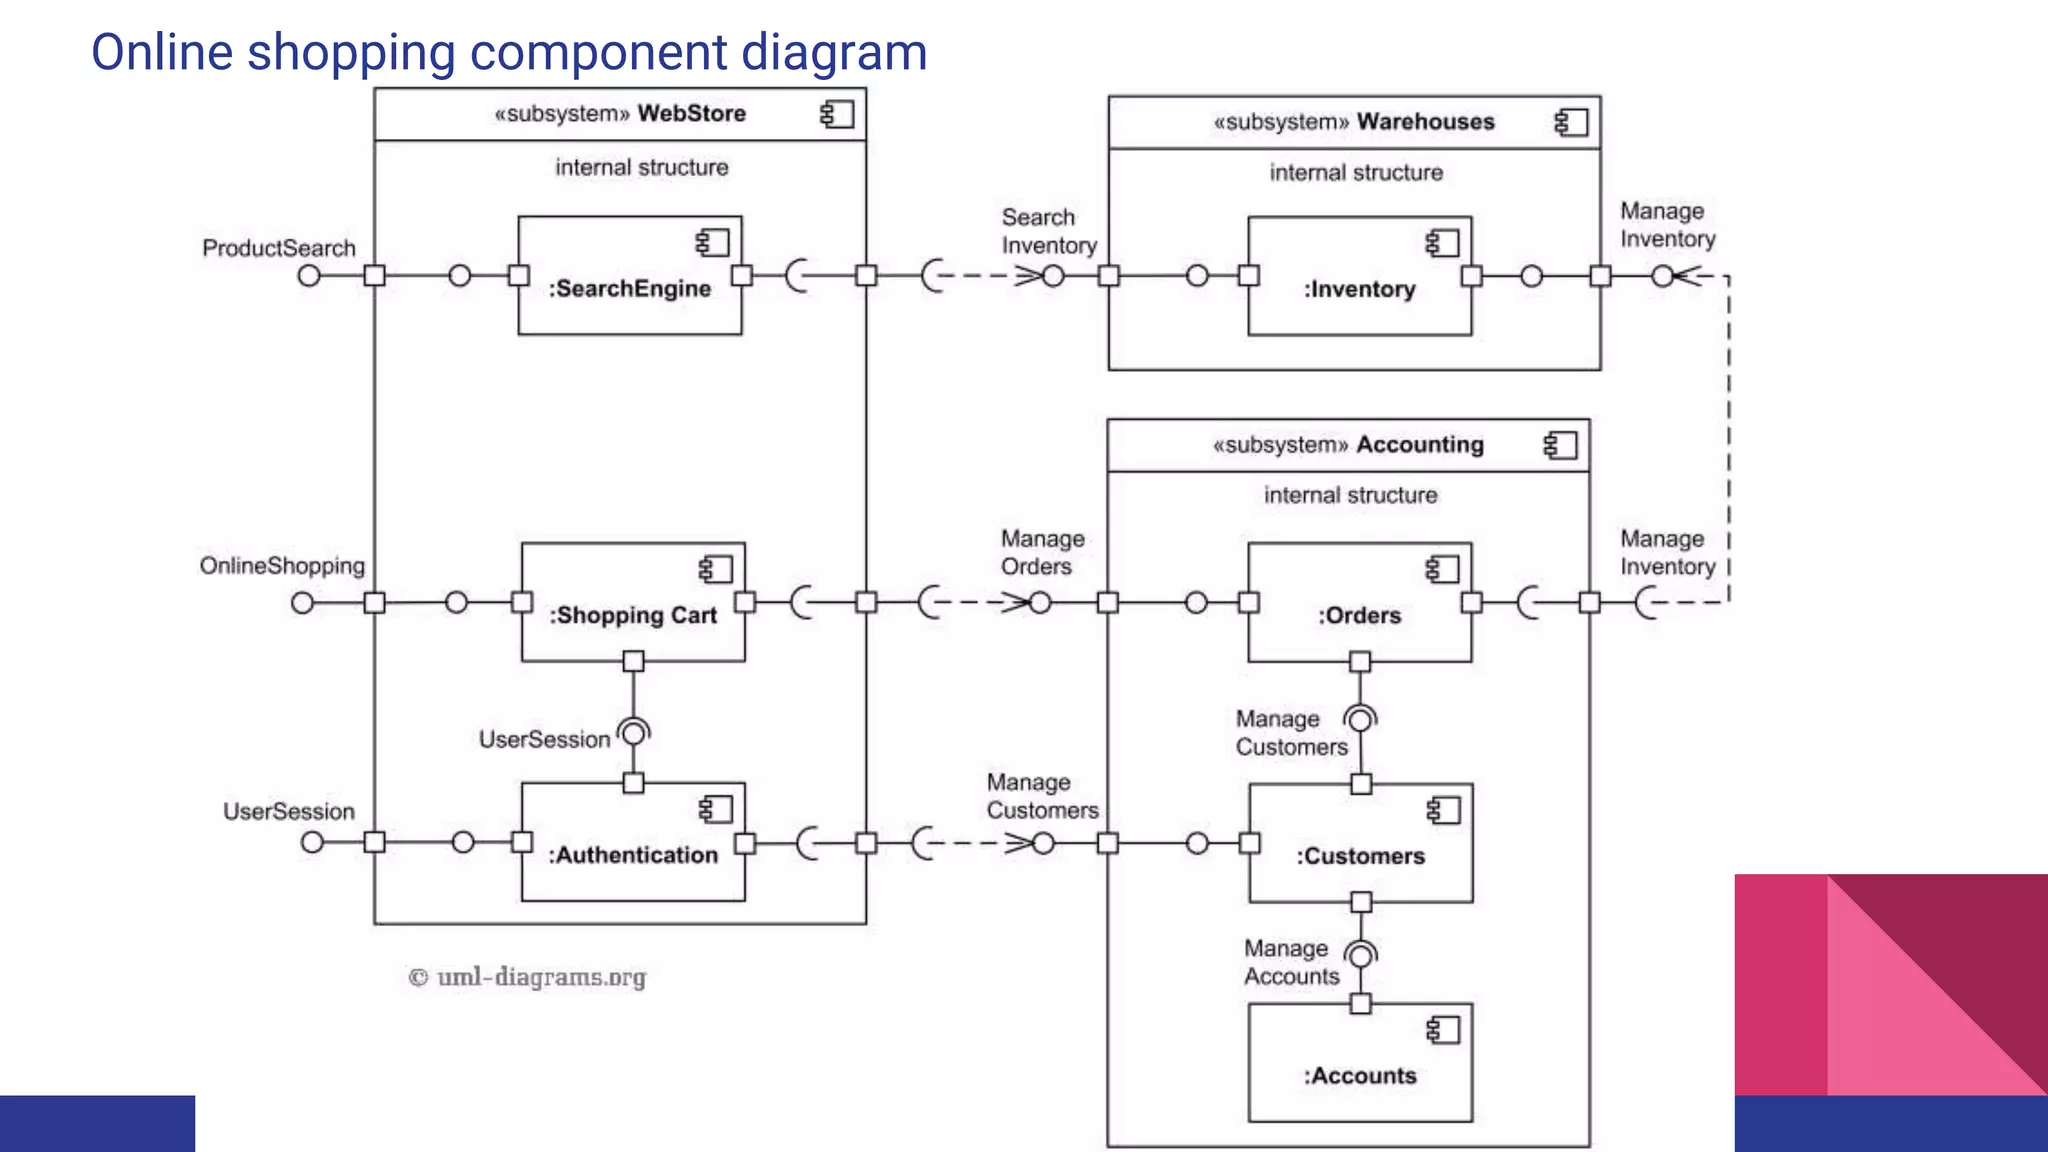

UML (Unified Modeling Language) is used for object-oriented modeling and consists of 14 diagram types used to model the structure, behavior, and business processes of an application. The most commonly used diagram is the class diagram, which shows classes, attributes, operations, and relationships between classes. Other diagram types include component diagrams, deployment diagrams, object diagrams, package diagrams, use case diagrams, activity diagrams, state machine diagrams, sequence diagrams, and communication diagrams. An example of modeling an online shopping system is provided using user case diagrams, domain models, activity diagrams, and component diagrams.
Introduction to Unified Modeling Language (UML) with presenter details.
Definition of UML, its applications in software engineering, and overview of 14 diagram types.
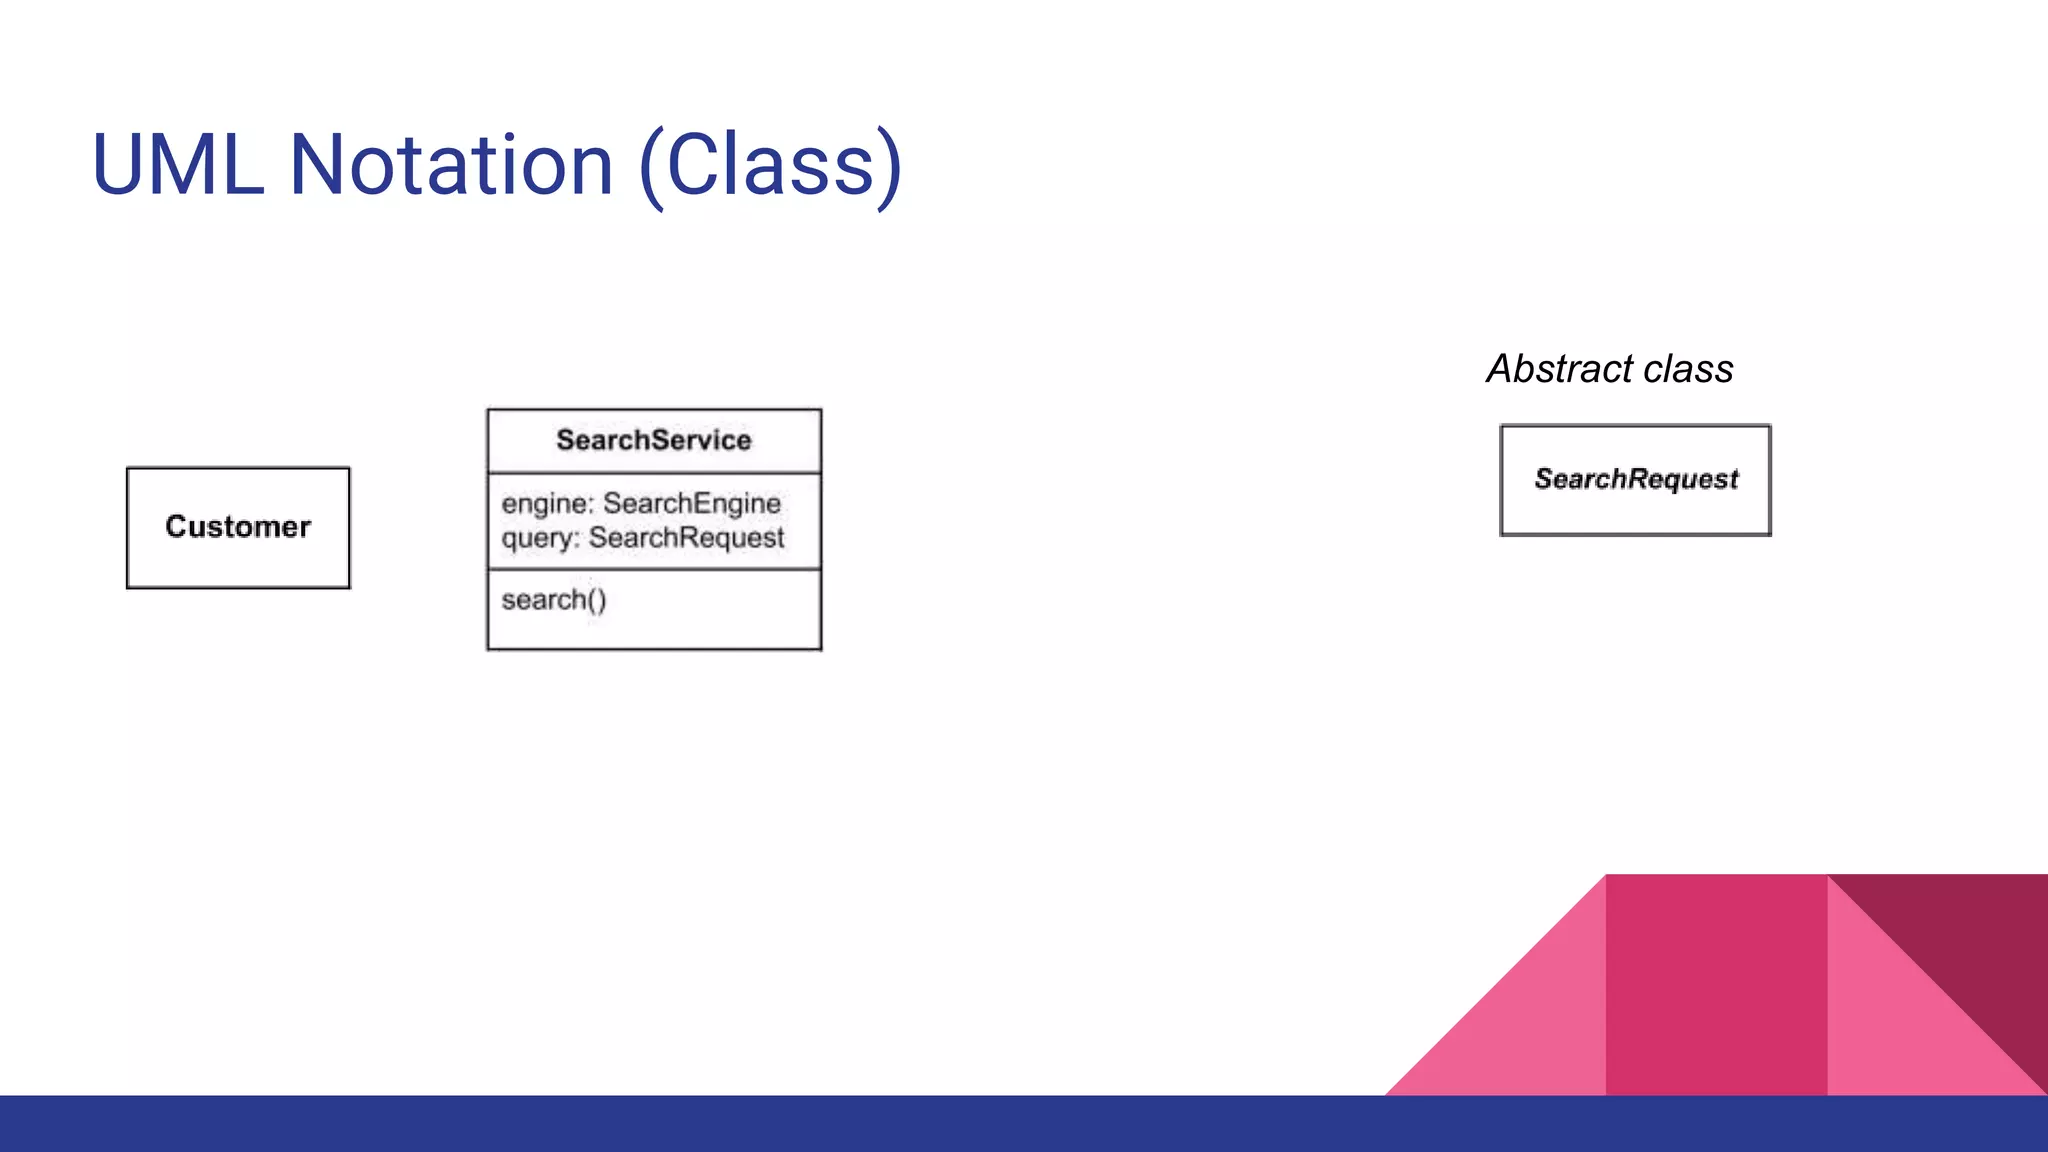
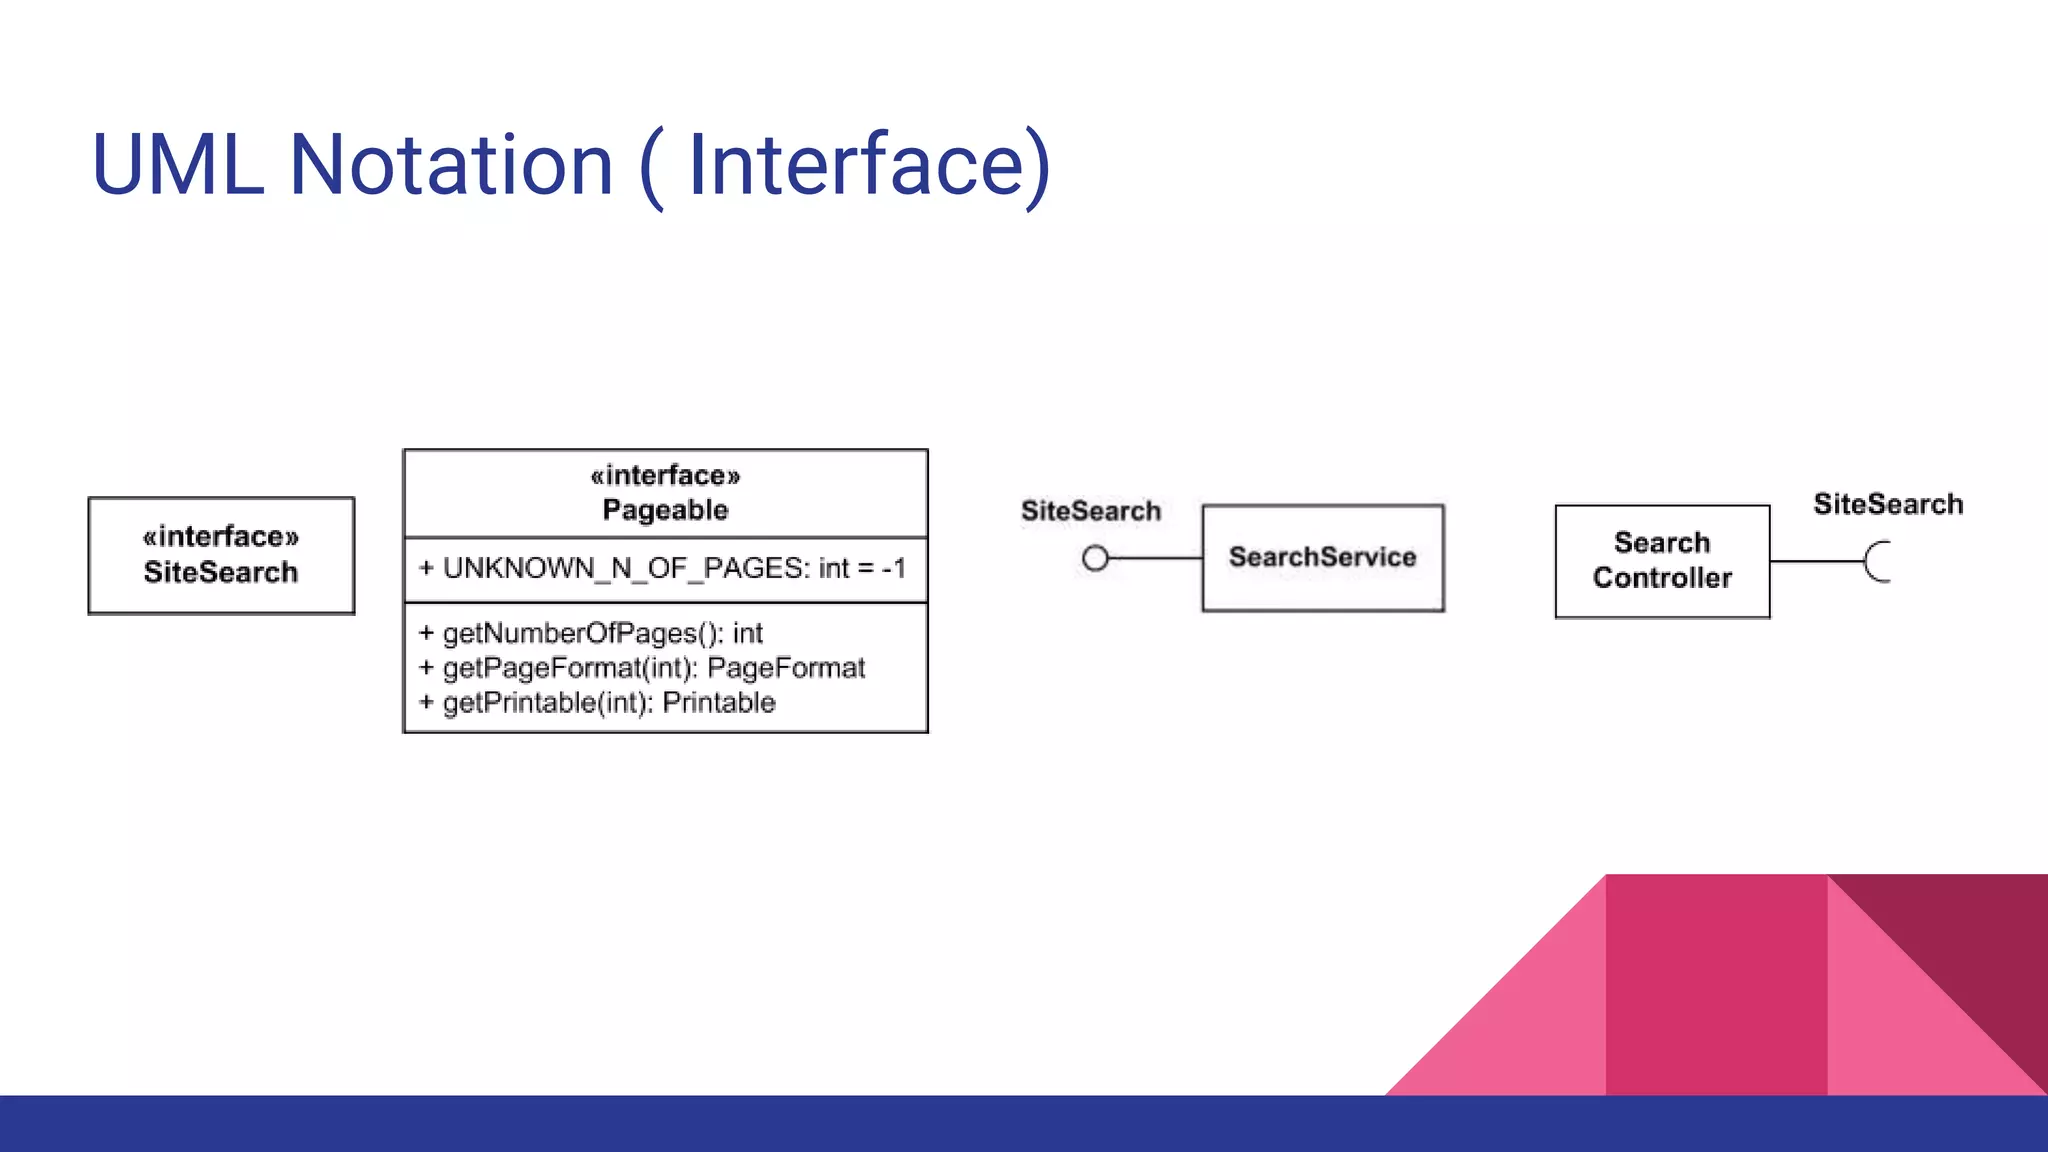
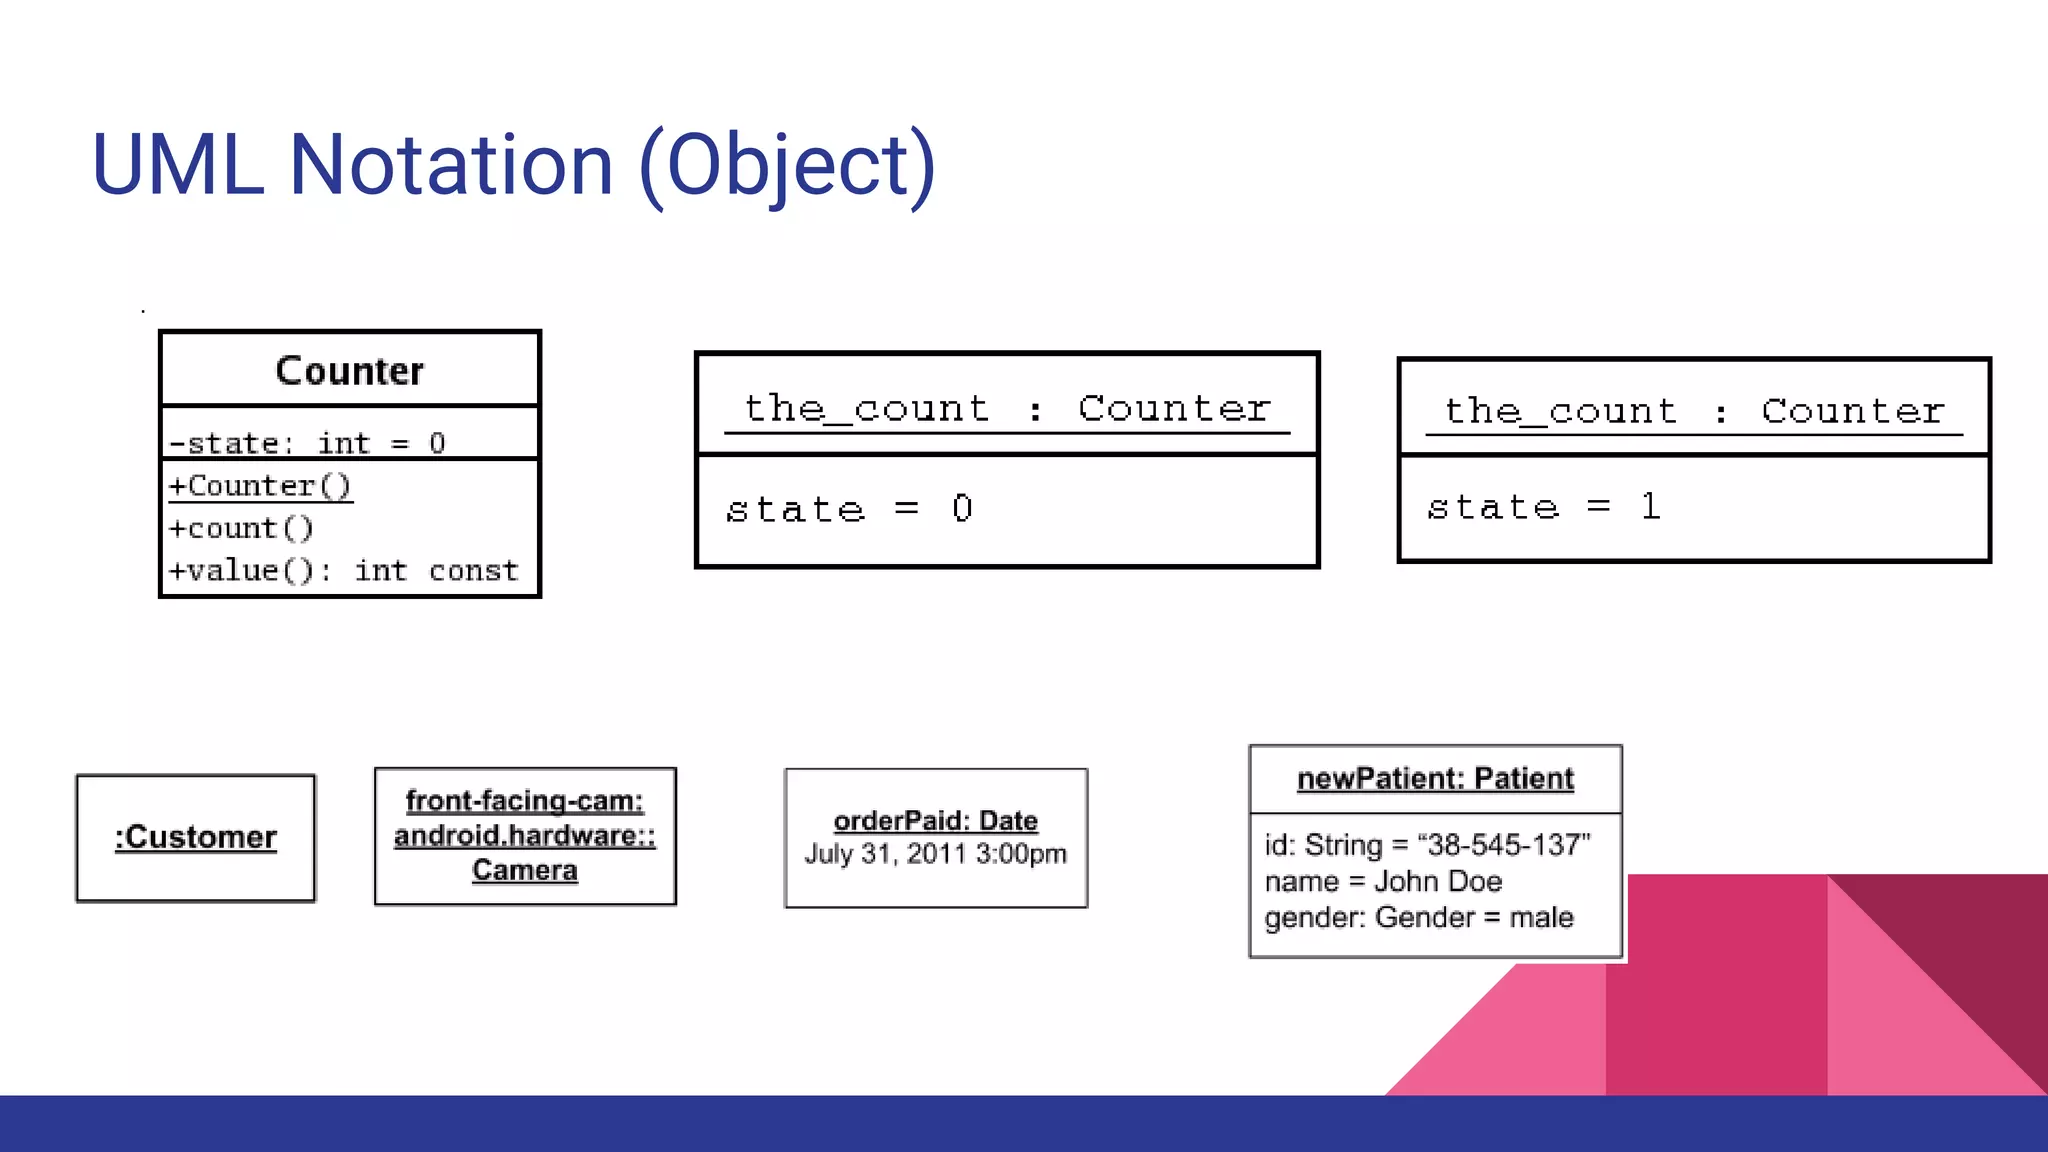
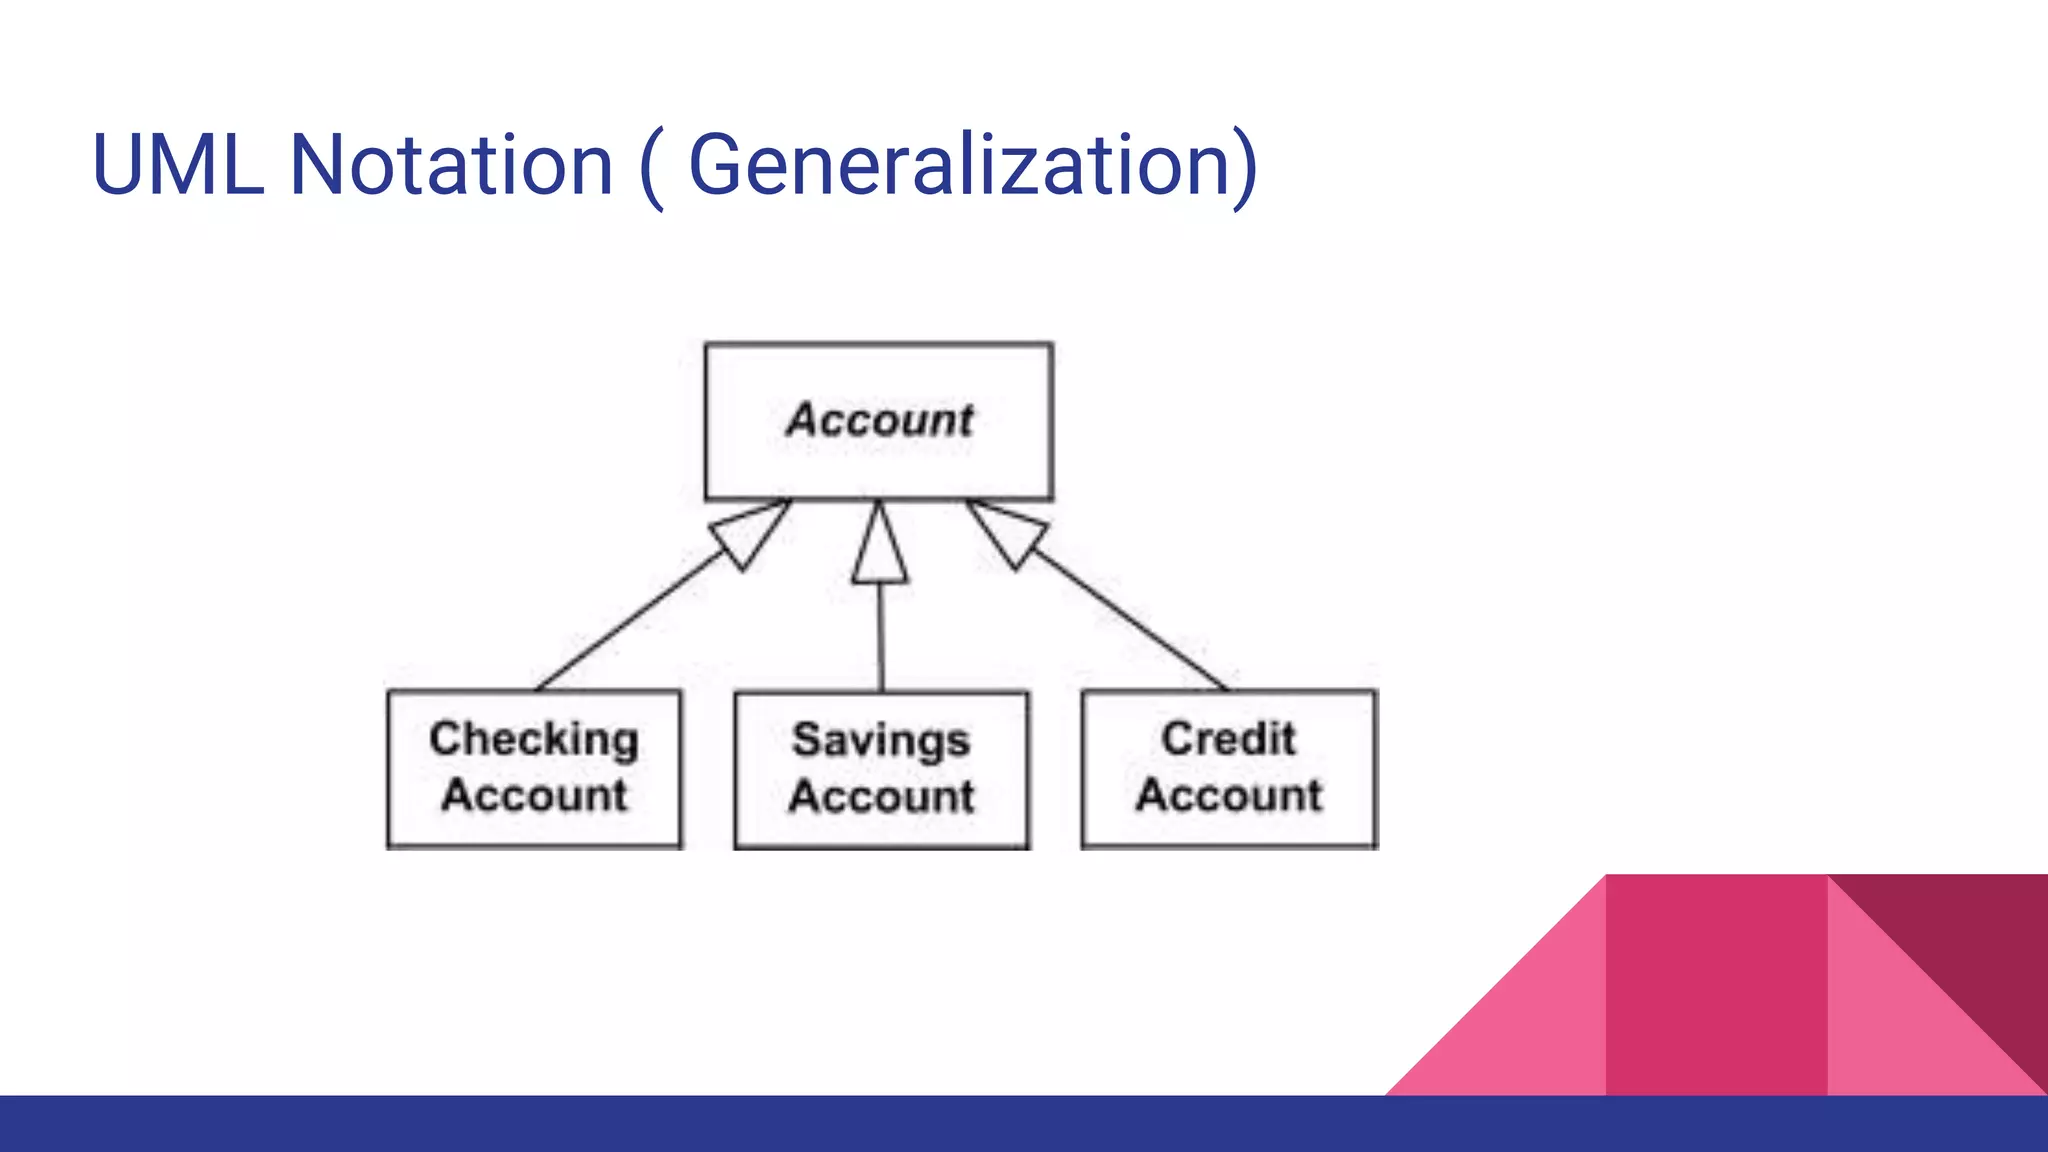
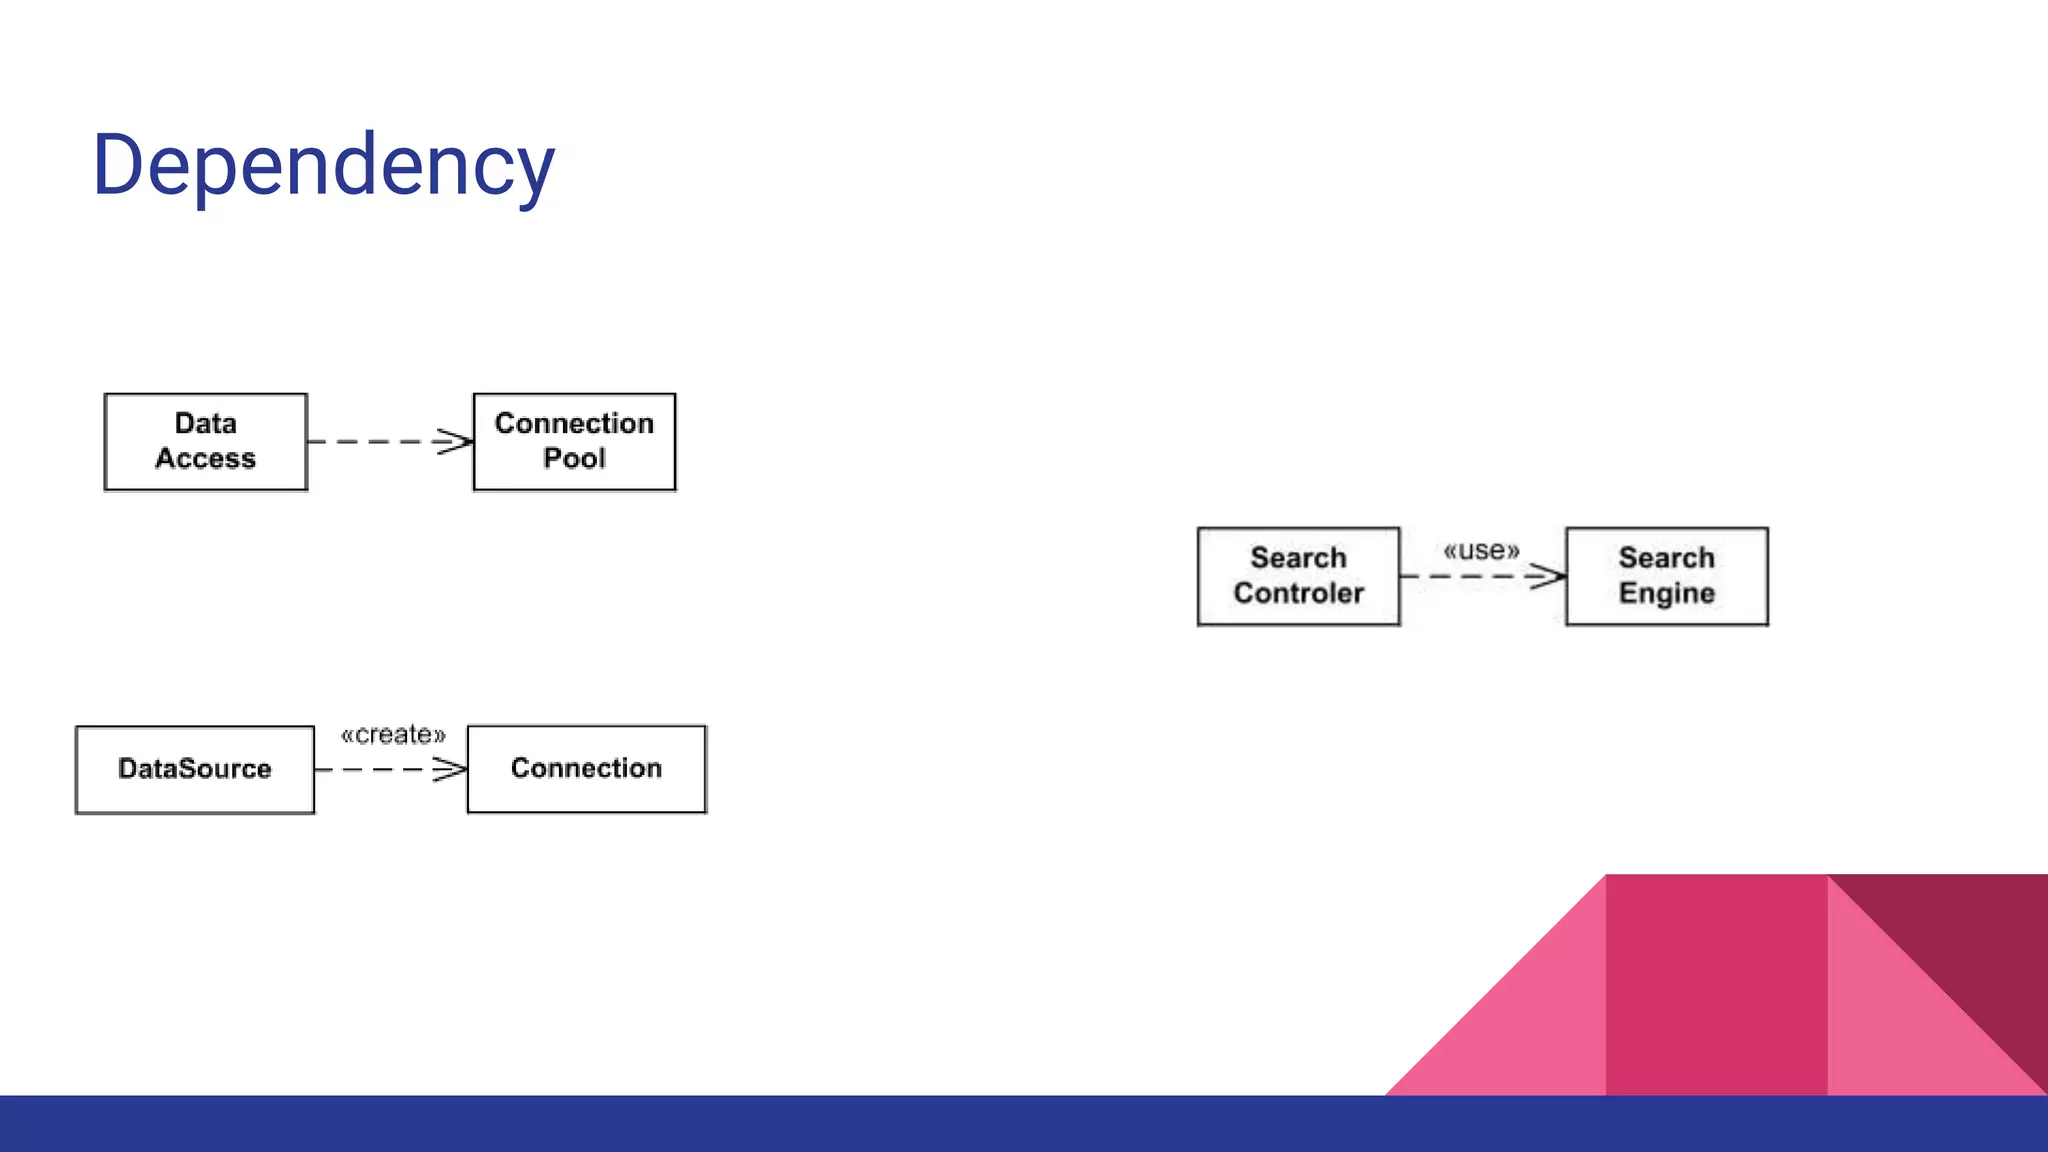
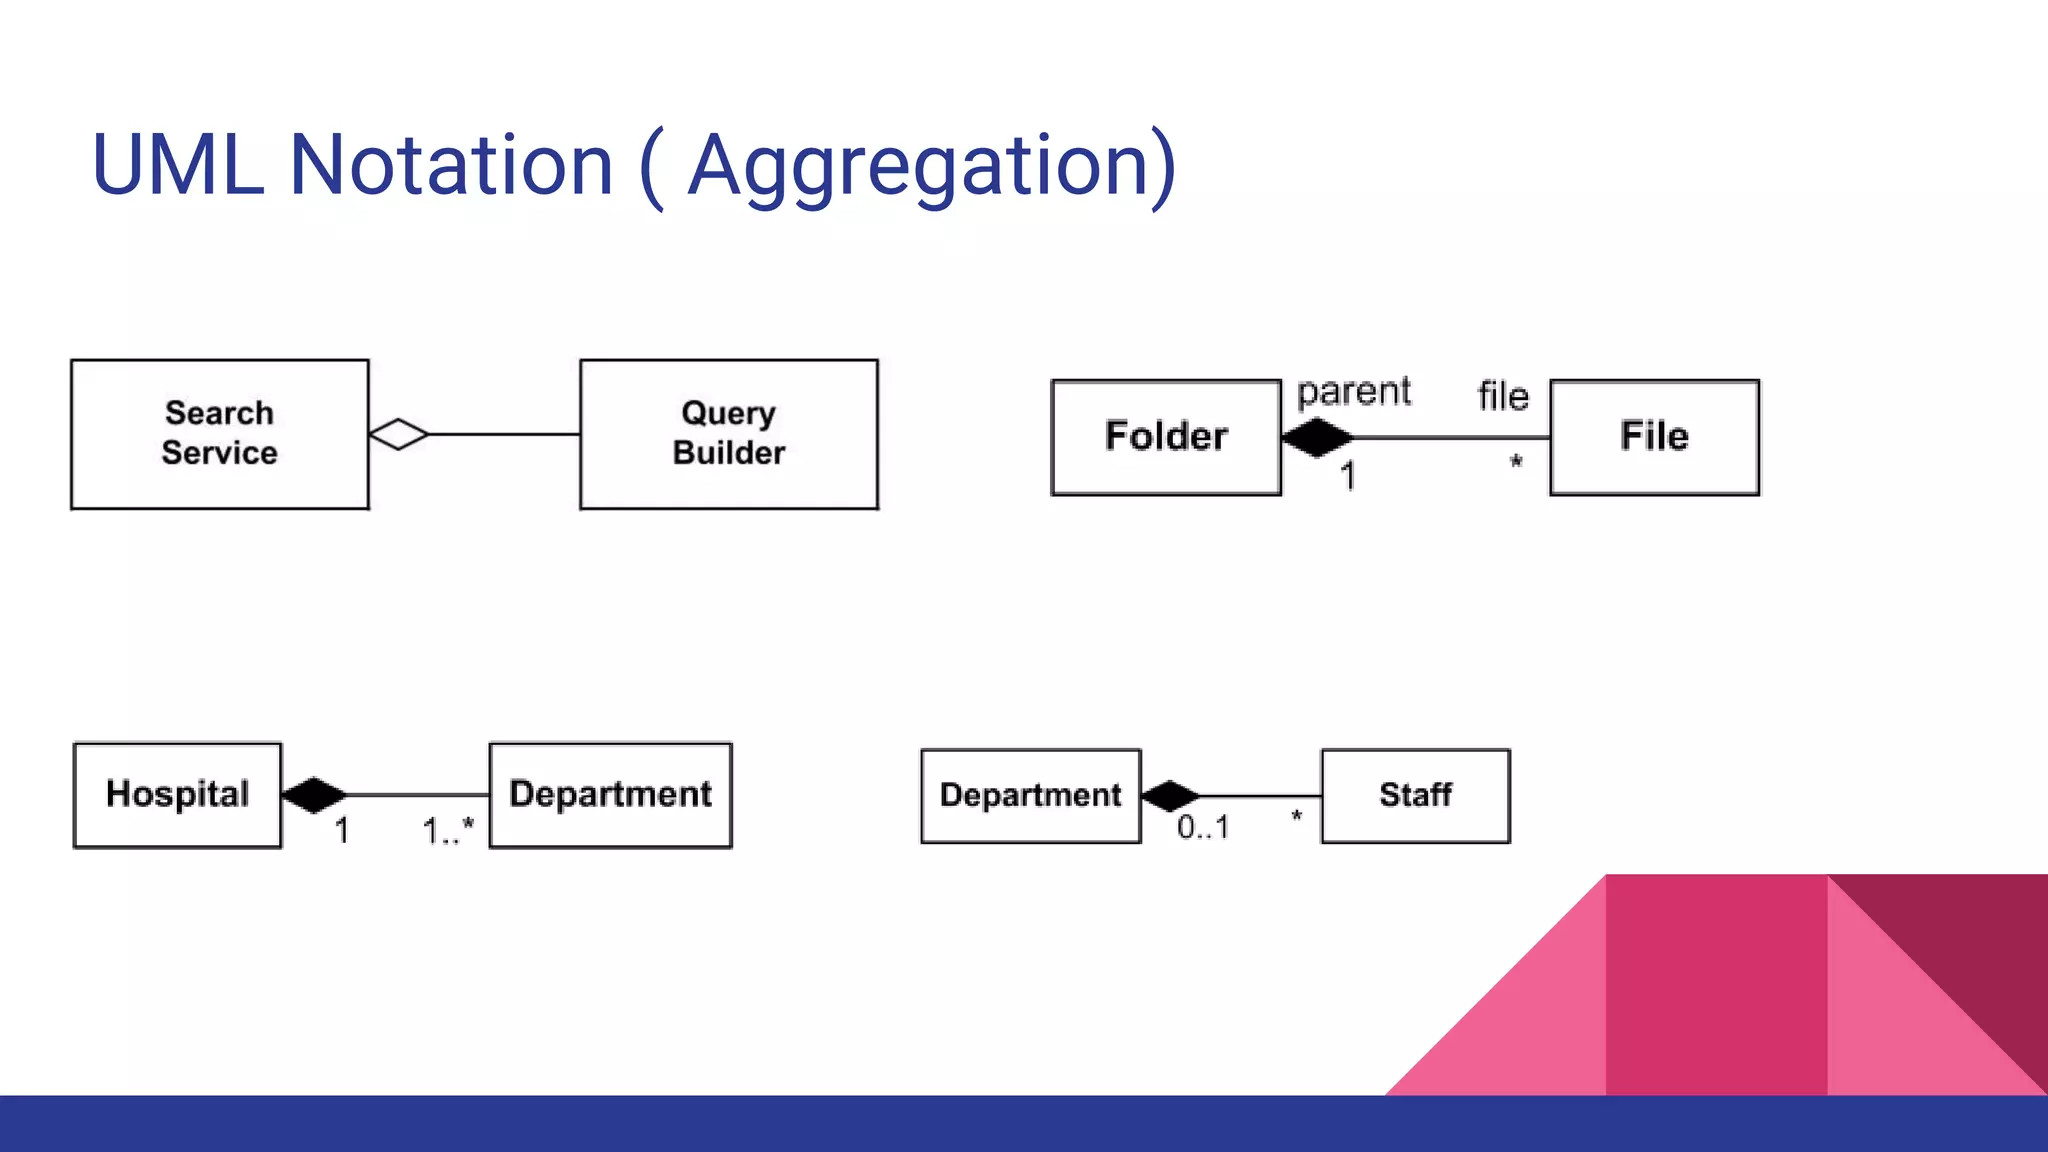
Various UML notations including abstract class, interface, object, generalization, dependency, and aggregation.
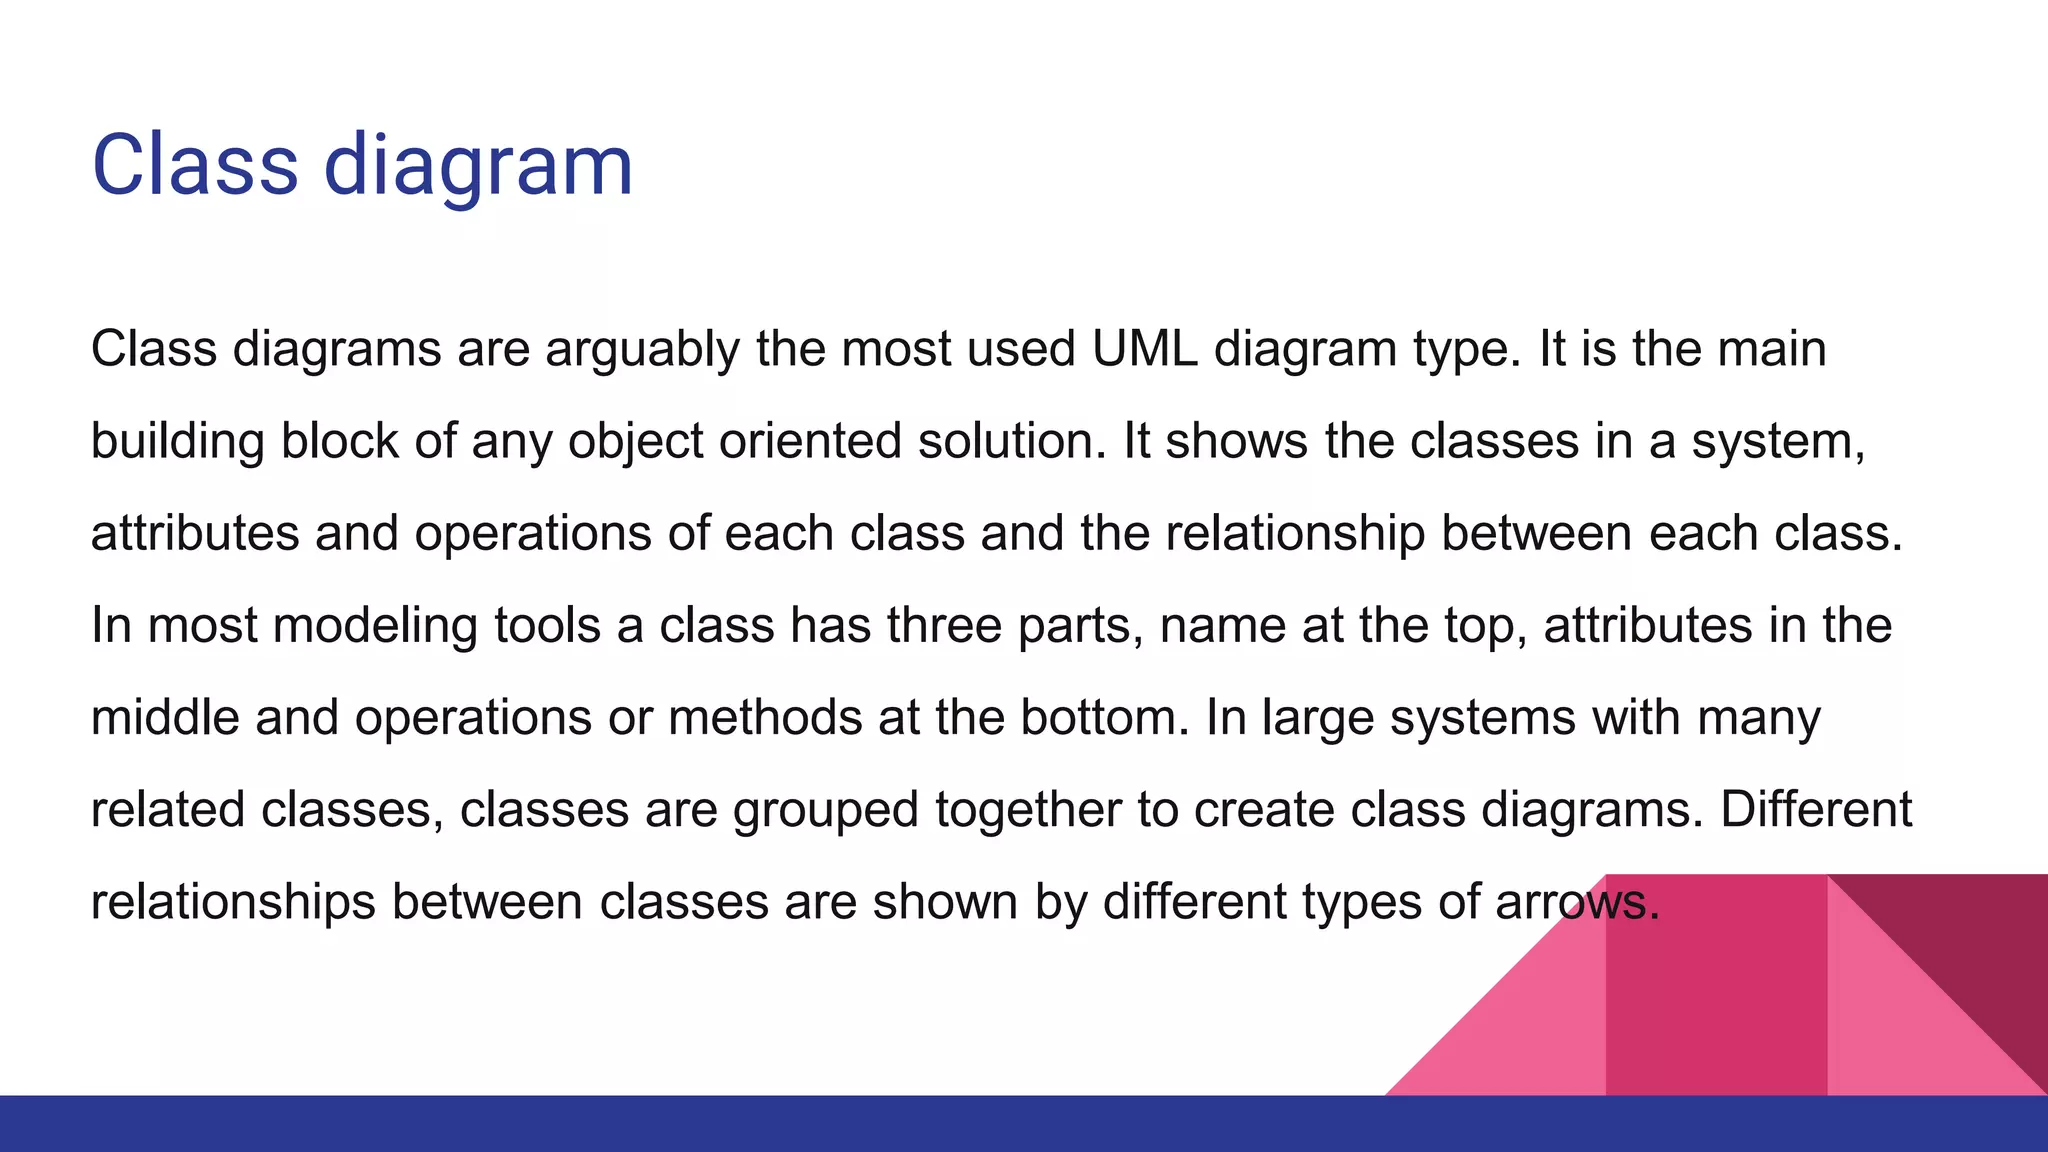
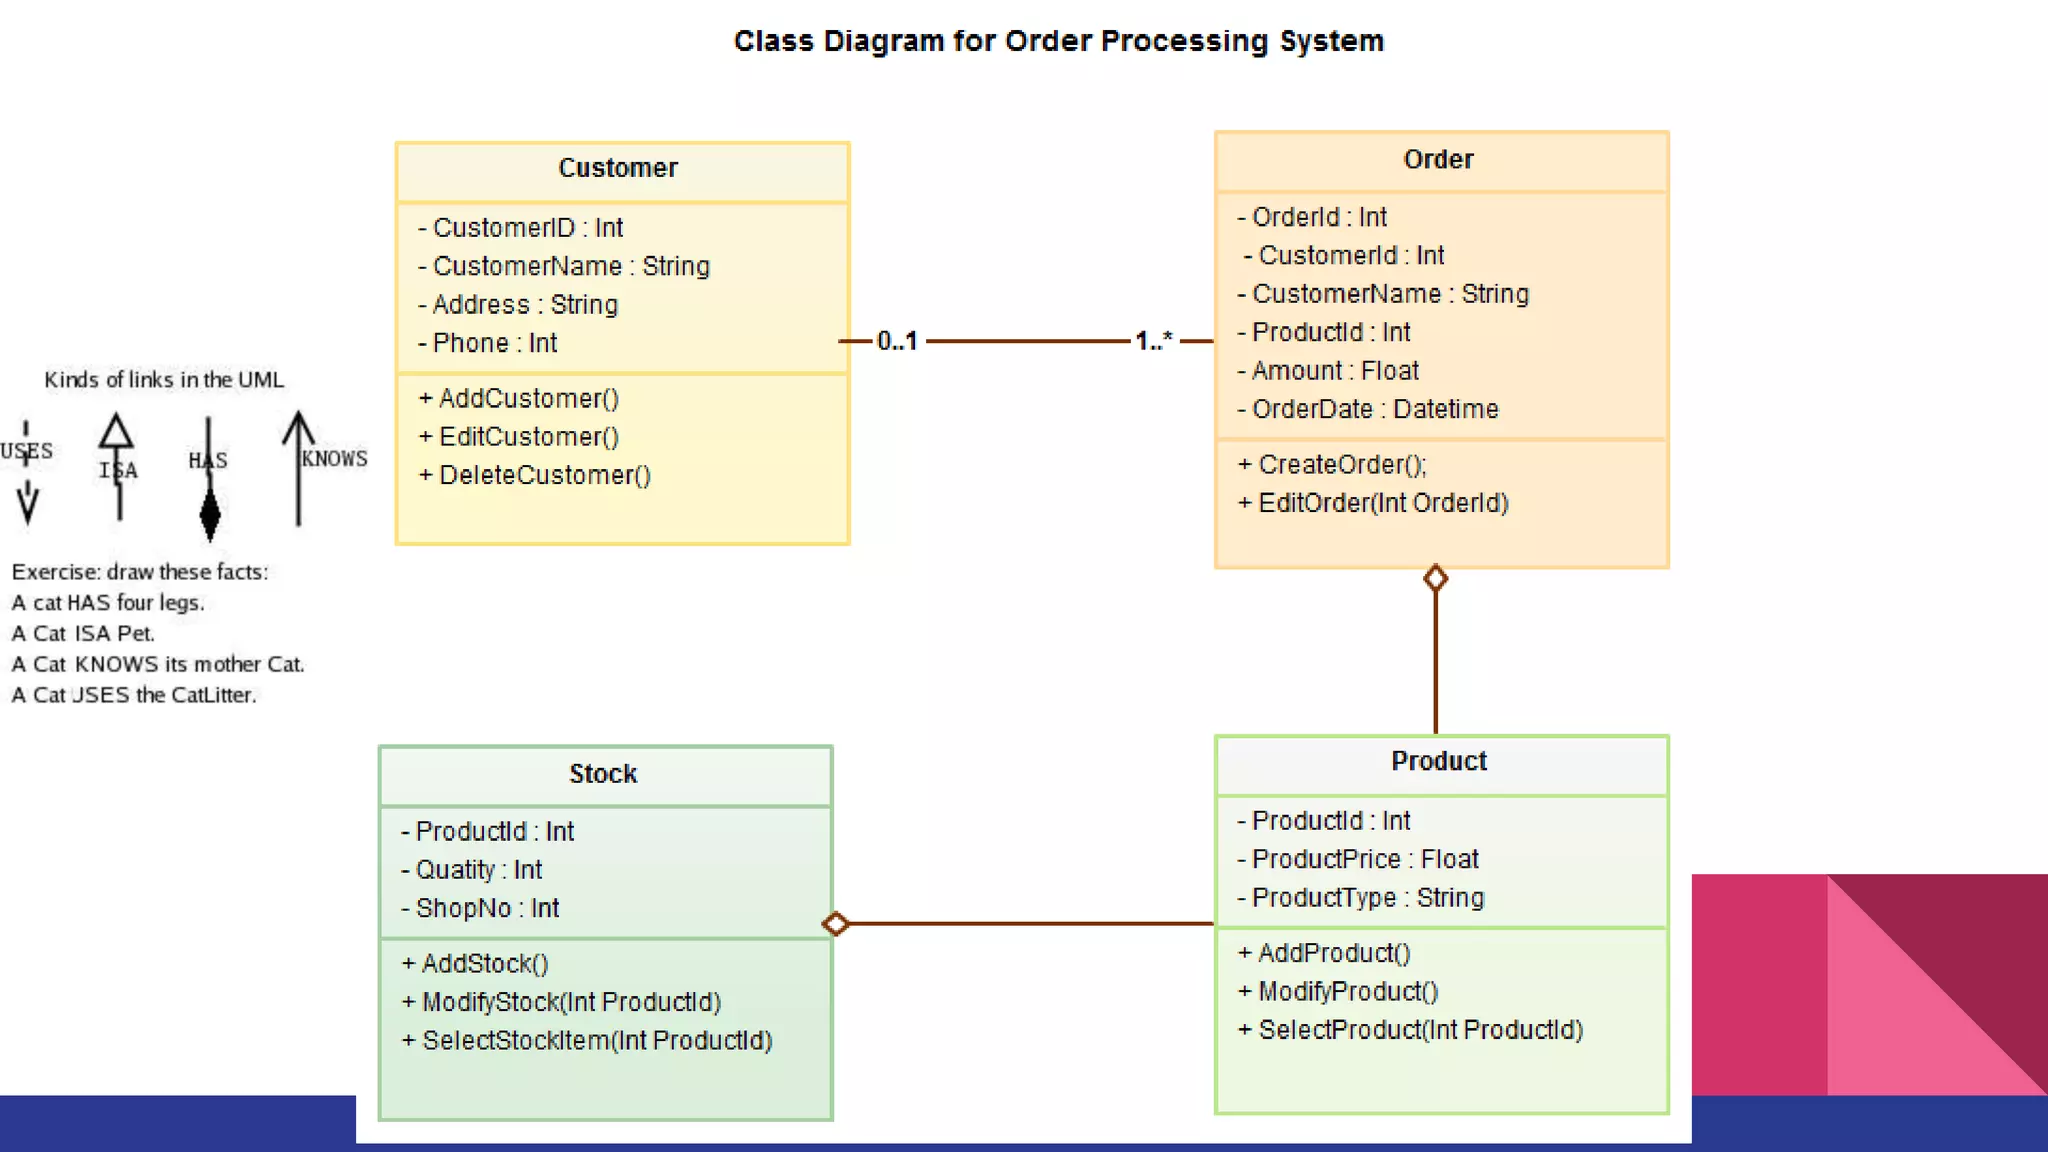
Focus on class diagrams as key components for object-oriented solutions, showing attributes and relationships.
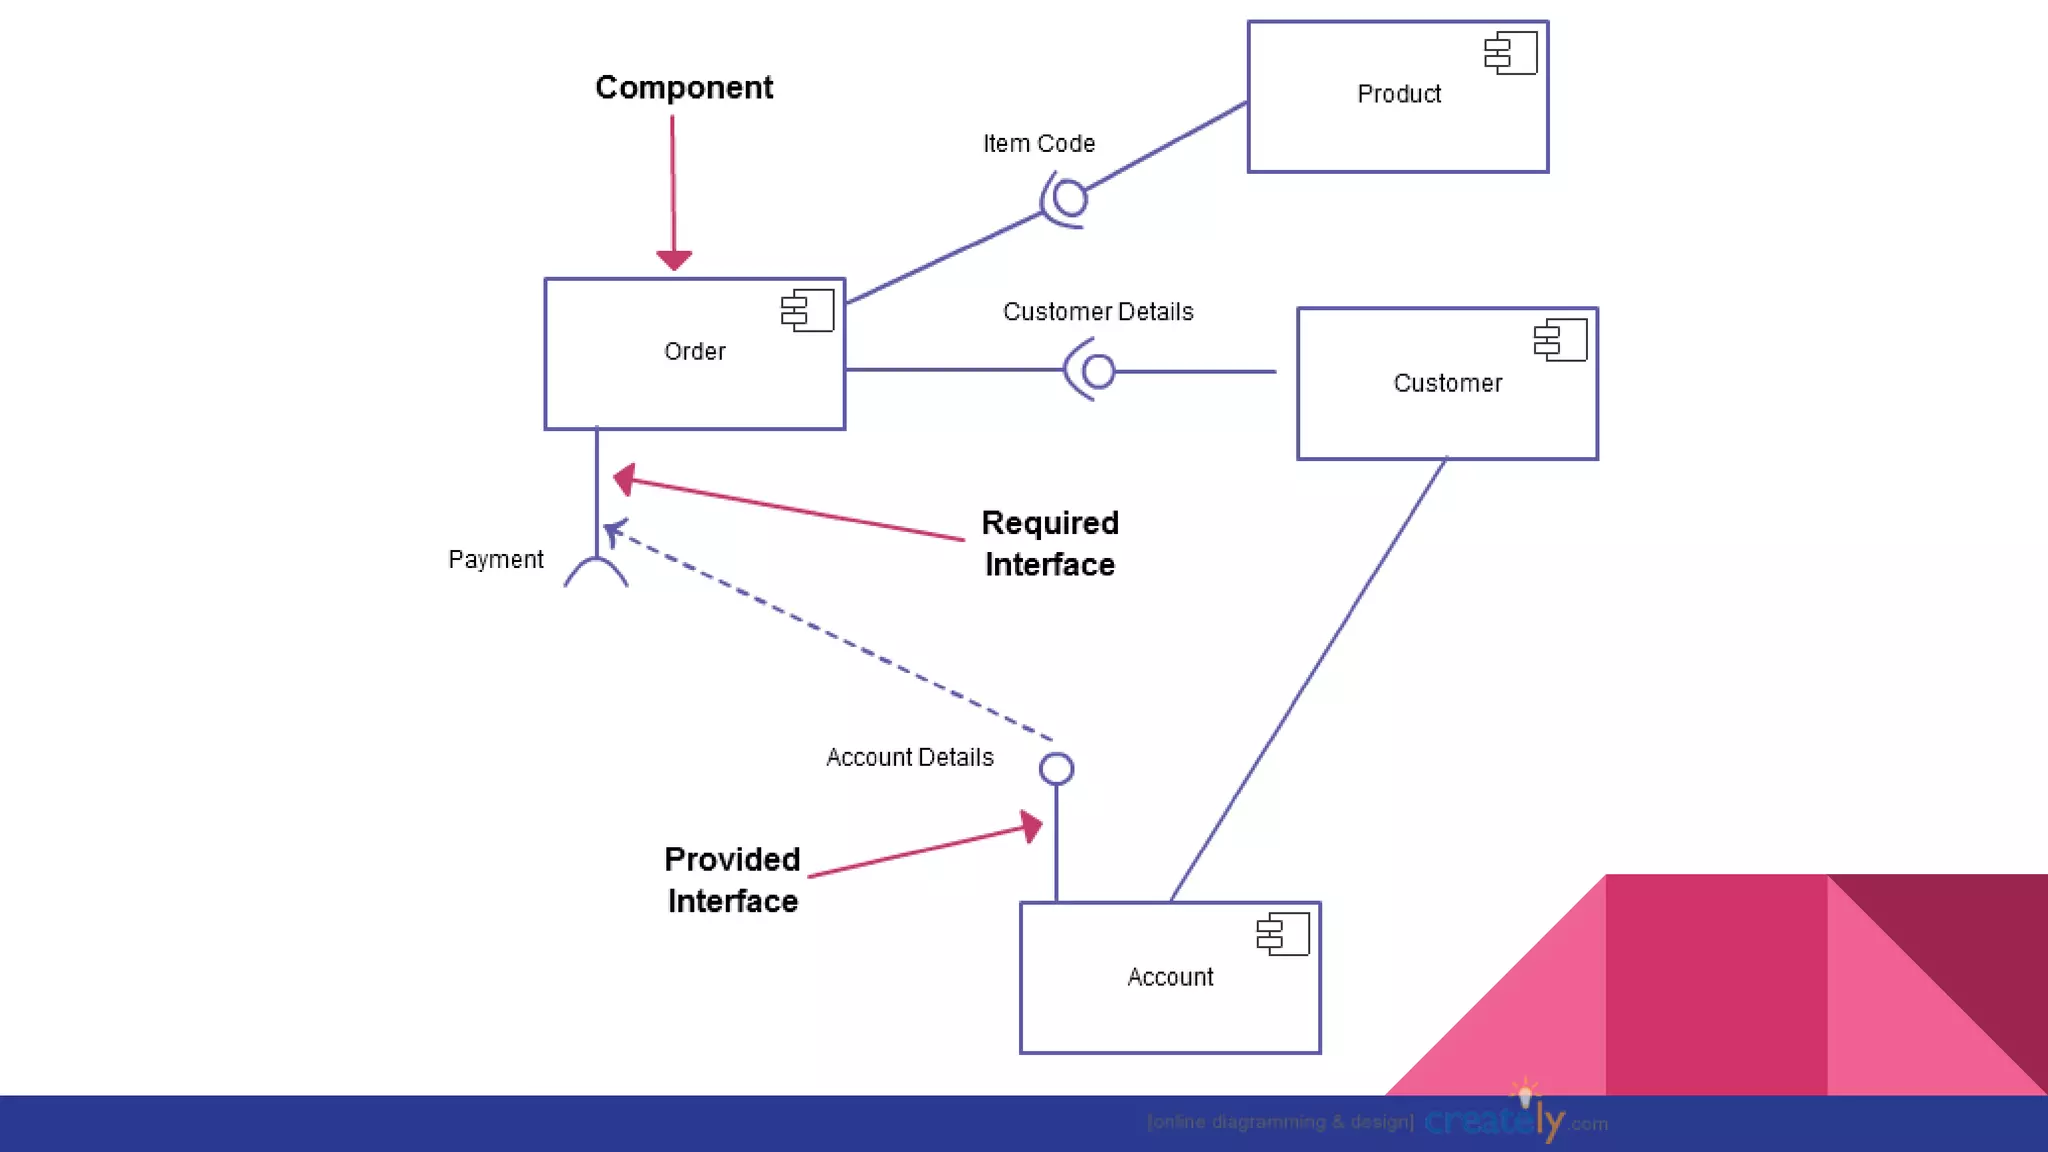
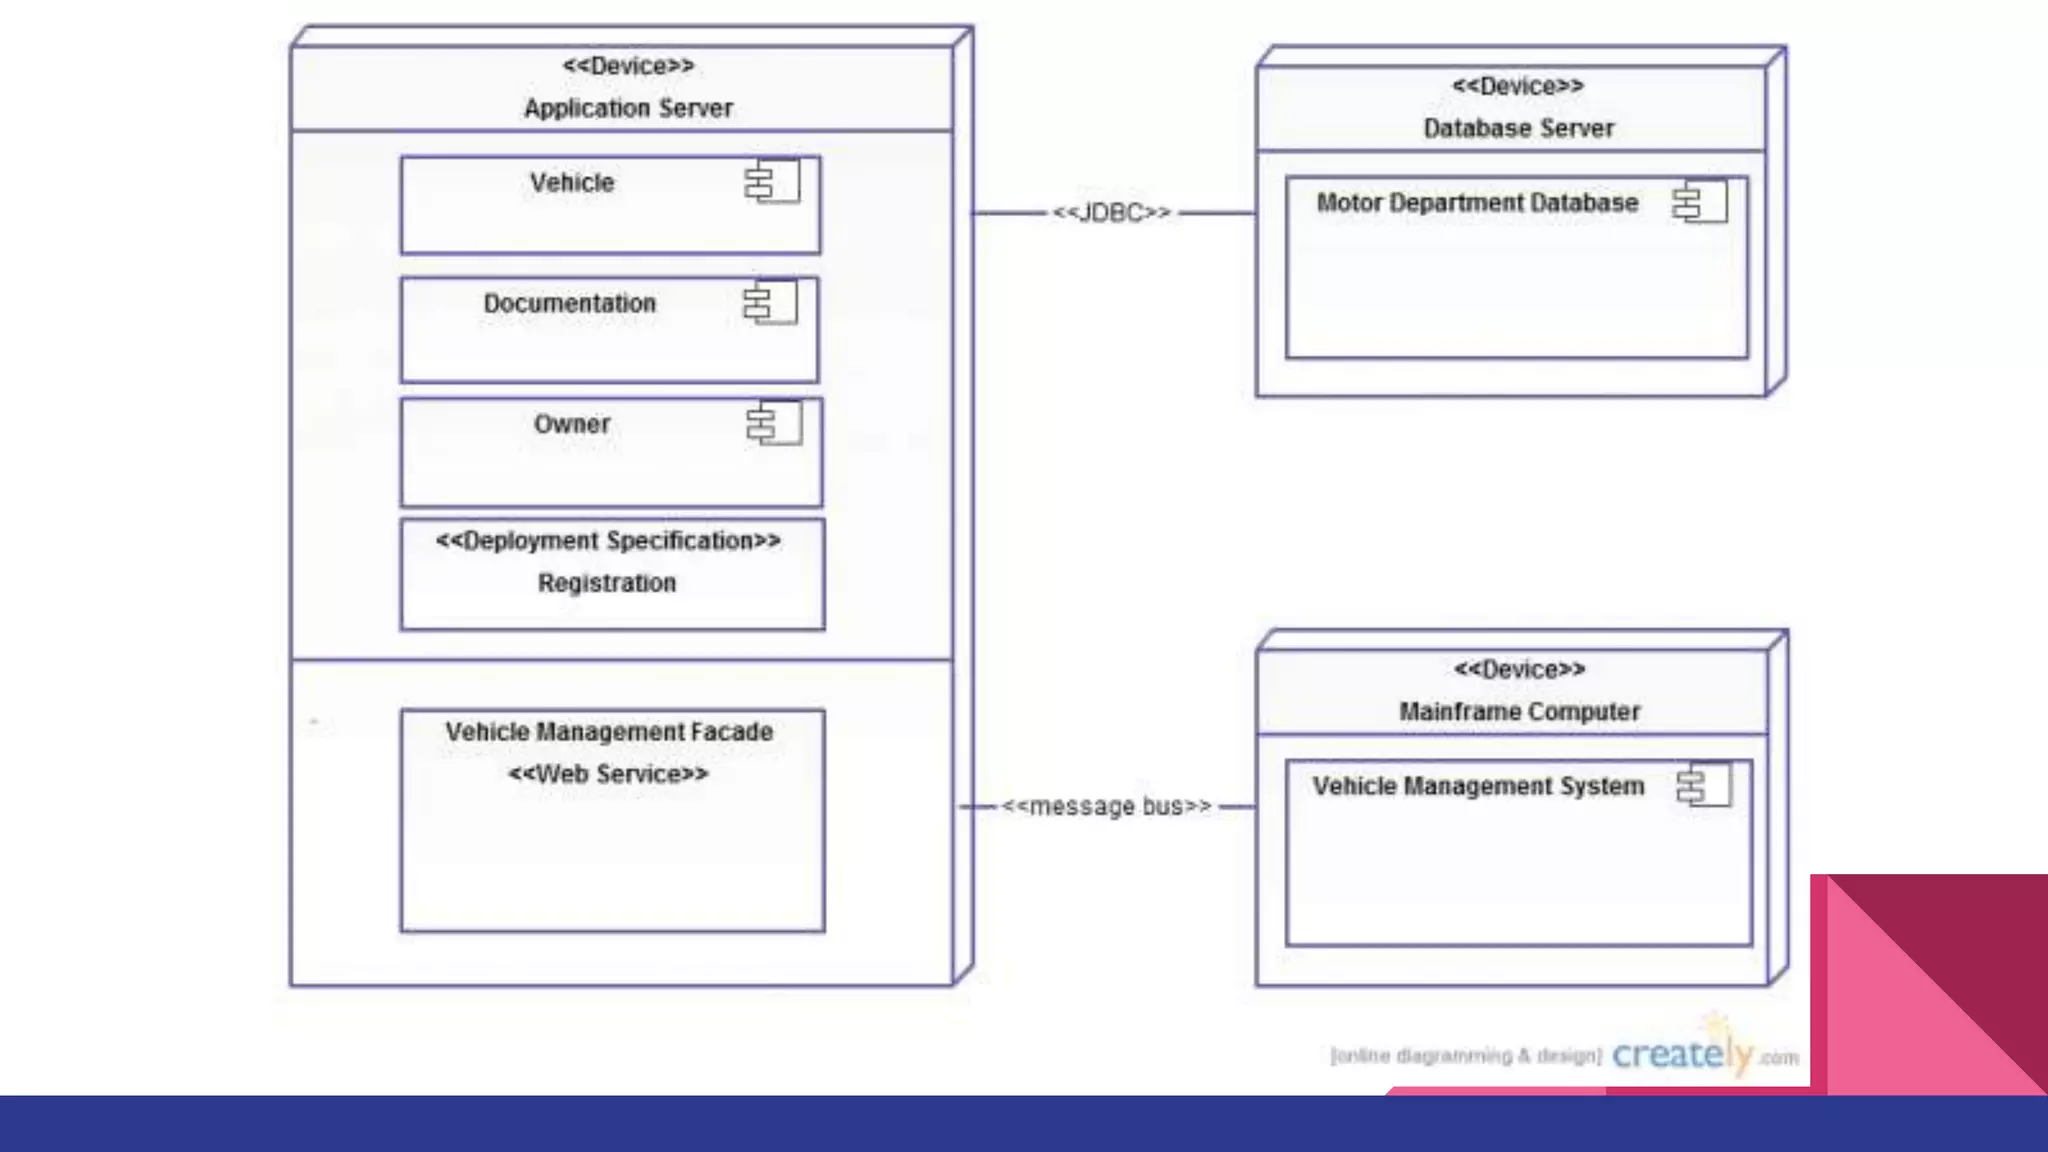
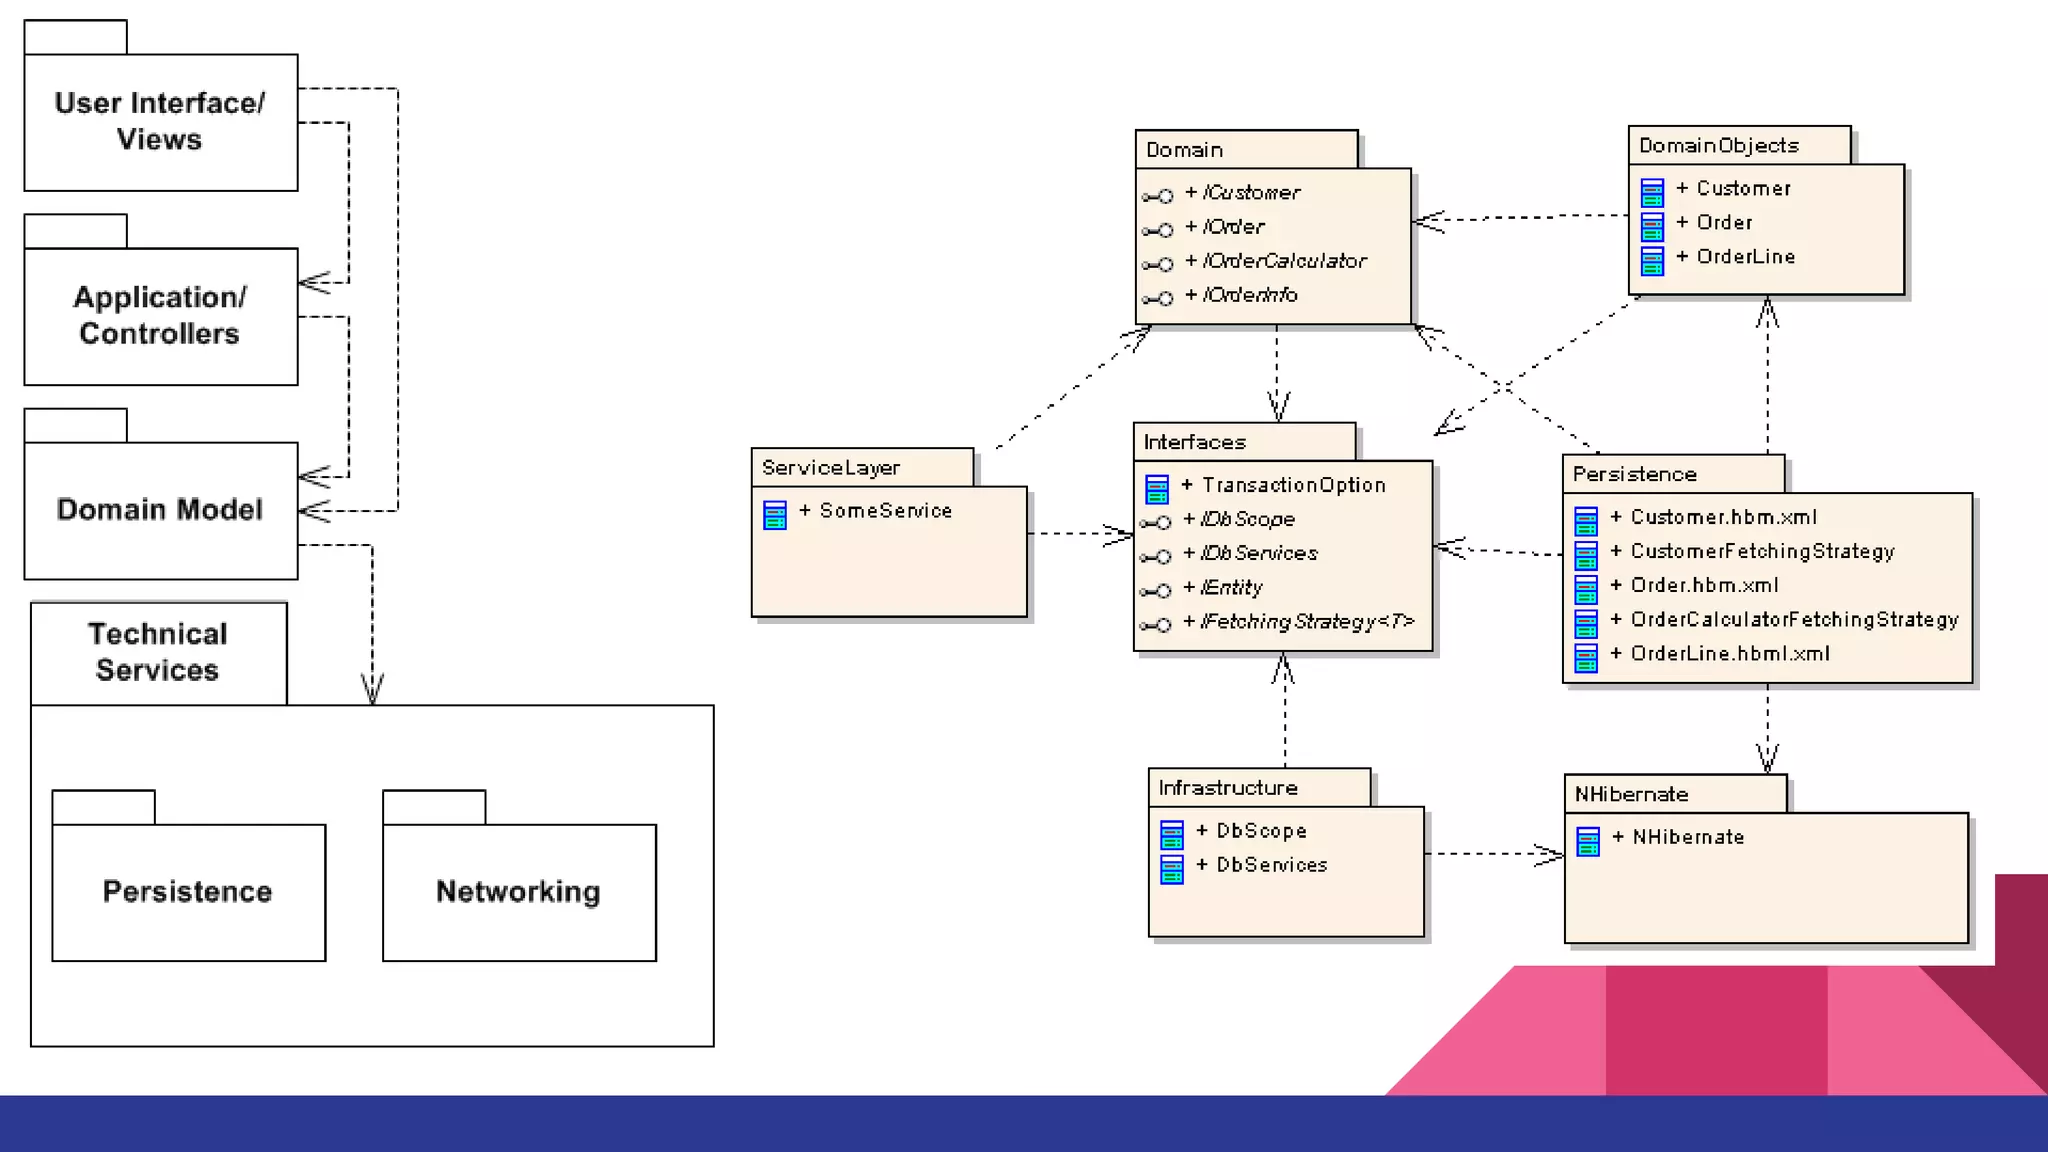
Explanation of component diagrams for structural relationships and deployment diagrams for hardware/software configurations.
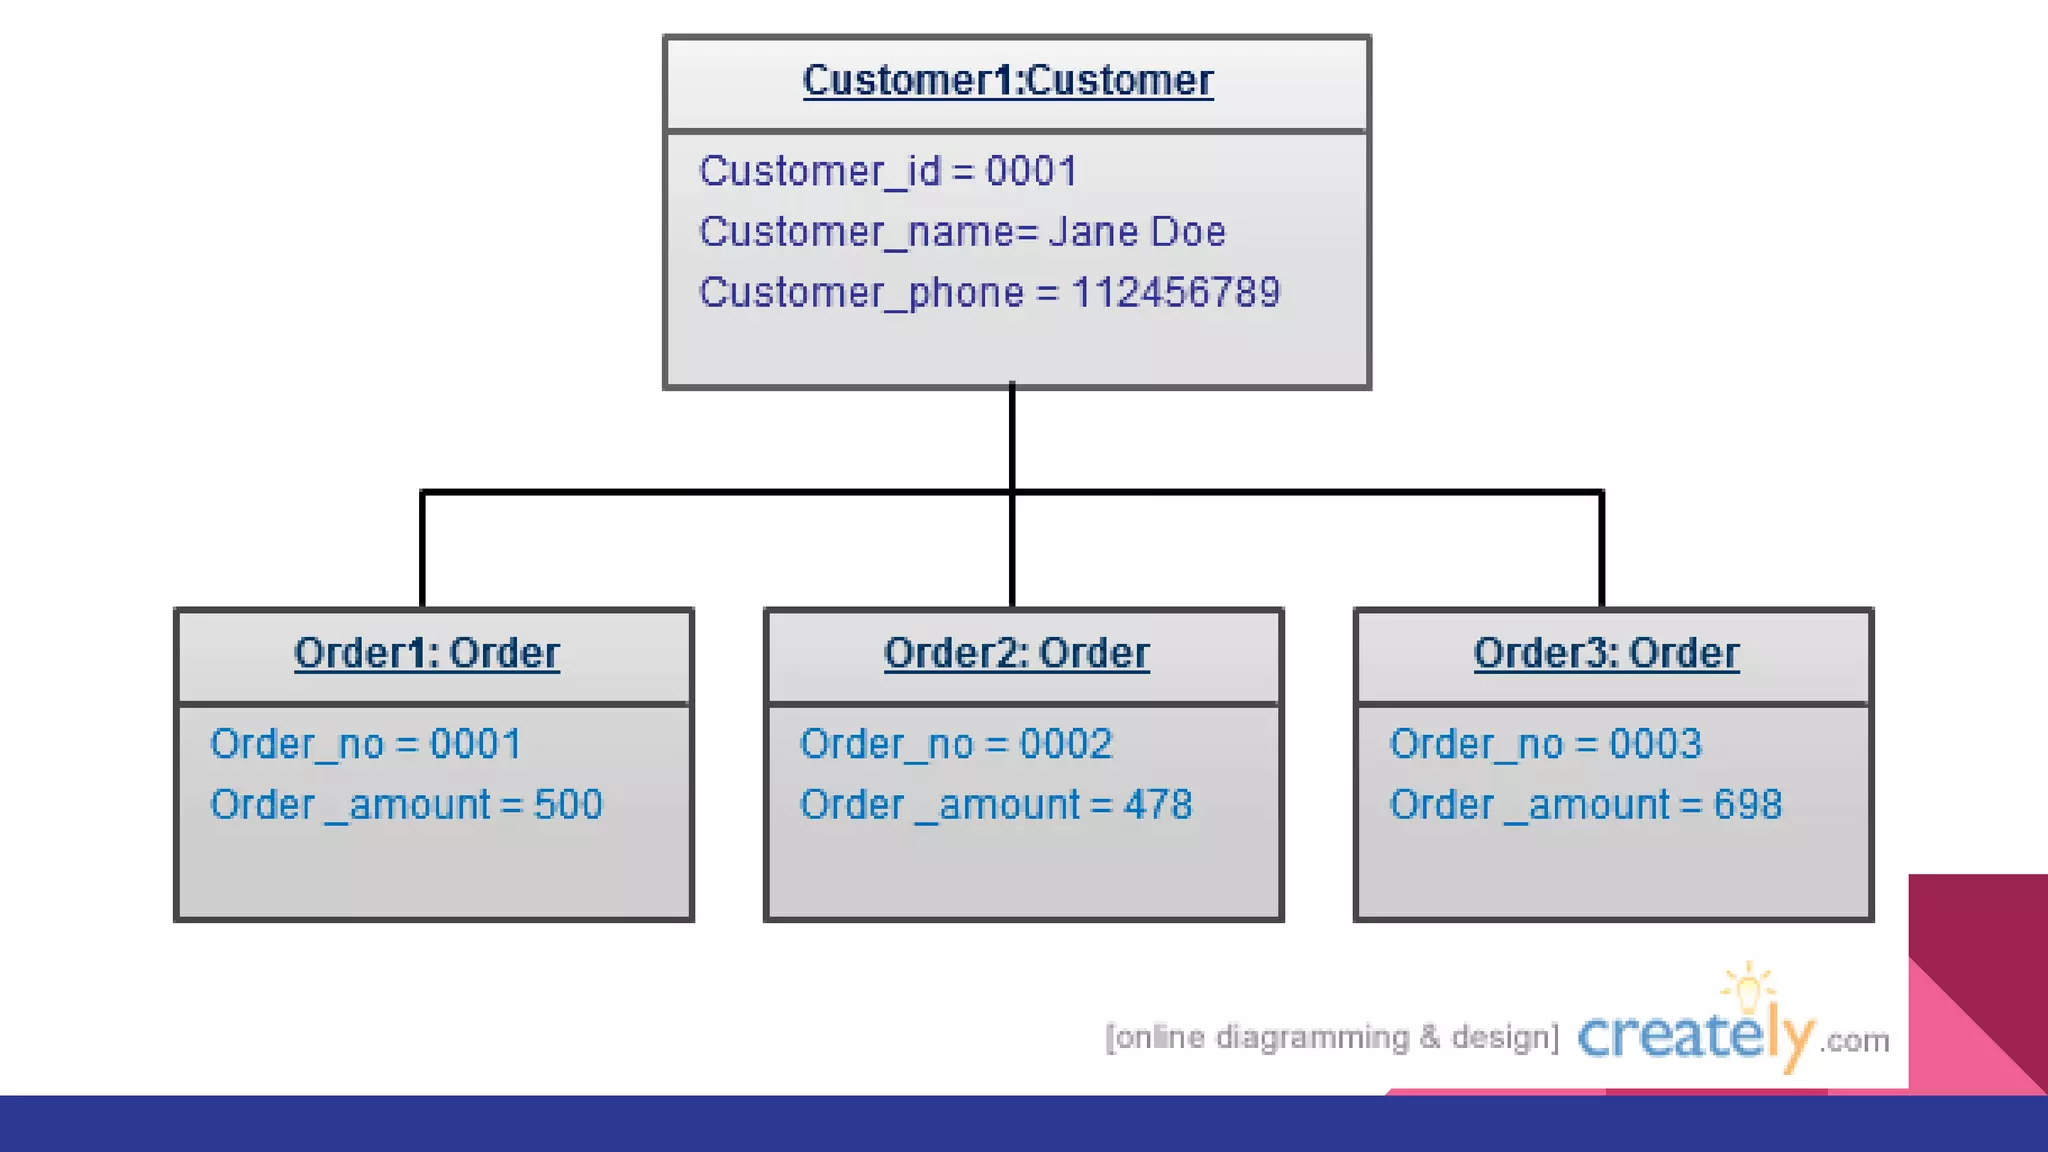
Comparison of object diagrams to class diagrams, detailing real-world snapshots and package diagrams showing package dependencies.
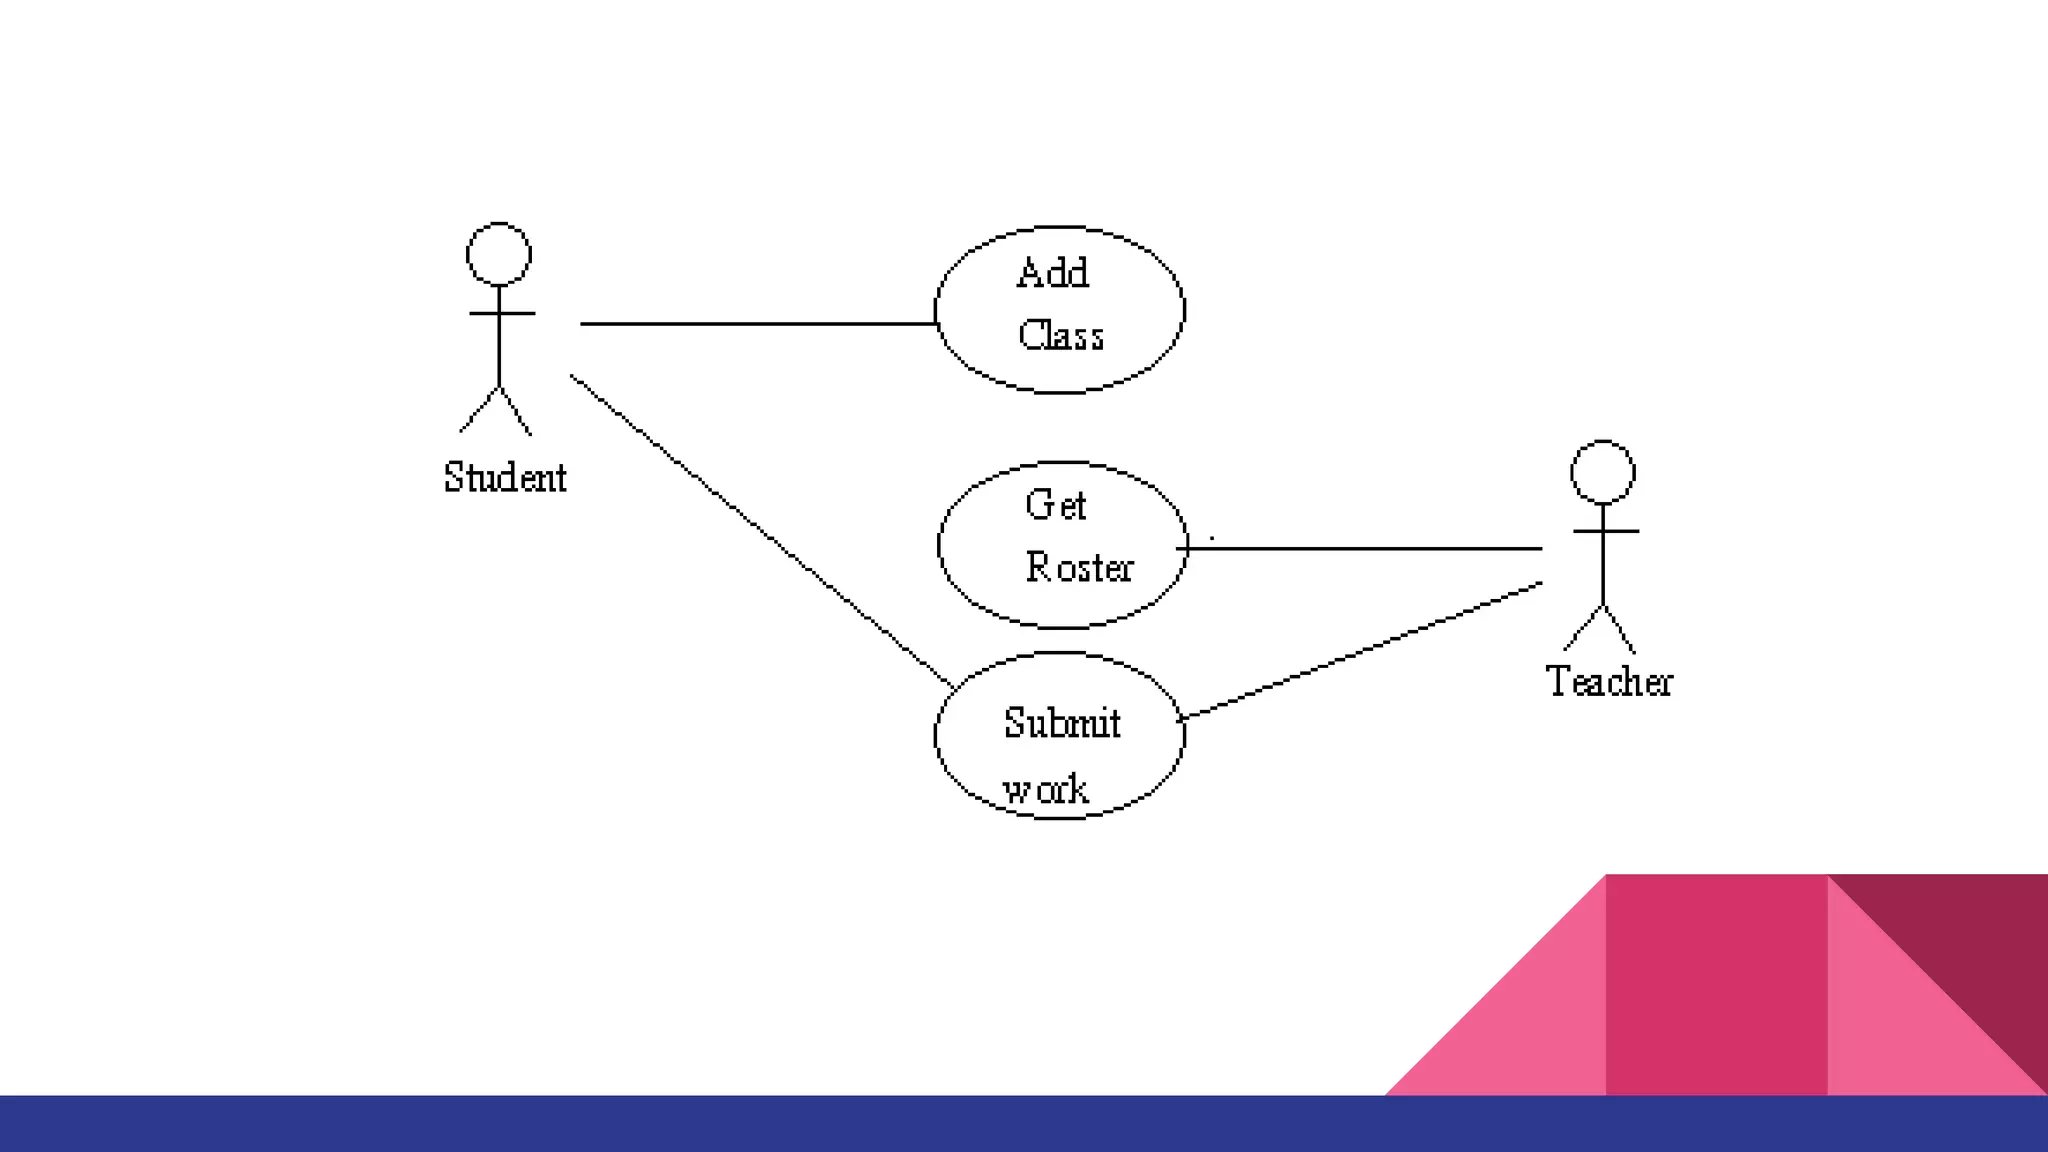
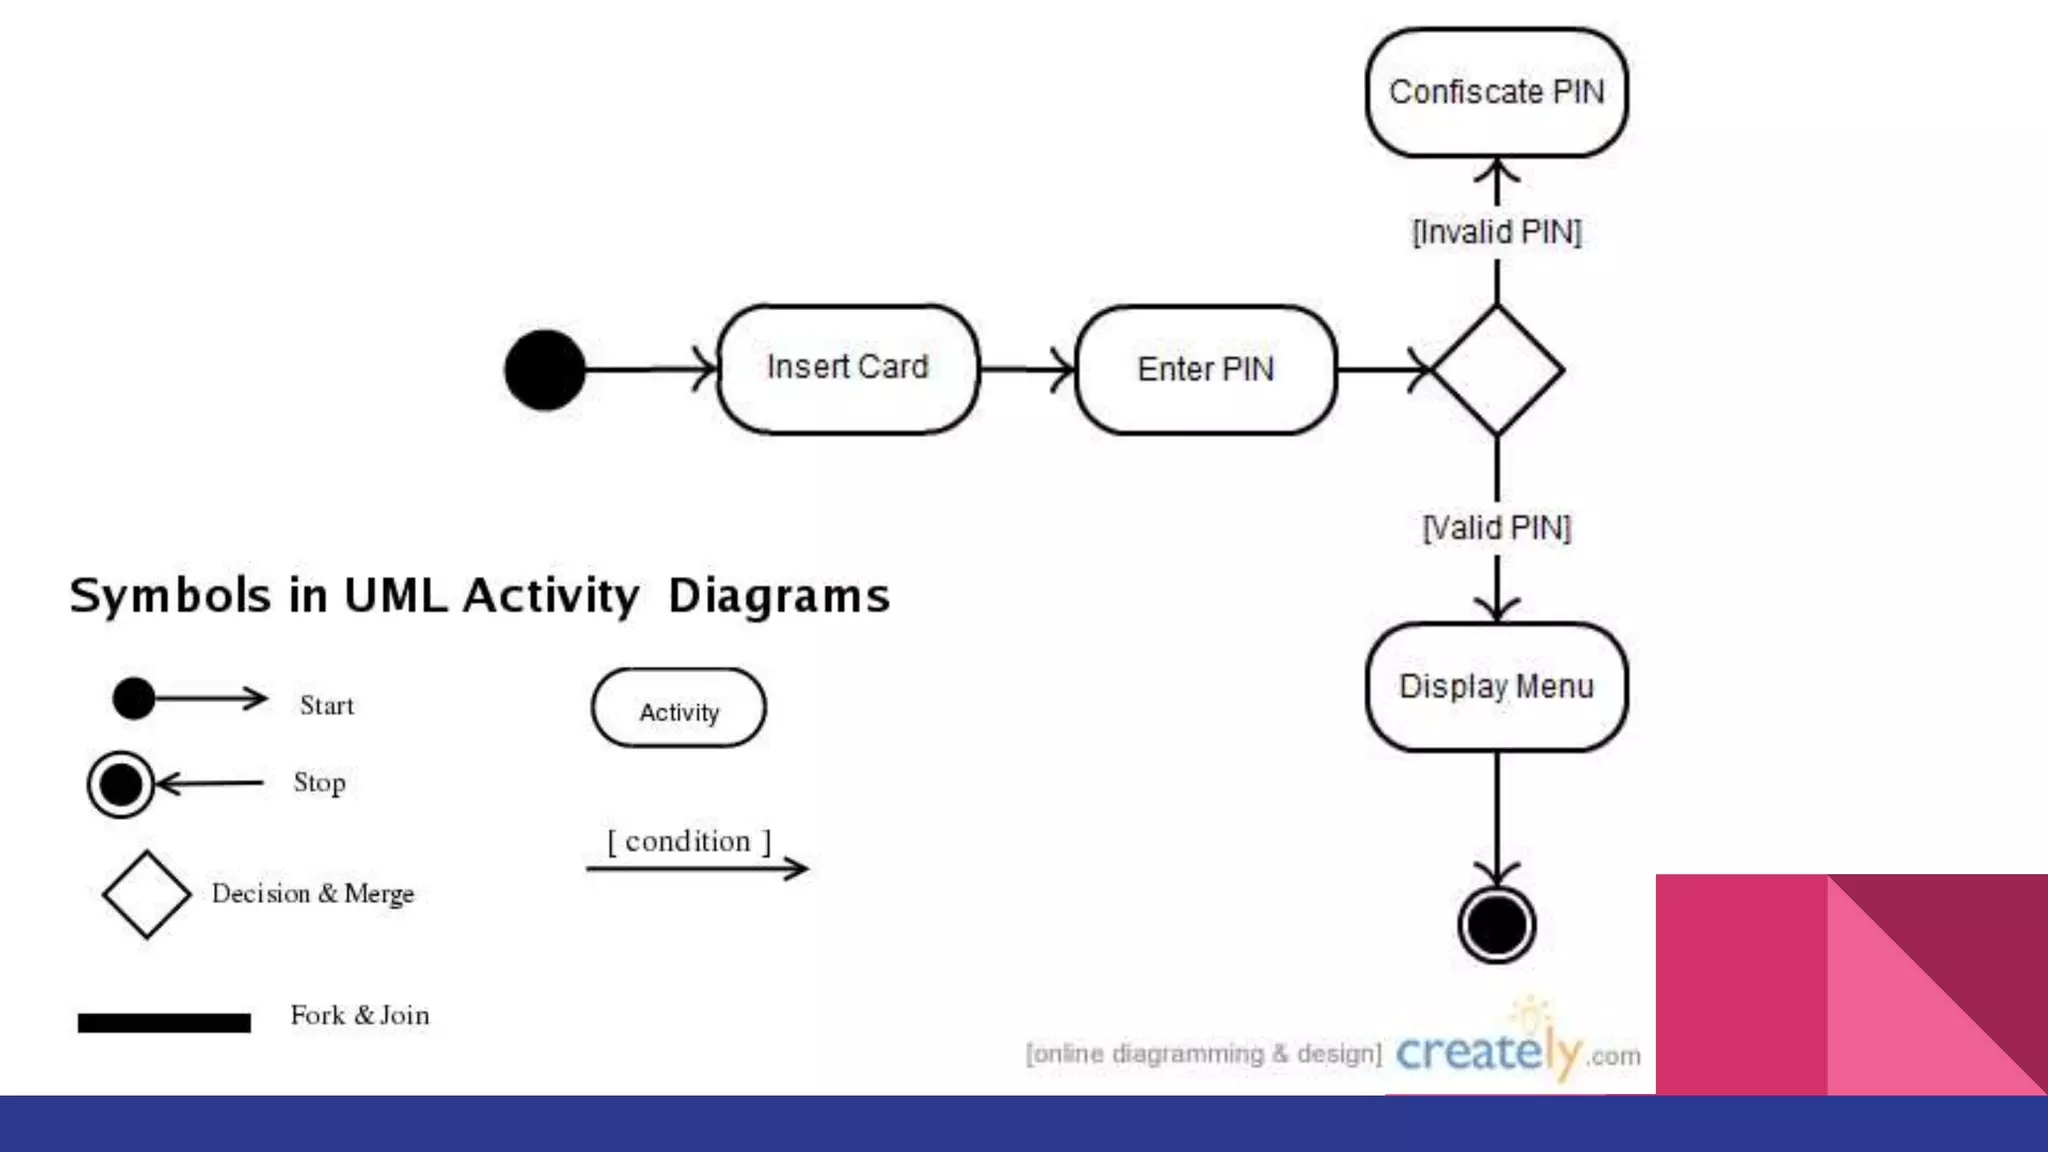
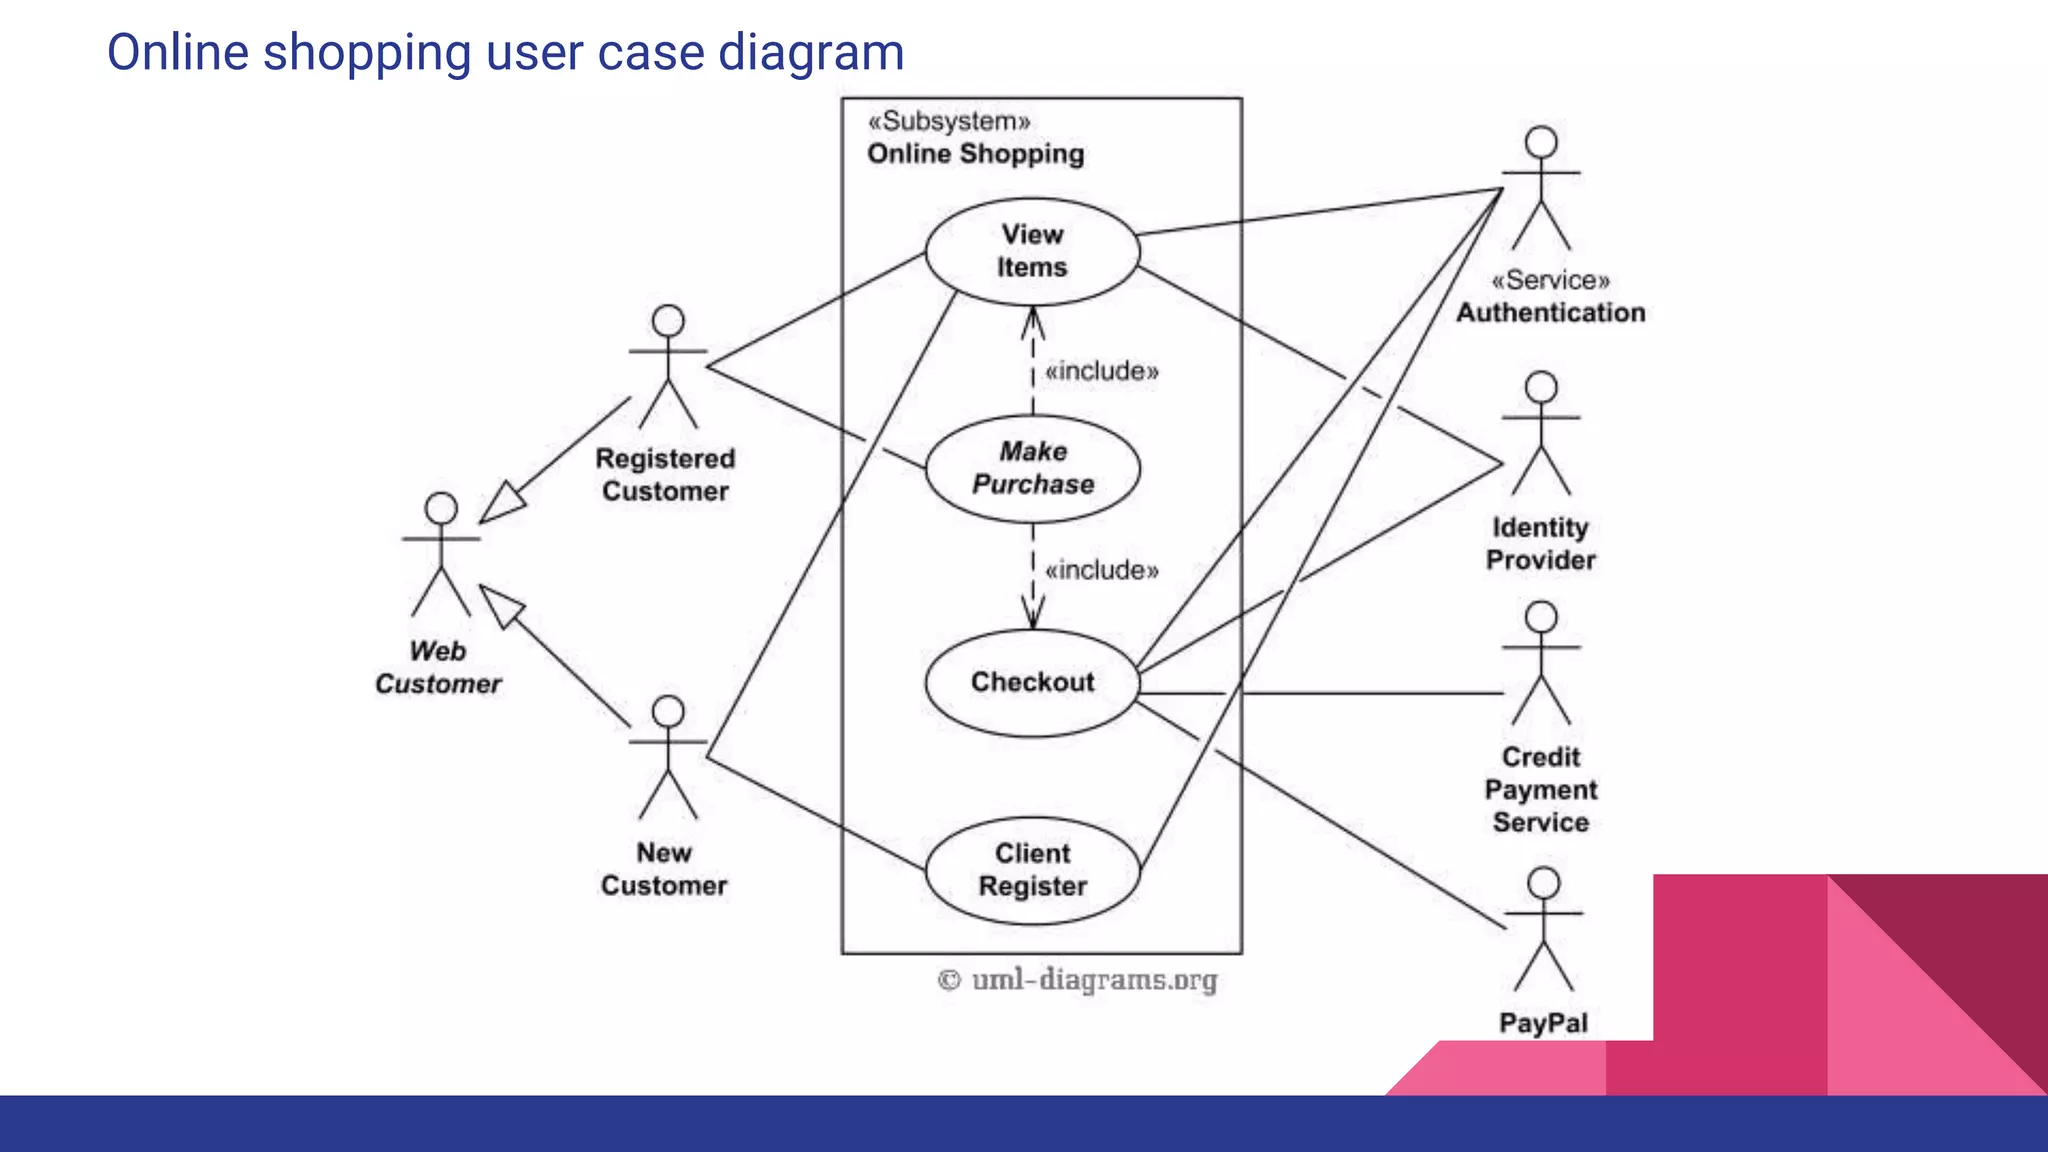
User case diagrams for depicting actors and use cases, and activity diagrams for graphical representation of workflows.
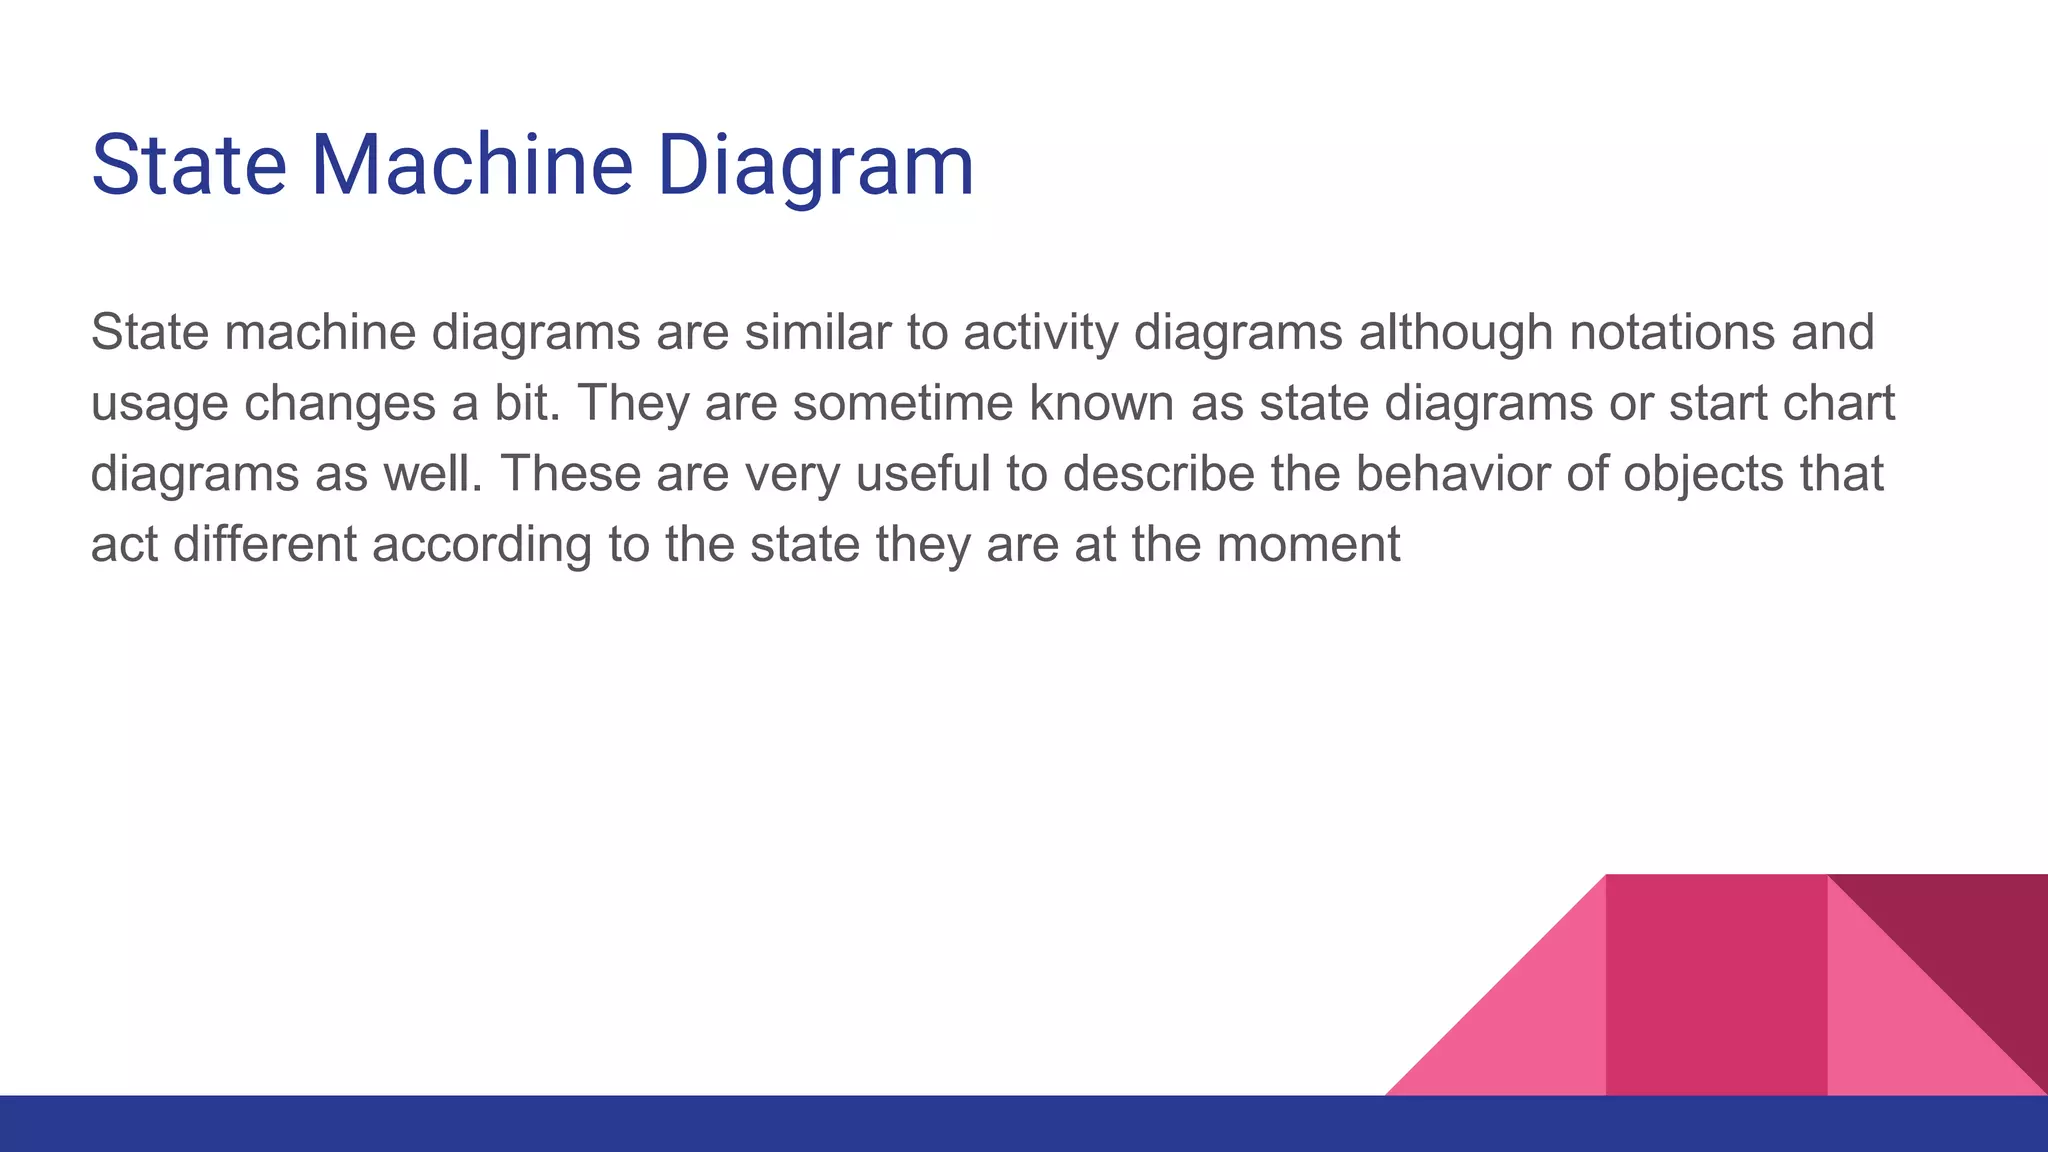
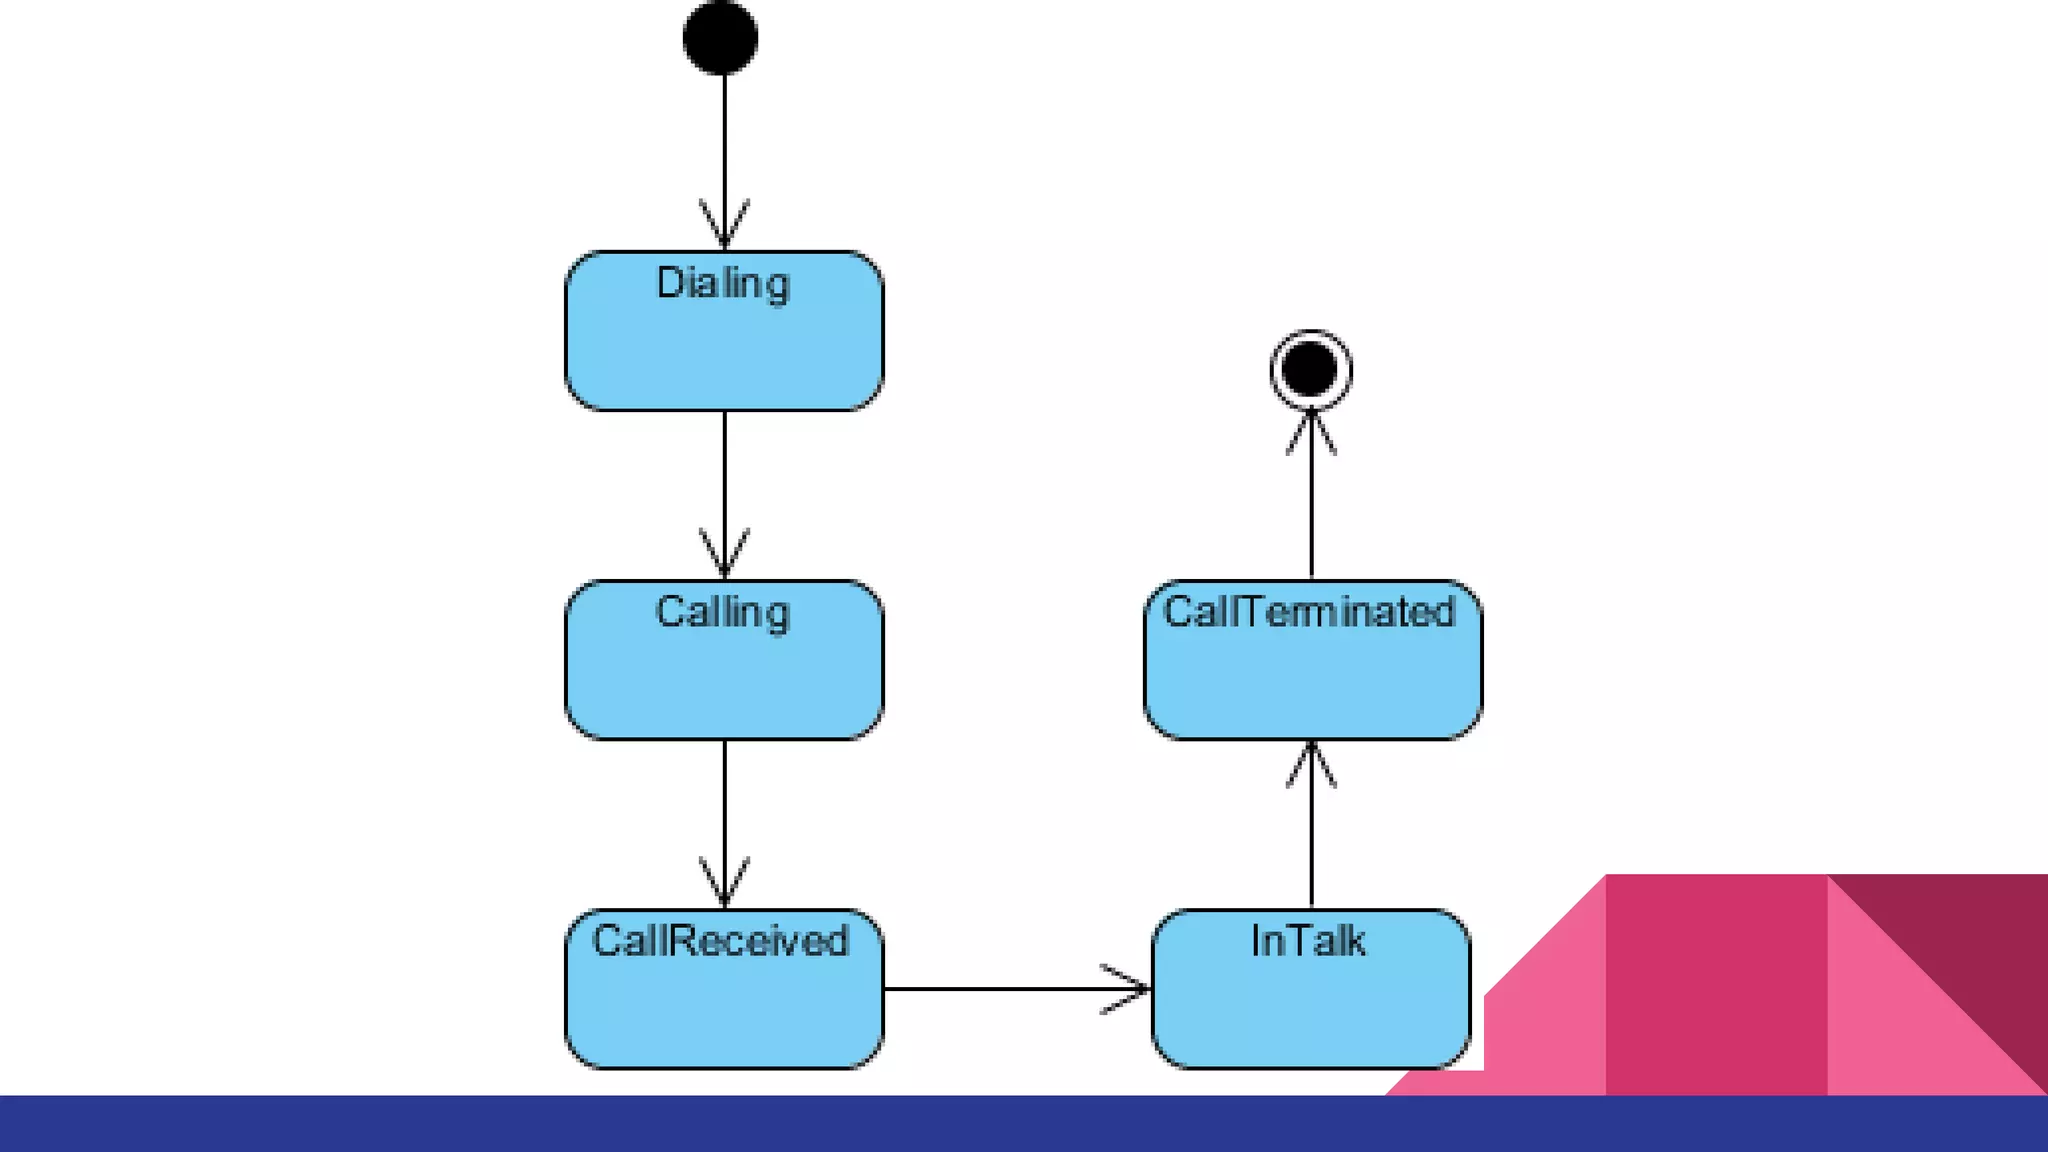
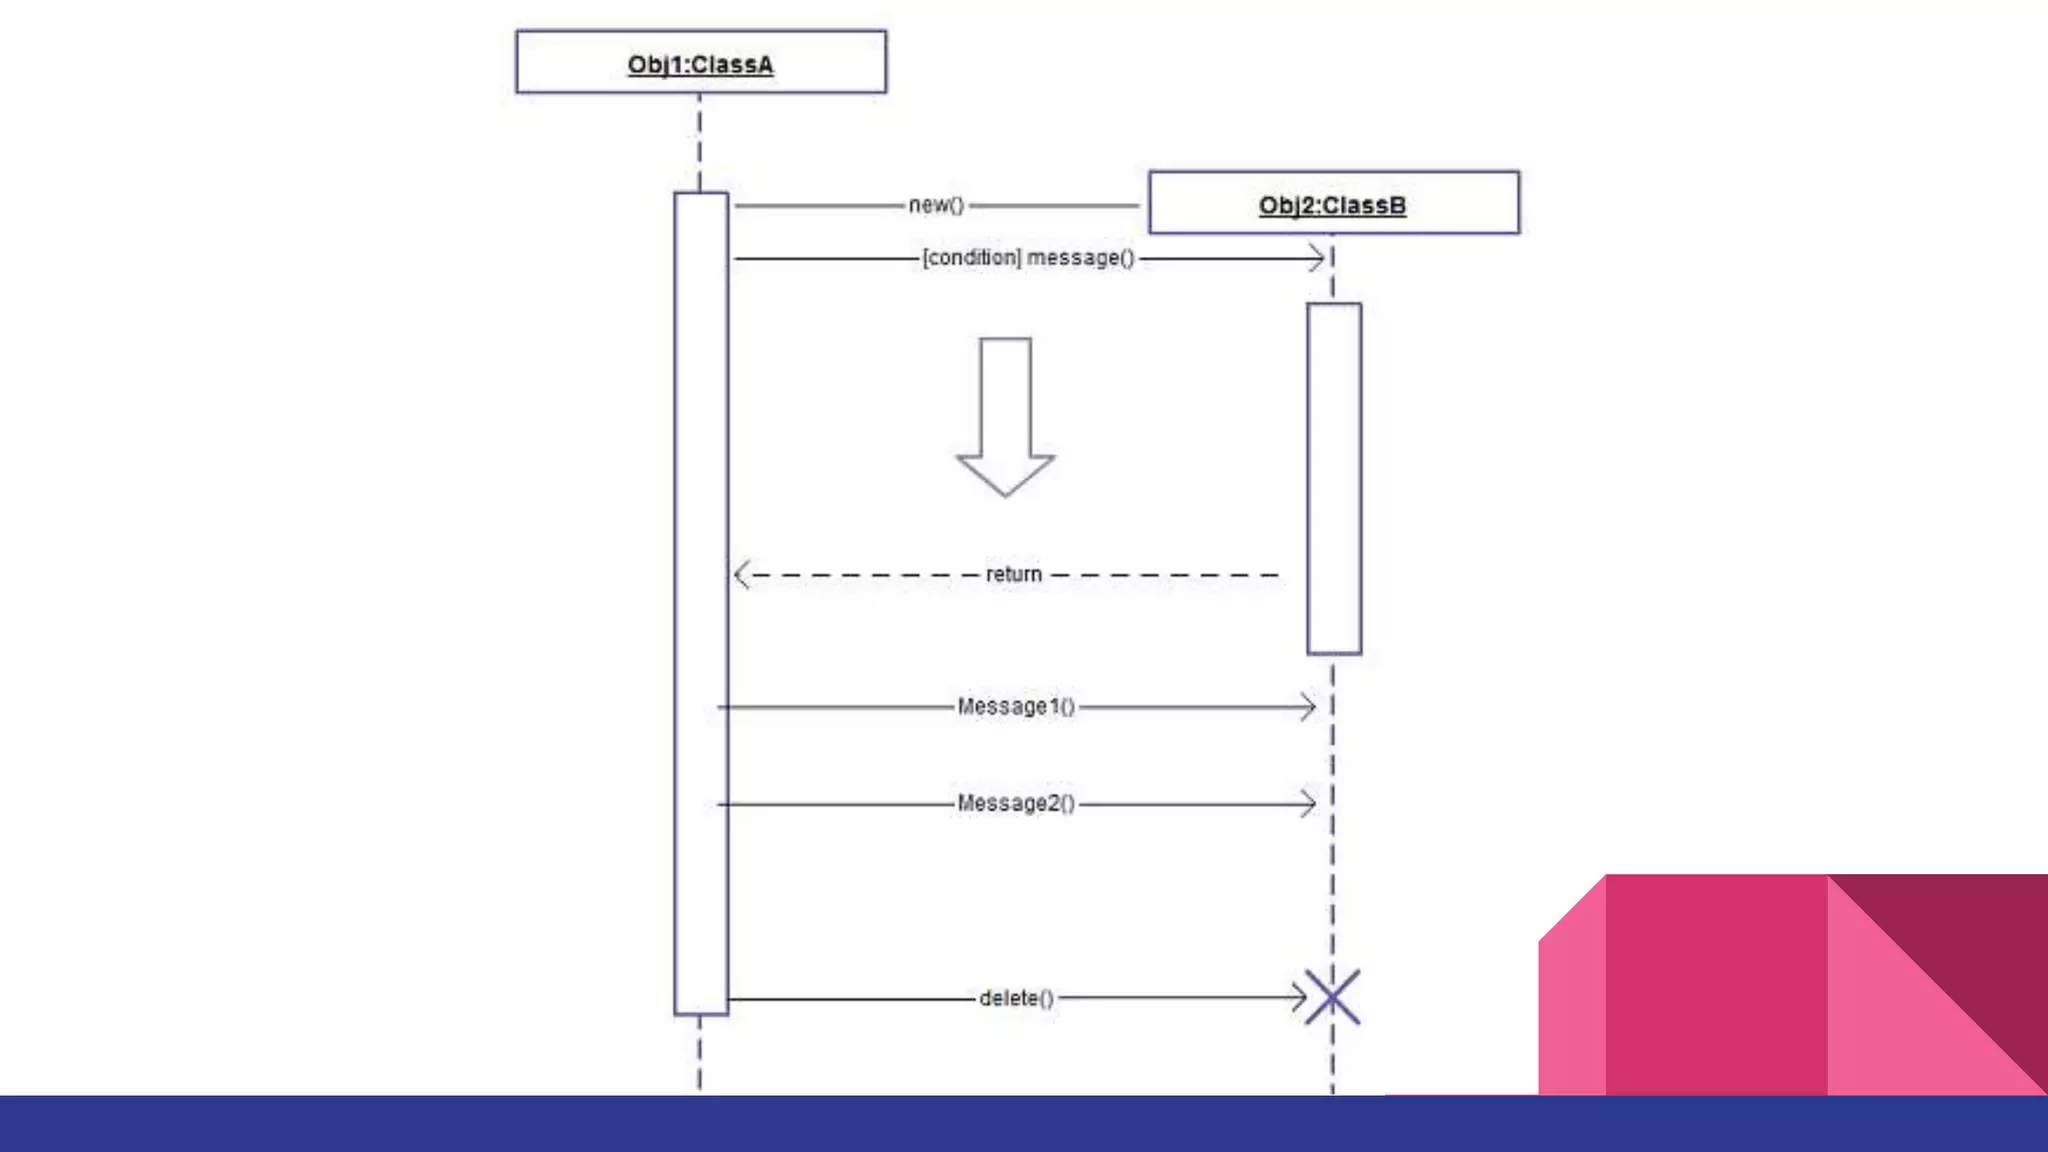
Description of state machine diagrams for object behavior based on states and sequence diagrams for object interaction.
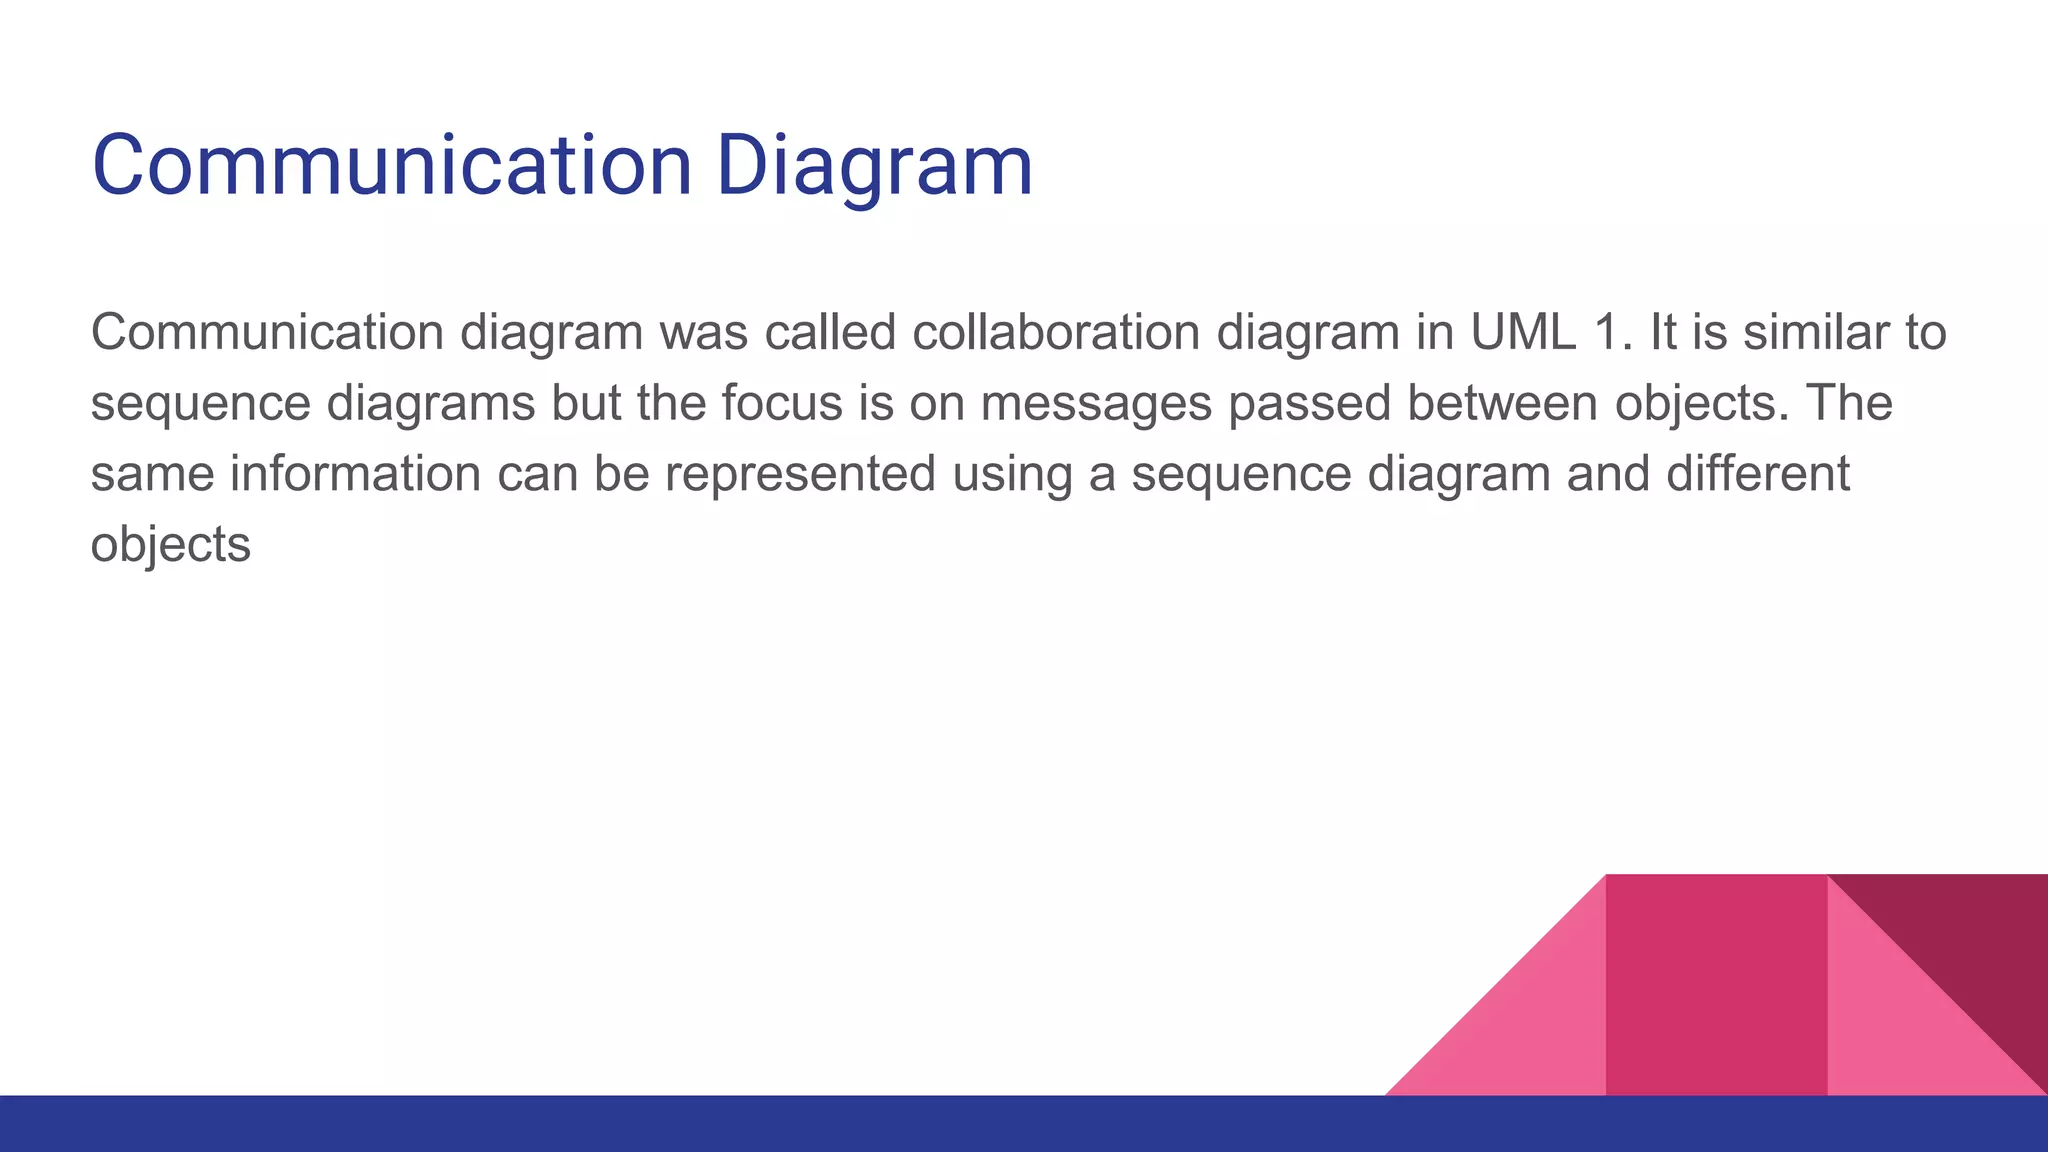
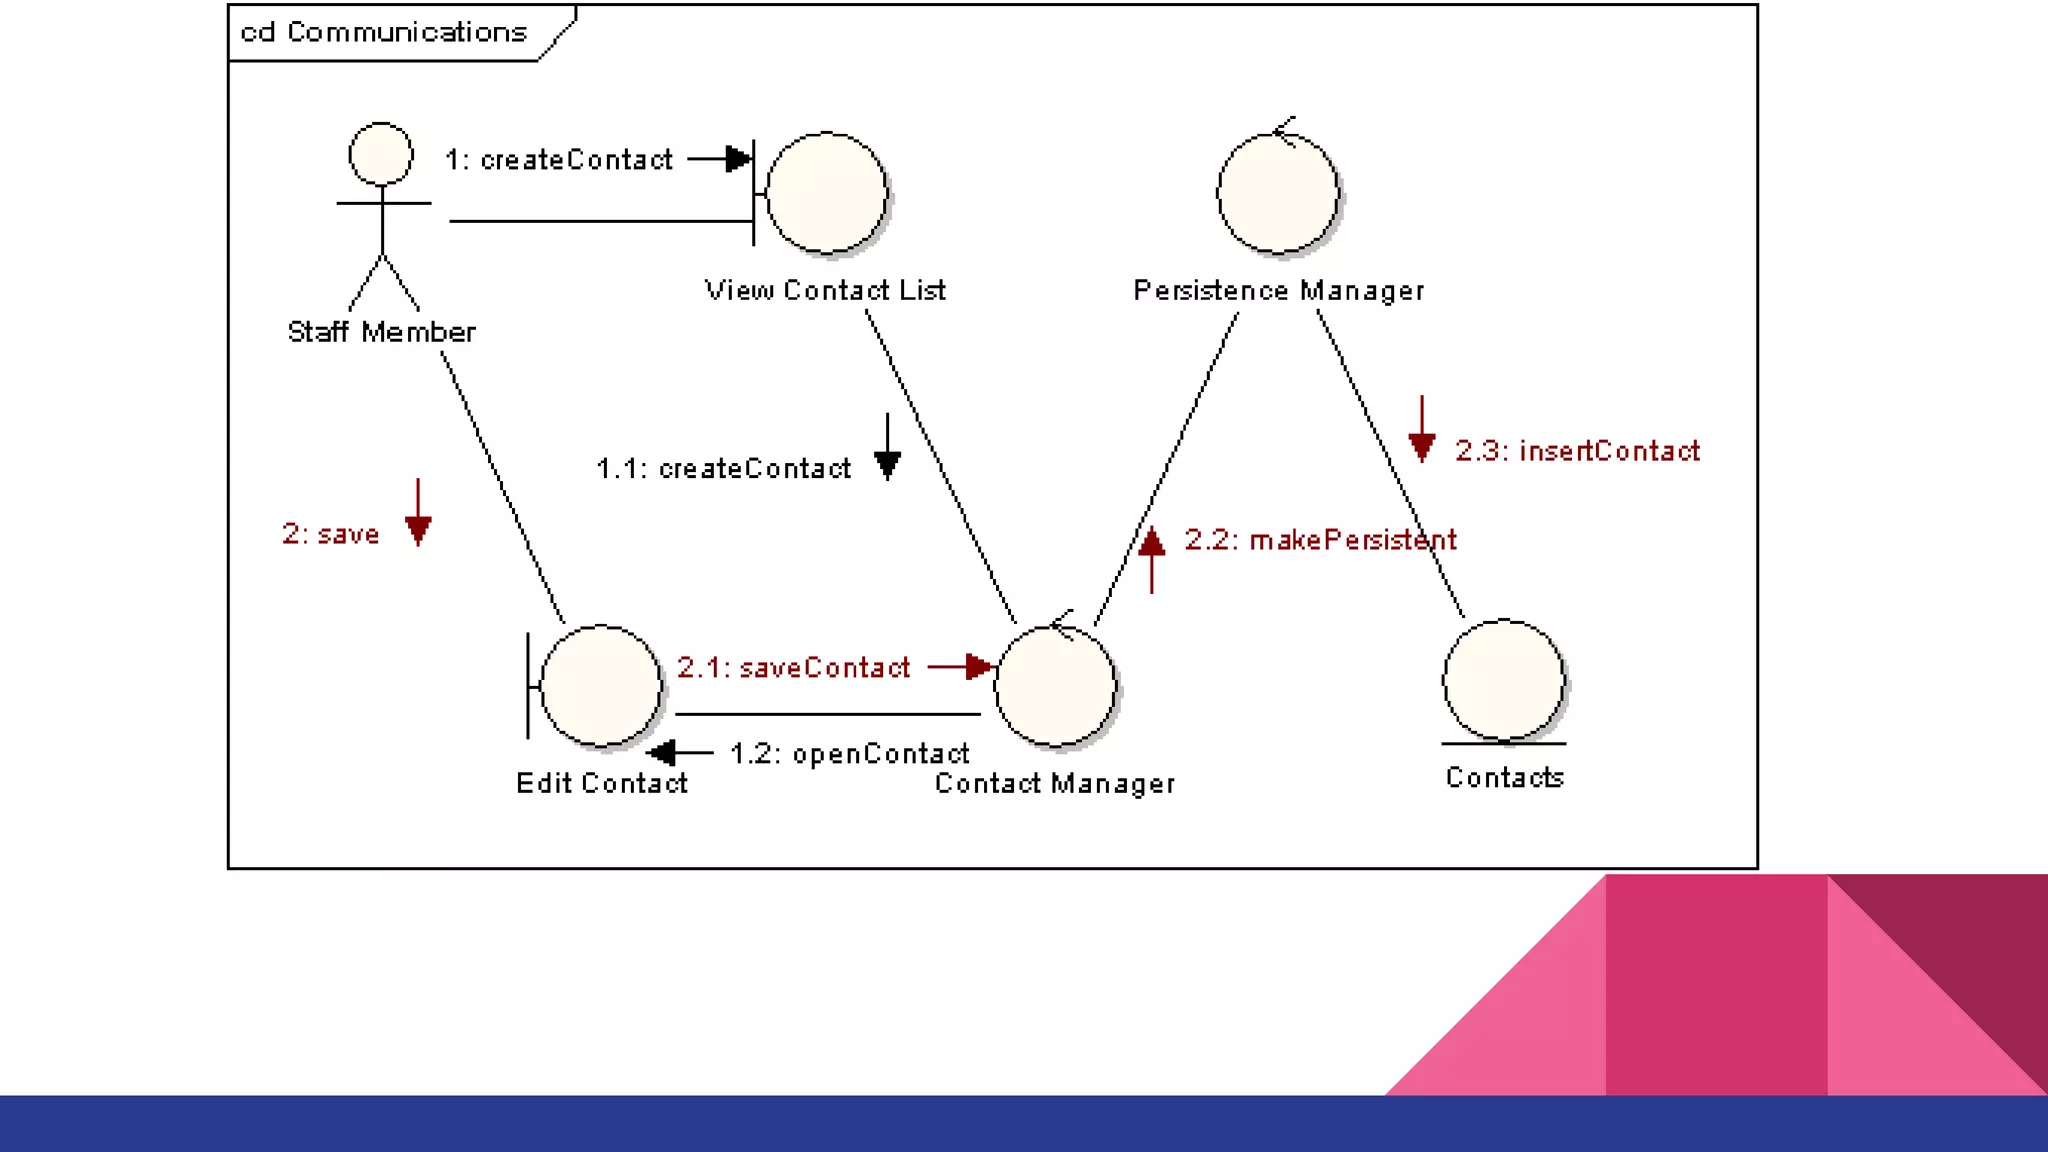
Introduction to communication diagrams and examples related to online shopping, including use case and activity diagrams.


![Vibe Coding vs. Spec-Driven Development [Free Meetup]](https://cdn.slidesharecdn.com/ss_thumbnails/vibecodingvsspecdrivendevelopment-251209105622-43f455e7-thumbnail.jpg?width=640&height=640&fit=bounds)


