Downloaded 21 times

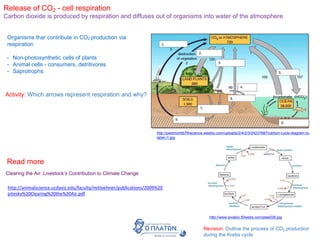


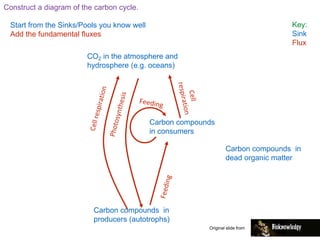

![Construct a diagram of the carbon cycle.
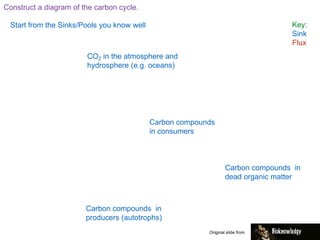
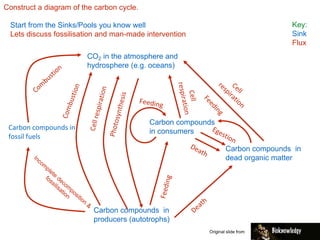
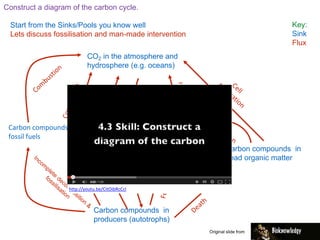
Start from the Sinks/Pools you know well
Lets discuss fossilisation and man-made intervention
Key:
Sink
Flux
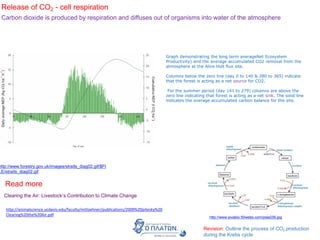
CO2 in the atmosphere and
hydrosphere (e.g. oceans)
Carbon compounds in
producers (autotrophs)
Carbon compounds
in consumers
Carbon compounds in
dead organic matter
Carbon compounds in
fossil fuels
Original slide from
Extend your understanding:
Between which sinks would you add a flux showing volcanoes and the weathering of
rocks?
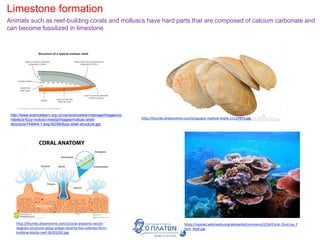
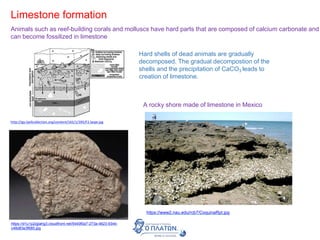
What additional sink would you add to show the role of corals and shellfish? What
additional flux would be needed?
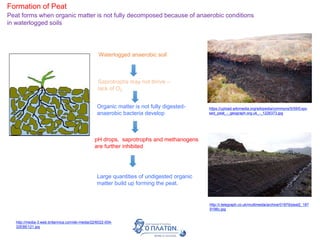
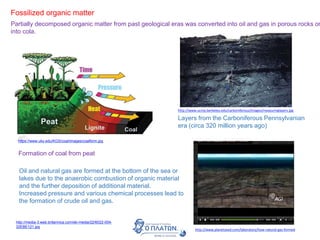
In some environments water is unable to drain out of soils so they become
waterlogged and anaerobic. This prevents the decomposition of dead organic matter
forming peat deposits [4.3.U7]. Peat can be dried and burnt as a fuel. Suggest how
peat could be added to the carbon cycle.
Explain why fossil fuels are classified as non-renewable resources when the carbon
cycle indicates they are renewed (hint: refer to the pictorial carbon cycle).
Diffusion is a flux that moves CO2 from the atmosphere to the hydrosphere and back
again. Taken together these fluxes are largest in the cycle suggest why.](https://image.slidesharecdn.com/120916-43carboncycle-161002083758/85/4-3-Carbon-cycling-35-320.jpg)


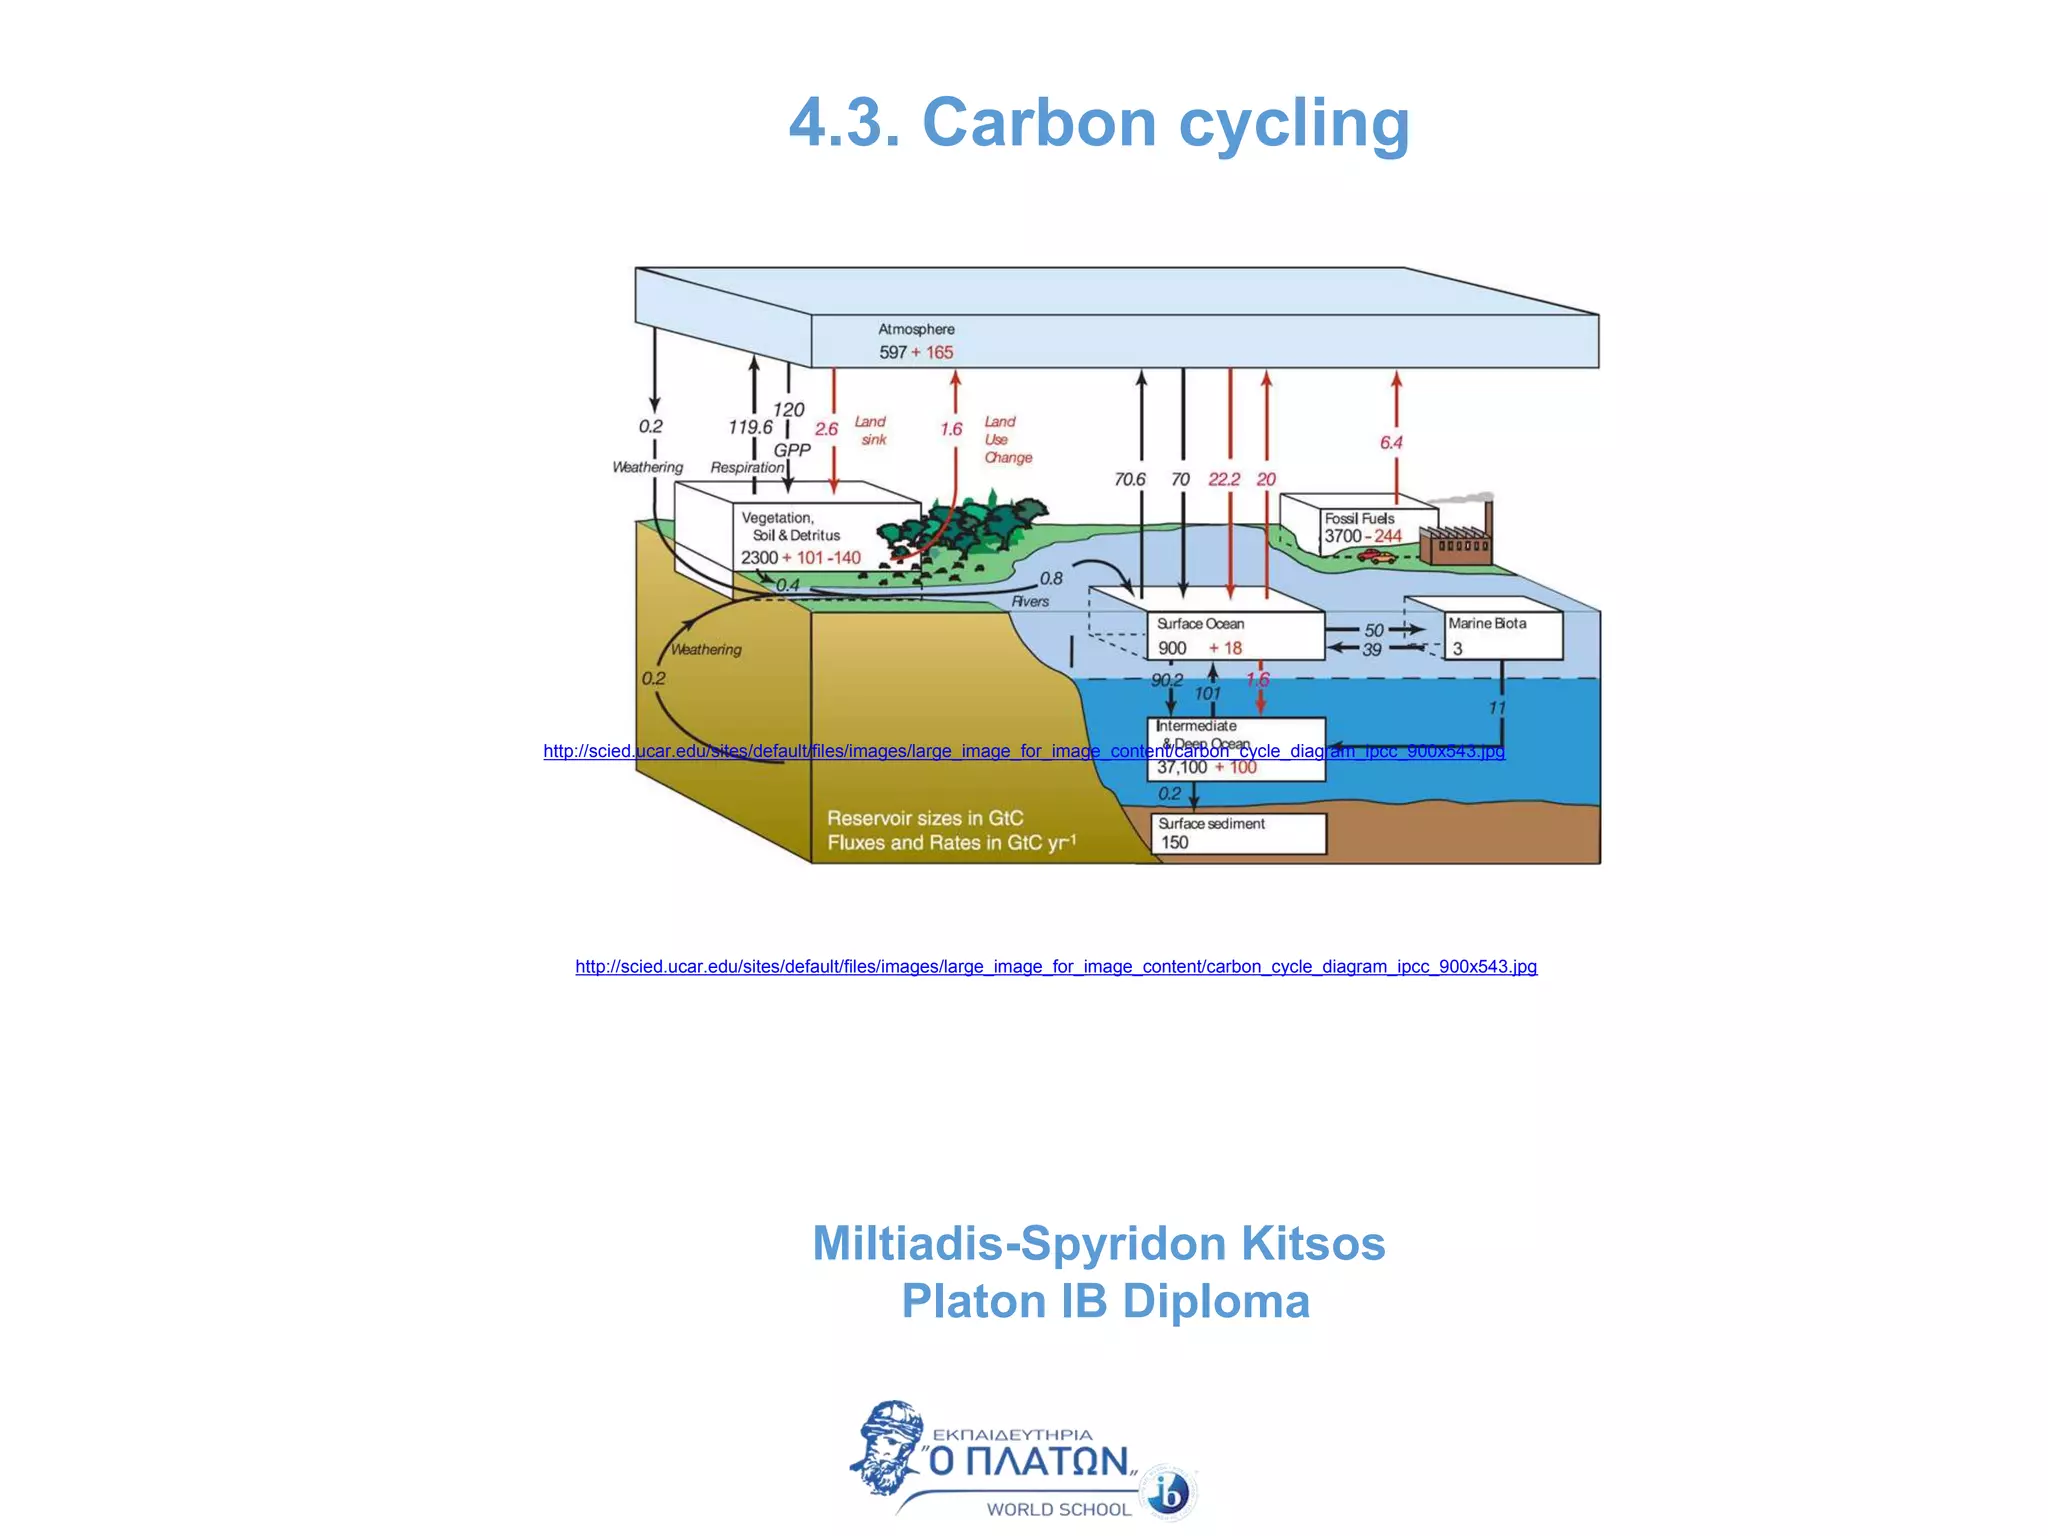
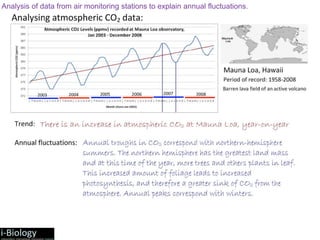
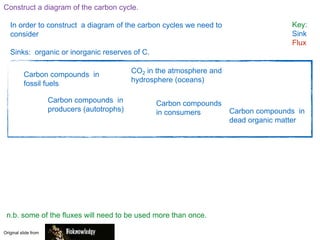
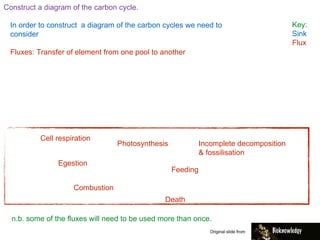
The document summarizes key aspects of the carbon cycle: 1) It outlines the major carbon reservoirs or sinks including the atmosphere, hydrosphere, organic matter in producers and consumers, dead organic matter, and fossil fuels. 2) It describes the major fluxes or transfers between reservoirs, such as photosynthesis, respiration, decomposition, fossilization, and combustion. 3) It notes that constructing a full diagram of the carbon cycle requires identifying both the key sinks and fluxes, and discussing processes like fossilization and human impacts.


