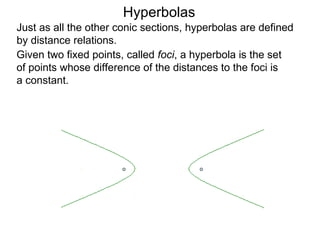
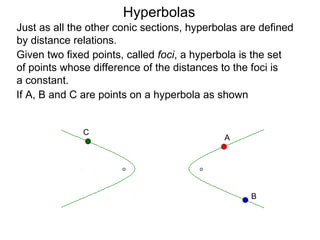
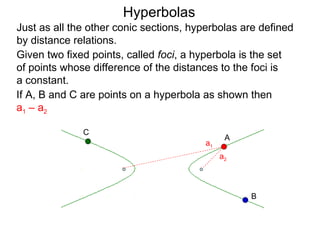
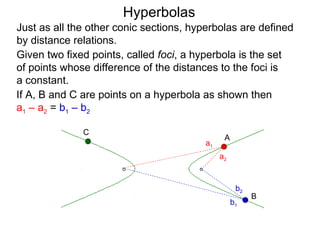
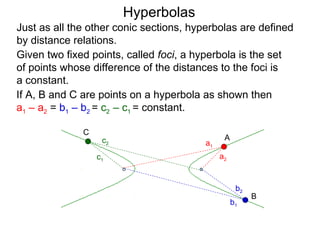
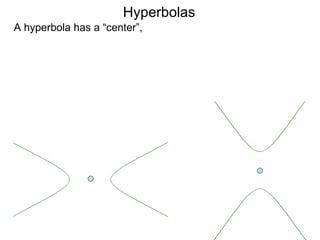
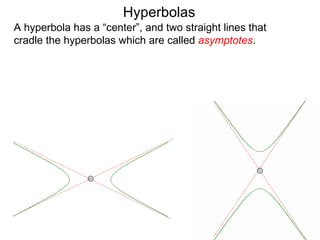
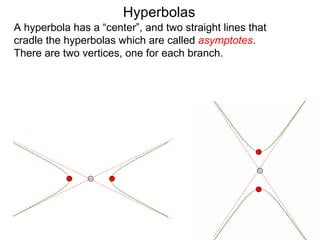
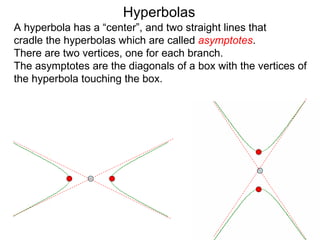
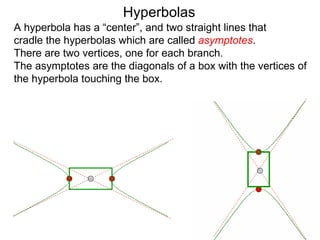
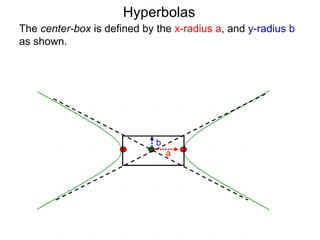
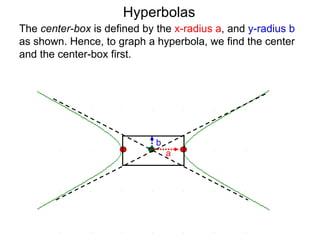
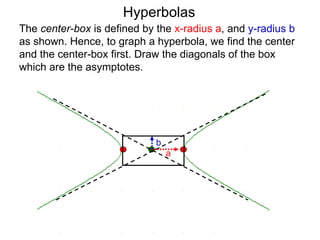
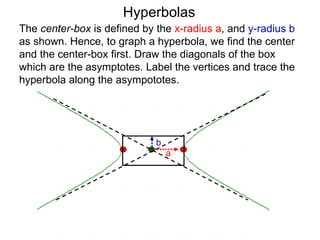
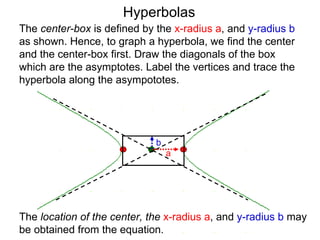
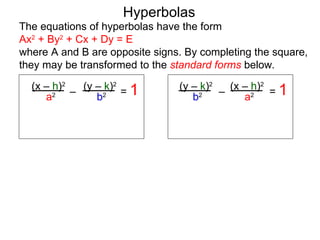
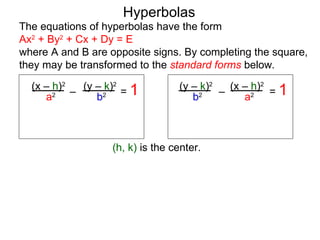
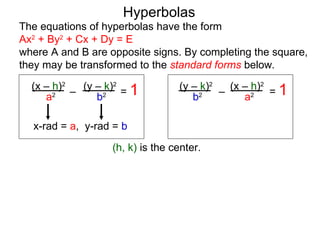
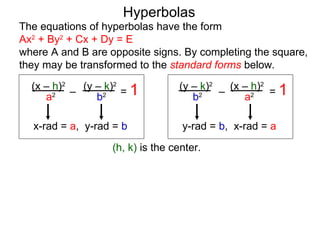
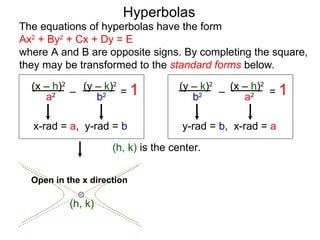
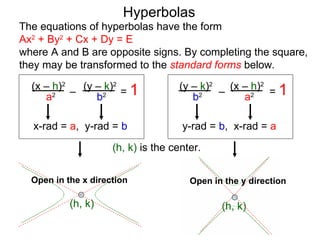
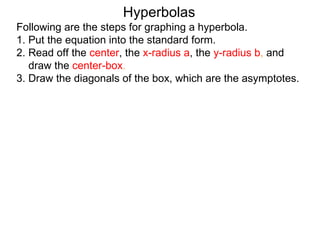
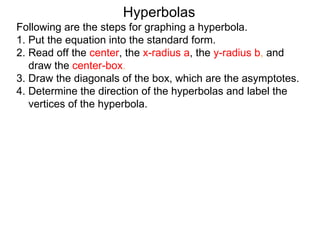
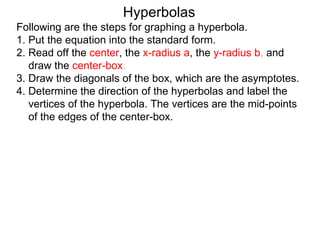
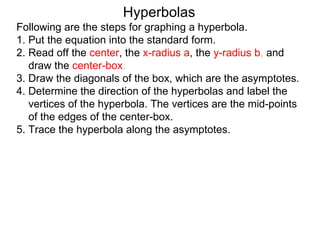
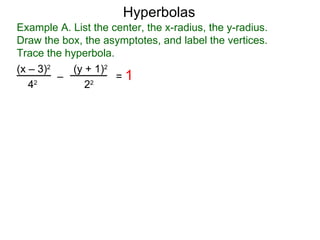
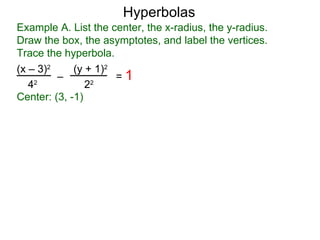
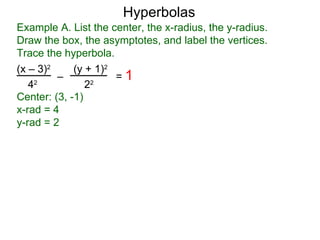
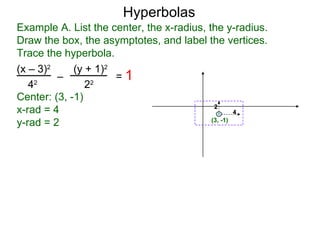
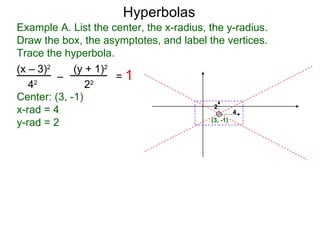
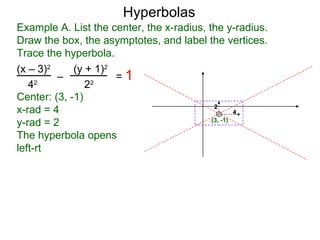
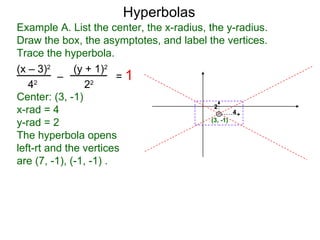
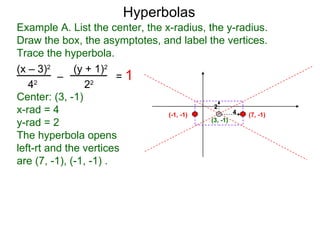
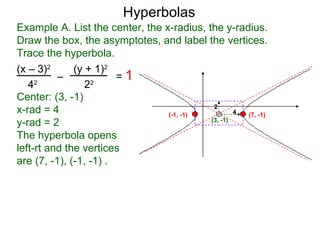
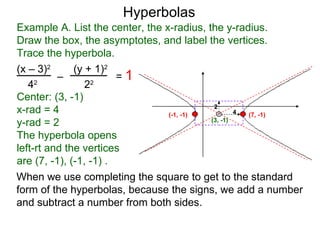
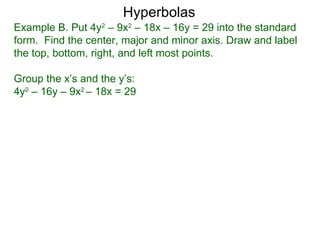
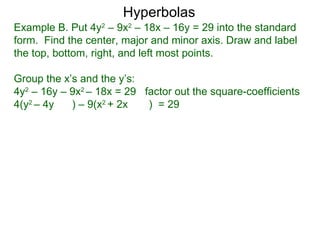
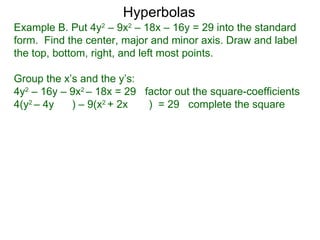
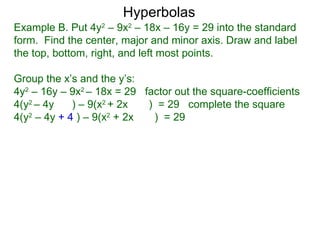
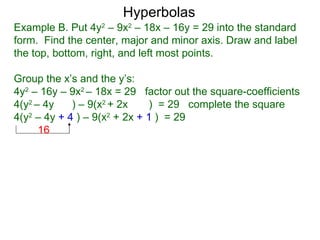
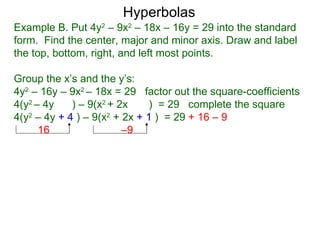
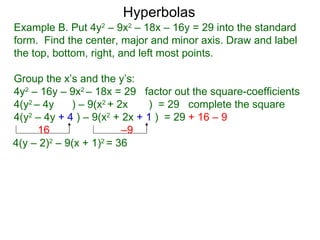
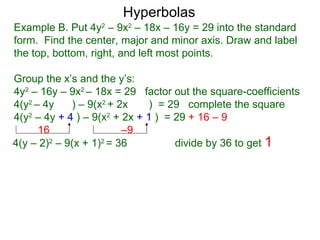
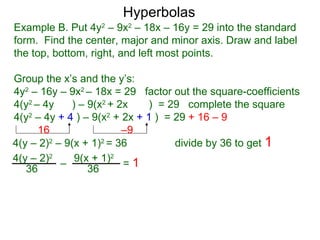
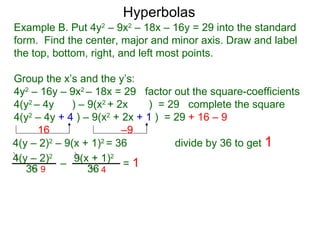
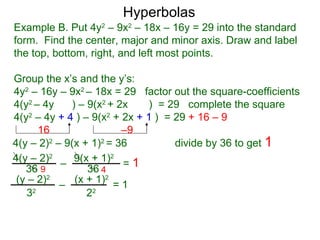
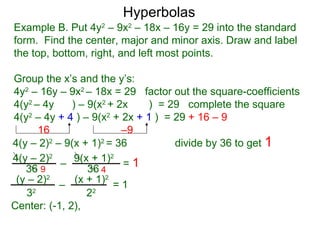
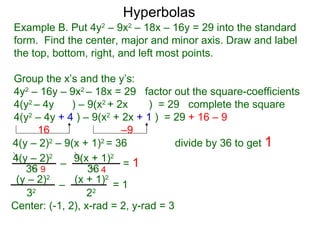
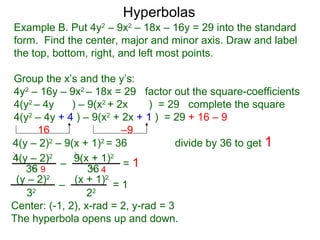
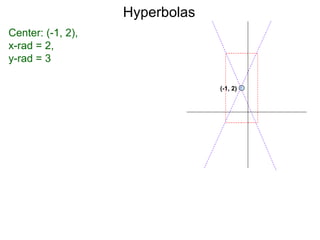
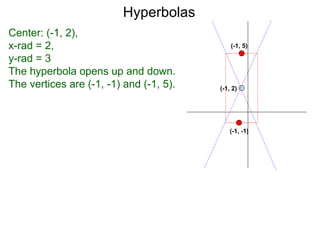
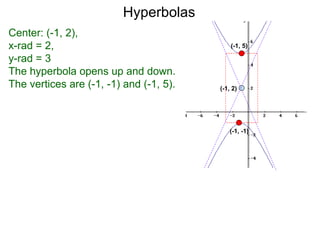
Hyperbolas are defined by the difference between distances to two fixed points called foci. A hyperbola consists of all points where this difference is a constant. It has two branches, two vertices, and two asymptotes which are the diagonals of an invisible box defined by the hyperbola's x-radius and y-radius. To graph a hyperbola, one puts its equation into standard form to determine the center, radii, and direction of opening, then draws the corresponding box and curves.
This is a powerpoint presentation that discusses about the topic or lesson: Conic Sections. It also includes the definition, types and some terminologies involved in the topic: Conic Sections.
This presentation describes the mathematics of conical curves (circles, ellipse, parabolas, hyperbolas) obtained by intersecting a right circular conical surface and a plane..
Please send comments and suggestions to improvements to solo.hermelin@gmail.com.
More presentations can be found at my website http://www.solohermelin.com.
Part of the Figures could not be unloaded, so I suggest to see this presentation in my website..
Why You Should Replace Windows 11 with Nitrux Linux 3.5.0 for enhanced perfor...SOFTTECHHUB
The choice of an operating system plays a pivotal role in shaping our computing experience. For decades, Microsoft's Windows has dominated the market, offering a familiar and widely adopted platform for personal and professional use. However, as technological advancements continue to push the boundaries of innovation, alternative operating systems have emerged, challenging the status quo and offering users a fresh perspective on computing.
One such alternative that has garnered significant attention and acclaim is Nitrux Linux 3.5.0, a sleek, powerful, and user-friendly Linux distribution that promises to redefine the way we interact with our devices. With its focus on performance, security, and customization, Nitrux Linux presents a compelling case for those seeking to break free from the constraints of proprietary software and embrace the freedom and flexibility of open-source computing.
Smart TV Buyer Insights Survey 2024 by 91mobiles.pdf91mobiles
91mobiles recently conducted a Smart TV Buyer Insights Survey in which we asked over 3,000 respondents about the TV they own, aspects they look at on a new TV, and their TV buying preferences.
DevOps and Testing slides at DASA ConnectKari Kakkonen
My and Rik Marselis slides at 30.5.2024 DASA Connect conference. We discuss about what is testing, then what is agile testing and finally what is Testing in DevOps. Finally we had lovely workshop with the participants trying to find out different ways to think about quality and testing in different parts of the DevOps infinity loop.
In his public lecture, Christian Timmerer provides insights into the fascinating history of video streaming, starting from its humble beginnings before YouTube to the groundbreaking technologies that now dominate platforms like Netflix and ORF ON. Timmerer also presents provocative contributions of his own that have significantly influenced the industry. He concludes by looking at future challenges and invites the audience to join in a discussion.
Essentials of Automations: The Art of Triggers and Actions in FMESafe Software
In this second installment of our Essentials of Automations webinar series, we’ll explore the landscape of triggers and actions, guiding you through the nuances of authoring and adapting workspaces for seamless automations. Gain an understanding of the full spectrum of triggers and actions available in FME, empowering you to enhance your workspaces for efficient automation.
We’ll kick things off by showcasing the most commonly used event-based triggers, introducing you to various automation workflows like manual triggers, schedules, directory watchers, and more. Plus, see how these elements play out in real scenarios.
Whether you’re tweaking your current setup or building from the ground up, this session will arm you with the tools and insights needed to transform your FME usage into a powerhouse of productivity. Join us to discover effective strategies that simplify complex processes, enhancing your productivity and transforming your data management practices with FME. Let’s turn complexity into clarity and make your workspaces work wonders!
UiPath Test Automation using UiPath Test Suite series, part 5DianaGray10
Welcome to UiPath Test Automation using UiPath Test Suite series part 5. In this session, we will cover CI/CD with devops.
Topics covered:
CI/CD with in UiPath
End-to-end overview of CI/CD pipeline with Azure devops
Speaker:
Lyndsey Byblow, Test Suite Sales Engineer @ UiPath, Inc.
Climate Impact of Software Testing at Nordic Testing DaysKari Kakkonen
My slides at Nordic Testing Days 6.6.2024
Climate impact / sustainability of software testing discussed on the talk. ICT and testing must carry their part of global responsibility to help with the climat warming. We can minimize the carbon footprint but we can also have a carbon handprint, a positive impact on the climate. Quality characteristics can be added with sustainability, and then measured continuously. Test environments can be used less, and in smaller scale and on demand. Test techniques can be used in optimizing or minimizing number of tests. Test automation can be used to speed up testing.
GraphSummit Singapore | The Future of Agility: Supercharging Digital Transfor...Neo4j
Leonard Jayamohan, Partner & Generative AI Lead, Deloitte
This keynote will reveal how Deloitte leverages Neo4j’s graph power for groundbreaking digital twin solutions, achieving a staggering 100x performance boost. Discover the essential role knowledge graphs play in successful generative AI implementations. Plus, get an exclusive look at an innovative Neo4j + Generative AI solution Deloitte is developing in-house.
Observability Concepts EVERY Developer Should Know -- DeveloperWeek Europe.pdfPaige Cruz
Monitoring and observability aren’t traditionally found in software curriculums and many of us cobble this knowledge together from whatever vendor or ecosystem we were first introduced to and whatever is a part of your current company’s observability stack.
While the dev and ops silo continues to crumble….many organizations still relegate monitoring & observability as the purview of ops, infra and SRE teams. This is a mistake - achieving a highly observable system requires collaboration up and down the stack.
I, a former op, would like to extend an invitation to all application developers to join the observability party will share these foundational concepts to build on:
Securing your Kubernetes cluster_ a step-by-step guide to success !KatiaHIMEUR1
Today, after several years of existence, an extremely active community and an ultra-dynamic ecosystem, Kubernetes has established itself as the de facto standard in container orchestration. Thanks to a wide range of managed services, it has never been so easy to set up a ready-to-use Kubernetes cluster.
However, this ease of use means that the subject of security in Kubernetes is often left for later, or even neglected. This exposes companies to significant risks.
In this talk, I'll show you step-by-step how to secure your Kubernetes cluster for greater peace of mind and reliability.
GDG Cloud Southlake #33: Boule & Rebala: Effective AppSec in SDLC using Deplo...James Anderson
Effective Application Security in Software Delivery lifecycle using Deployment Firewall and DBOM
The modern software delivery process (or the CI/CD process) includes many tools, distributed teams, open-source code, and cloud platforms. Constant focus on speed to release software to market, along with the traditional slow and manual security checks has caused gaps in continuous security as an important piece in the software supply chain. Today organizations feel more susceptible to external and internal cyber threats due to the vast attack surface in their applications supply chain and the lack of end-to-end governance and risk management.
The software team must secure its software delivery process to avoid vulnerability and security breaches. This needs to be achieved with existing tool chains and without extensive rework of the delivery processes. This talk will present strategies and techniques for providing visibility into the true risk of the existing vulnerabilities, preventing the introduction of security issues in the software, resolving vulnerabilities in production environments quickly, and capturing the deployment bill of materials (DBOM).
Speakers:
Bob Boule
Robert Boule is a technology enthusiast with PASSION for technology and making things work along with a knack for helping others understand how things work. He comes with around 20 years of solution engineering experience in application security, software continuous delivery, and SaaS platforms. He is known for his dynamic presentations in CI/CD and application security integrated in software delivery lifecycle.
Gopinath Rebala
Gopinath Rebala is the CTO of OpsMx, where he has overall responsibility for the machine learning and data processing architectures for Secure Software Delivery. Gopi also has a strong connection with our customers, leading design and architecture for strategic implementations. Gopi is a frequent speaker and well-known leader in continuous delivery and integrating security into software delivery.
GraphRAG is All You need? LLM & Knowledge GraphGuy Korland
Guy Korland, CEO and Co-founder of FalkorDB, will review two articles on the integration of language models with knowledge graphs.
1. Unifying Large Language Models and Knowledge Graphs: A Roadmap.
https://arxiv.org/abs/2306.08302
2. Microsoft Research's GraphRAG paper and a review paper on various uses of knowledge graphs:
https://www.microsoft.com/en-us/research/blog/graphrag-unlocking-llm-discovery-on-narrative-private-data/
State of ICS and IoT Cyber Threat Landscape Report 2024 previewPrayukth K V
The IoT and OT threat landscape report has been prepared by the Threat Research Team at Sectrio using data from Sectrio, cyber threat intelligence farming facilities spread across over 85 cities around the world. In addition, Sectrio also runs AI-based advanced threat and payload engagement facilities that serve as sinks to attract and engage sophisticated threat actors, and newer malware including new variants and latent threats that are at an earlier stage of development.
The latest edition of the OT/ICS and IoT security Threat Landscape Report 2024 also covers:
State of global ICS asset and network exposure
Sectoral targets and attacks as well as the cost of ransom
Global APT activity, AI usage, actor and tactic profiles, and implications
Rise in volumes of AI-powered cyberattacks
Major cyber events in 2024
Malware and malicious payload trends
Cyberattack types and targets
Vulnerability exploit attempts on CVEs
Attacks on counties – USA
Expansion of bot farms – how, where, and why
In-depth analysis of the cyber threat landscape across North America, South America, Europe, APAC, and the Middle East
Why are attacks on smart factories rising?
Cyber risk predictions
Axis of attacks – Europe
Systemic attacks in the Middle East
Download the full report from here:
https://sectrio.com/resources/ot-threat-landscape-reports/sectrio-releases-ot-ics-and-iot-security-threat-landscape-report-2024/
Alt. GDG Cloud Southlake #33: Boule & Rebala: Effective AppSec in SDLC using ...James Anderson
Effective Application Security in Software Delivery lifecycle using Deployment Firewall and DBOM
The modern software delivery process (or the CI/CD process) includes many tools, distributed teams, open-source code, and cloud platforms. Constant focus on speed to release software to market, along with the traditional slow and manual security checks has caused gaps in continuous security as an important piece in the software supply chain. Today organizations feel more susceptible to external and internal cyber threats due to the vast attack surface in their applications supply chain and the lack of end-to-end governance and risk management.
The software team must secure its software delivery process to avoid vulnerability and security breaches. This needs to be achieved with existing tool chains and without extensive rework of the delivery processes. This talk will present strategies and techniques for providing visibility into the true risk of the existing vulnerabilities, preventing the introduction of security issues in the software, resolving vulnerabilities in production environments quickly, and capturing the deployment bill of materials (DBOM).
Speakers:
Bob Boule
Robert Boule is a technology enthusiast with PASSION for technology and making things work along with a knack for helping others understand how things work. He comes with around 20 years of solution engineering experience in application security, software continuous delivery, and SaaS platforms. He is known for his dynamic presentations in CI/CD and application security integrated in software delivery lifecycle.
Gopinath Rebala
Gopinath Rebala is the CTO of OpsMx, where he has overall responsibility for the machine learning and data processing architectures for Secure Software Delivery. Gopi also has a strong connection with our customers, leading design and architecture for strategic implementations. Gopi is a frequent speaker and well-known leader in continuous delivery and integrating security into software delivery.
GraphSummit Singapore | The Art of the Possible with Graph - Q2 2024Neo4j
Neha Bajwa, Vice President of Product Marketing, Neo4j
Join us as we explore breakthrough innovations enabled by interconnected data and AI. Discover firsthand how organizations use relationships in data to uncover contextual insights and solve our most pressing challenges – from optimizing supply chains, detecting fraud, and improving customer experiences to accelerating drug discoveries.
2. Hyperbolas
Just as all the other conic sections, hyperbolas are defined
by distance relations.
3. Hyperbolas
Just as all the other conic sections, hyperbolas are defined
by distance relations.
Given two fixed points, called foci, a hyperbola is the set
of points whose difference of the distances to the foci is
a constant.
4. Hyperbolas
Just as all the other conic sections, hyperbolas are defined
by distance relations.
Given two fixed points, called foci, a hyperbola is the set
of points whose difference of the distances to the foci is
a constant.
If A, B and C are points on a hyperbola as shown
C
A
B
5. Hyperbolas
Just as all the other conic sections, hyperbolas are defined
by distance relations.
Given two fixed points, called foci, a hyperbola is the set
of points whose difference of the distances to the foci is
a constant.
If A, B and C are points on a hyperbola as shown then
a1 – a2
C
A
a1
a2
B
6. Hyperbolas
Just as all the other conic sections, hyperbolas are defined
by distance relations.
Given two fixed points, called foci, a hyperbola is the set
of points whose difference of the distances to the foci is
a constant.
If A, B and C are points on a hyperbola as shown then
a1 – a2 = b1 – b2
C
A
a1
a2
b2
B
b1
7. Hyperbolas
Just as all the other conic sections, hyperbolas are defined
by distance relations.
Given two fixed points, called foci, a hyperbola is the set
of points whose difference of the distances to the foci is
a constant.
If A, B and C are points on a hyperbola as shown then
a1 – a2 = b1 – b2 = c2 – c1 = constant.
C
c2 A
a1
c1 a2
b2
B
b1
9. Hyperbolas
A hyperbola has a “center”, and two straight lines that
cradle the hyperbolas which are called asymptotes.
10. Hyperbolas
A hyperbola has a “center”, and two straight lines that
cradle the hyperbolas which are called asymptotes.
There are two vertices, one for each branch.
11. Hyperbolas
A hyperbola has a “center”, and two straight lines that
cradle the hyperbolas which are called asymptotes.
There are two vertices, one for each branch.
The asymptotes are the diagonals of a box with the vertices of
the hyperbola touching the box.
12. Hyperbolas
A hyperbola has a “center”, and two straight lines that
cradle the hyperbolas which are called asymptotes.
There are two vertices, one for each branch.
The asymptotes are the diagonals of a box with the vertices of
the hyperbola touching the box.
14. Hyperbolas
The center-box is defined by the x-radius a, and y-radius b
as shown. Hence, to graph a hyperbola, we find the center
and the center-box first.
b
a
15. Hyperbolas
The center-box is defined by the x-radius a, and y-radius b
as shown. Hence, to graph a hyperbola, we find the center
and the center-box first. Draw the diagonals of the box
which are the asymptotes.
b
a
16. Hyperbolas
The center-box is defined by the x-radius a, and y-radius b
as shown. Hence, to graph a hyperbola, we find the center
and the center-box first. Draw the diagonals of the box
which are the asymptotes. Label the vertices and trace the
hyperbola along the asympototes.
b
a
17. Hyperbolas
The center-box is defined by the x-radius a, and y-radius b
as shown. Hence, to graph a hyperbola, we find the center
and the center-box first. Draw the diagonals of the box
which are the asymptotes. Label the vertices and trace the
hyperbola along the asympototes.
b
a
The location of the center, the x-radius a, and y-radius b may
be obtained from the equation.
18. Hyperbolas
The equations of hyperbolas have the form
Ax2 + By2 + Cx + Dy = E
where A and B are opposite signs.
19. Hyperbolas
The equations of hyperbolas have the form
Ax2 + By2 + Cx + Dy = E
where A and B are opposite signs. By completing the square,
they may be transformed to the standard forms below.
20. Hyperbolas
The equations of hyperbolas have the form
Ax2 + By2 + Cx + Dy = E
where A and B are opposite signs. By completing the square,
they may be transformed to the standard forms below.
(x – h)2 (y – k)2 (y – k)2 (x – h)2
a2 – b2 = 1 a2 = 1
–
b2
21. Hyperbolas
The equations of hyperbolas have the form
Ax2 + By2 + Cx + Dy = E
where A and B are opposite signs. By completing the square,
they may be transformed to the standard forms below.
(x – h)2 (y – k)2 (y – k)2 (x – h)2
a2 – b2 = 1 a2 = 1
–
b2
(h, k) is the center.
22. Hyperbolas
The equations of hyperbolas have the form
Ax2 + By2 + Cx + Dy = E
where A and B are opposite signs. By completing the square,
they may be transformed to the standard forms below.
(x – h)2 (y – k)2 (y – k)2 (x – h)2
a2 – b2 = 1 a2 = 1
–
b2
x-rad = a, y-rad = b
(h, k) is the center.
23. Hyperbolas
The equations of hyperbolas have the form
Ax2 + By2 + Cx + Dy = E
where A and B are opposite signs. By completing the square,
they may be transformed to the standard forms below.
(x – h)2 (y – k)2 (y – k)2 (x – h)2
a2 – b2 = 1 a2 = 1
–
b2
x-rad = a, y-rad = b y-rad = b, x-rad = a
(h, k) is the center.
24. Hyperbolas
The equations of hyperbolas have the form
Ax2 + By2 + Cx + Dy = E
where A and B are opposite signs. By completing the square,
they may be transformed to the standard forms below.
(x – h)2 (y – k)2 (y – k)2 (x – h)2
a2 – b2 = 1 a2 = 1
–
b2
x-rad = a, y-rad = b y-rad = b, x-rad = a
(h, k) is the center.
Open in the x direction
(h, k)
25. Hyperbolas
The equations of hyperbolas have the form
Ax2 + By2 + Cx + Dy = E
where A and B are opposite signs. By completing the square,
they may be transformed to the standard forms below.
(x – h)2 (y – k)2 (y – k)2 (x – h)2
a2 – b2 = 1 a2 = 1
–
b2
x-rad = a, y-rad = b y-rad = b, x-rad = a
(h, k) is the center.
Open in the x direction Open in the y direction
(h, k) (h, k)
28. Hyperbolas
Following are the steps for graphing a hyperbola.
1. Put the equation into the standard form.
2. Read off the center, the x-radius a, the y-radius b, and
draw the center-box.
29. Hyperbolas
Following are the steps for graphing a hyperbola.
1. Put the equation into the standard form.
2. Read off the center, the x-radius a, the y-radius b, and
draw the center-box.
3. Draw the diagonals of the box, which are the asymptotes.
30. Hyperbolas
Following are the steps for graphing a hyperbola.
1. Put the equation into the standard form.
2. Read off the center, the x-radius a, the y-radius b, and
draw the center-box.
3. Draw the diagonals of the box, which are the asymptotes.
4. Determine the direction of the hyperbolas and label the
vertices of the hyperbola.
31. Hyperbolas
Following are the steps for graphing a hyperbola.
1. Put the equation into the standard form.
2. Read off the center, the x-radius a, the y-radius b, and
draw the center-box.
3. Draw the diagonals of the box, which are the asymptotes.
4. Determine the direction of the hyperbolas and label the
vertices of the hyperbola. The vertices are the mid-points
of the edges of the center-box.
32. Hyperbolas
Following are the steps for graphing a hyperbola.
1. Put the equation into the standard form.
2. Read off the center, the x-radius a, the y-radius b, and
draw the center-box.
3. Draw the diagonals of the box, which are the asymptotes.
4. Determine the direction of the hyperbolas and label the
vertices of the hyperbola. The vertices are the mid-points
of the edges of the center-box.
5. Trace the hyperbola along the asymptotes.
33. Hyperbolas
Example A. List the center, the x-radius, the y-radius.
Draw the box, the asymptotes, and label the vertices.
Trace the hyperbola.
(x – 3)2 (y + 1)2
– =1
42
22
34. Hyperbolas
Example A. List the center, the x-radius, the y-radius.
Draw the box, the asymptotes, and label the vertices.
Trace the hyperbola.
(x – 3)2 (y + 1)2
– =1
42
22
Center: (3, -1)
35. Hyperbolas
Example A. List the center, the x-radius, the y-radius.
Draw the box, the asymptotes, and label the vertices.
Trace the hyperbola.
(x – 3)2 (y + 1)2
– =1
42
22
Center: (3, -1)
x-rad = 4
y-rad = 2
36. Hyperbolas
Example A. List the center, the x-radius, the y-radius.
Draw the box, the asymptotes, and label the vertices.
Trace the hyperbola.
(x – 3)2 (y + 1)2
– =1
42
22
Center: (3, -1)
2
x-rad = 4 4
y-rad = 2 (3, -1)
37. Hyperbolas
Example A. List the center, the x-radius, the y-radius.
Draw the box, the asymptotes, and label the vertices.
Trace the hyperbola.
(x – 3)2 (y + 1)2
– =1
42
22
Center: (3, -1)
2
x-rad = 4 4
y-rad = 2 (3, -1)
38. Hyperbolas
Example A. List the center, the x-radius, the y-radius.
Draw the box, the asymptotes, and label the vertices.
Trace the hyperbola.
(x – 3)2 (y + 1)2
– =1
4 2
22
Center: (3, -1)
2
x-rad = 4 4
y-rad = 2 (3, -1)
The hyperbola opens
left-rt
39. Hyperbolas
Example A. List the center, the x-radius, the y-radius.
Draw the box, the asymptotes, and label the vertices.
Trace the hyperbola.
(x – 3)2 (y + 1)2
– =1
4 2
22
Center: (3, -1)
2
x-rad = 4 4
y-rad = 2 (3, -1)
The hyperbola opens
left-rt and the vertices
are (7, -1), (-1, -1) .
40. Hyperbolas
Example A. List the center, the x-radius, the y-radius.
Draw the box, the asymptotes, and label the vertices.
Trace the hyperbola.
(x – 3)2 (y + 1)2
– =1
4 2
22
Center: (3, -1)
2
x-rad = 4 (-1, -1) 4 (7, -1)
y-rad = 2 (3, -1)
The hyperbola opens
left-rt and the vertices
are (7, -1), (-1, -1) .
41. Hyperbolas
Example A. List the center, the x-radius, the y-radius.
Draw the box, the asymptotes, and label the vertices.
Trace the hyperbola.
(x – 3)2 (y + 1)2
– =1
4 2
22
Center: (3, -1)
2
x-rad = 4 (-1, -1) 4 (7, -1)
y-rad = 2 (3, -1)
The hyperbola opens
left-rt and the vertices
are (7, -1), (-1, -1) .
42. Hyperbolas
Example A. List the center, the x-radius, the y-radius.
Draw the box, the asymptotes, and label the vertices.
Trace the hyperbola.
(x – 3)2 (y + 1)2
– =1
4 2
22
Center: (3, -1)
2
x-rad = 4 (-1, -1) 4 (7, -1)
y-rad = 2 (3, -1)
The hyperbola opens
left-rt and the vertices
are (7, -1), (-1, -1) .
When we use completing the square to get to the standard
form of the hyperbolas, because the signs, we add a number
and subtract a number from both sides.
43. Hyperbolas
Example B. Put 4y2 – 9x2 – 18x – 16y = 29 into the standard
form. Find the center, major and minor axis. Draw and label
the top, bottom, right, and left most points.
44. Hyperbolas
Example B. Put 4y2 – 9x2 – 18x – 16y = 29 into the standard
form. Find the center, major and minor axis. Draw and label
the top, bottom, right, and left most points.
Group the x’s and the y’s:
45. Hyperbolas
Example B. Put 4y2 – 9x2 – 18x – 16y = 29 into the standard
form. Find the center, major and minor axis. Draw and label
the top, bottom, right, and left most points.
Group the x’s and the y’s:
4y2 – 16y – 9x2 – 18x = 29
46. Hyperbolas
Example B. Put 4y2 – 9x2 – 18x – 16y = 29 into the standard
form. Find the center, major and minor axis. Draw and label
the top, bottom, right, and left most points.
Group the x’s and the y’s:
4y2 – 16y – 9x2 – 18x = 29 factor out the square-coefficients
4(y2 – 4y ) – 9(x2 + 2x ) = 29
47. Hyperbolas
Example B. Put 4y2 – 9x2 – 18x – 16y = 29 into the standard
form. Find the center, major and minor axis. Draw and label
the top, bottom, right, and left most points.
Group the x’s and the y’s:
4y2 – 16y – 9x2 – 18x = 29 factor out the square-coefficients
4(y2 – 4y ) – 9(x2 + 2x ) = 29 complete the square
48. Hyperbolas
Example B. Put 4y2 – 9x2 – 18x – 16y = 29 into the standard
form. Find the center, major and minor axis. Draw and label
the top, bottom, right, and left most points.
Group the x’s and the y’s:
4y2 – 16y – 9x2 – 18x = 29 factor out the square-coefficients
4(y2 – 4y ) – 9(x2 + 2x ) = 29 complete the square
4(y2 – 4y + 4 ) – 9(x2 + 2x ) = 29
49. Hyperbolas
Example B. Put 4y2 – 9x2 – 18x – 16y = 29 into the standard
form. Find the center, major and minor axis. Draw and label
the top, bottom, right, and left most points.
Group the x’s and the y’s:
4y2 – 16y – 9x2 – 18x = 29 factor out the square-coefficients
4(y2 – 4y ) – 9(x2 + 2x ) = 29 complete the square
4(y2 – 4y + 4 ) – 9(x2 + 2x + 1 ) = 29
50. Hyperbolas
Example B. Put 4y2 – 9x2 – 18x – 16y = 29 into the standard
form. Find the center, major and minor axis. Draw and label
the top, bottom, right, and left most points.
Group the x’s and the y’s:
4y2 – 16y – 9x2 – 18x = 29 factor out the square-coefficients
4(y2 – 4y ) – 9(x2 + 2x ) = 29 complete the square
4(y2 – 4y + 4 ) – 9(x2 + 2x + 1 ) = 29
16
51. Hyperbolas
Example B. Put 4y2 – 9x2 – 18x – 16y = 29 into the standard
form. Find the center, major and minor axis. Draw and label
the top, bottom, right, and left most points.
Group the x’s and the y’s:
4y2 – 16y – 9x2 – 18x = 29 factor out the square-coefficients
4(y2 – 4y ) – 9(x2 + 2x ) = 29 complete the square
4(y2 – 4y + 4 ) – 9(x2 + 2x + 1 ) = 29
16 –9
52. Hyperbolas
Example B. Put 4y2 – 9x2 – 18x – 16y = 29 into the standard
form. Find the center, major and minor axis. Draw and label
the top, bottom, right, and left most points.
Group the x’s and the y’s:
4y2 – 16y – 9x2 – 18x = 29 factor out the square-coefficients
4(y2 – 4y ) – 9(x2 + 2x ) = 29 complete the square
4(y2 – 4y + 4 ) – 9(x2 + 2x + 1 ) = 29 + 16 – 9
16 –9
53. Hyperbolas
Example B. Put 4y2 – 9x2 – 18x – 16y = 29 into the standard
form. Find the center, major and minor axis. Draw and label
the top, bottom, right, and left most points.
Group the x’s and the y’s:
4y2 – 16y – 9x2 – 18x = 29 factor out the square-coefficients
4(y2 – 4y ) – 9(x2 + 2x ) = 29 complete the square
4(y2 – 4y + 4 ) – 9(x2 + 2x + 1 ) = 29 + 16 – 9
16 –9
4(y – 2)2 – 9(x + 1)2 = 36
54. Hyperbolas
Example B. Put 4y2 – 9x2 – 18x – 16y = 29 into the standard
form. Find the center, major and minor axis. Draw and label
the top, bottom, right, and left most points.
Group the x’s and the y’s:
4y2 – 16y – 9x2 – 18x = 29 factor out the square-coefficients
4(y2 – 4y ) – 9(x2 + 2x ) = 29 complete the square
4(y2 – 4y + 4 ) – 9(x2 + 2x + 1 ) = 29 + 16 – 9
16 –9
4(y – 2)2 – 9(x + 1)2 = 36 divide by 36 to get 1
55. Hyperbolas
Example B. Put 4y2 – 9x2 – 18x – 16y = 29 into the standard
form. Find the center, major and minor axis. Draw and label
the top, bottom, right, and left most points.
Group the x’s and the y’s:
4y2 – 16y – 9x2 – 18x = 29 factor out the square-coefficients
4(y2 – 4y ) – 9(x2 + 2x ) = 29 complete the square
4(y2 – 4y + 4 ) – 9(x2 + 2x + 1 ) = 29 + 16 – 9
16 –9
4(y – 2)2 – 9(x + 1)2 = 36 divide by 36 to get 1
4(y – 2)2 – 9(x + 1)2 = 1
36 36
56. Hyperbolas
Example B. Put 4y2 – 9x2 – 18x – 16y = 29 into the standard
form. Find the center, major and minor axis. Draw and label
the top, bottom, right, and left most points.
Group the x’s and the y’s:
4y2 – 16y – 9x2 – 18x = 29 factor out the square-coefficients
4(y2 – 4y ) – 9(x2 + 2x ) = 29 complete the square
4(y2 – 4y + 4 ) – 9(x2 + 2x + 1 ) = 29 + 16 – 9
16 –9
4(y – 2)2 – 9(x + 1)2 = 36 divide by 36 to get 1
4(y – 2)2 – 9(x + 1)2 = 1
36 9 36 4
57. Hyperbolas
Example B. Put 4y2 – 9x2 – 18x – 16y = 29 into the standard
form. Find the center, major and minor axis. Draw and label
the top, bottom, right, and left most points.
Group the x’s and the y’s:
4y2 – 16y – 9x2 – 18x = 29 factor out the square-coefficients
4(y2 – 4y ) – 9(x2 + 2x ) = 29 complete the square
4(y2 – 4y + 4 ) – 9(x2 + 2x + 1 ) = 29 + 16 – 9
16 –9
4(y – 2)2 – 9(x + 1)2 = 36 divide by 36 to get 1
4(y – 2)2 – 9(x + 1)2 = 1
36 9 36 4
(y – 2)2 – (x + 1)2 = 1
32 22
58. Hyperbolas
Example B. Put 4y2 – 9x2 – 18x – 16y = 29 into the standard
form. Find the center, major and minor axis. Draw and label
the top, bottom, right, and left most points.
Group the x’s and the y’s:
4y2 – 16y – 9x2 – 18x = 29 factor out the square-coefficients
4(y2 – 4y ) – 9(x2 + 2x ) = 29 complete the square
4(y2 – 4y + 4 ) – 9(x2 + 2x + 1 ) = 29 + 16 – 9
16 –9
4(y – 2)2 – 9(x + 1)2 = 36 divide by 36 to get 1
4(y – 2)2 – 9(x + 1)2 = 1
36 9 36 4
(y – 2)2 – (x + 1)2 = 1
32 22
Center: (-1, 2),
59. Hyperbolas
Example B. Put 4y2 – 9x2 – 18x – 16y = 29 into the standard
form. Find the center, major and minor axis. Draw and label
the top, bottom, right, and left most points.
Group the x’s and the y’s:
4y2 – 16y – 9x2 – 18x = 29 factor out the square-coefficients
4(y2 – 4y ) – 9(x2 + 2x ) = 29 complete the square
4(y2 – 4y + 4 ) – 9(x2 + 2x + 1 ) = 29 + 16 – 9
16 –9
4(y – 2)2 – 9(x + 1)2 = 36 divide by 36 to get 1
4(y – 2)2 – 9(x + 1)2 = 1
36 9 36 4
(y – 2)2 – (x + 1)2 = 1
32 22
Center: (-1, 2), x-rad = 2, y-rad = 3
60. Hyperbolas
Example B. Put 4y2 – 9x2 – 18x – 16y = 29 into the standard
form. Find the center, major and minor axis. Draw and label
the top, bottom, right, and left most points.
Group the x’s and the y’s:
4y2 – 16y – 9x2 – 18x = 29 factor out the square-coefficients
4(y2 – 4y ) – 9(x2 + 2x ) = 29 complete the square
4(y2 – 4y + 4 ) – 9(x2 + 2x + 1 ) = 29 + 16 – 9
16 –9
4(y – 2)2 – 9(x + 1)2 = 36 divide by 36 to get 1
4(y – 2)2 – 9(x + 1)2 = 1
36 9 36 4
(y – 2)2 – (x + 1)2 = 1
32 22
Center: (-1, 2), x-rad = 2, y-rad = 3
The hyperbola opens up and down.
62. Hyperbolas
Center: (-1, 2),
x-rad = 2, (-1, 5)
y-rad = 3
The hyperbola opens up and down.
The vertices are (-1, -1) and (-1, 5). (-1, 2)
(-1, -1)
63. Hyperbolas
Center: (-1, 2),
x-rad = 2, (-1, 5)
y-rad = 3
The hyperbola opens up and down.
The vertices are (-1, -1) and (-1, 5). (-1, 2)
(-1, -1)
64. Hyperbolas
Exercise A. Write the equation of each hyperbola.
1. (4, 2)
2. 3.
(2, 4)
(–6, –8)
4. 5. 6.
(5, 3) (2, 4) (–8,–6)
(3, 1) (0,0)
(2, 4)
65. Hyperbolas
Exercise B. Given the equations of the hyperbolas
find the center and radii. Draw and label the center
and the vertices.
7. 1 = x2 – y2 8. 16 = y2 – 4x2
9. 36 = 4y2 – 9x2 10. 100 = 4x2 – 25y2
11. 1 = (y – 2)2 – (x + 3)2 12. 16 = (x – 5)2 – 4(y + 7)2
13. 36 = 4(y – 8)2 – 9(x – 2)2
14. 100 = 4(x – 5)2 – 25(y + 5)2
15. 225 = 25(y + 1)2 – 9(x – 4)2
16. –100 = 4(y – 5)2 – 25(x + 3)2
66. Hyperbolas
Exercise C. Given the equations of the hyperbolas
find the center and radii. Draw and label the center
and the vertices.
17. x –4y +8y = 5
2 2 18. x2–4y2+8x = 20
20. y –2x–x +4y = 6
2 2
19. 4x –y +8y = 52
2 2
21. x –16y +4y +16x = 16
2 2 22. 4x2–y2+8x–4y = 4
23. y +54x–9x –4y = 86
2 2 24. 4x2+18y–9y2–8x = 41