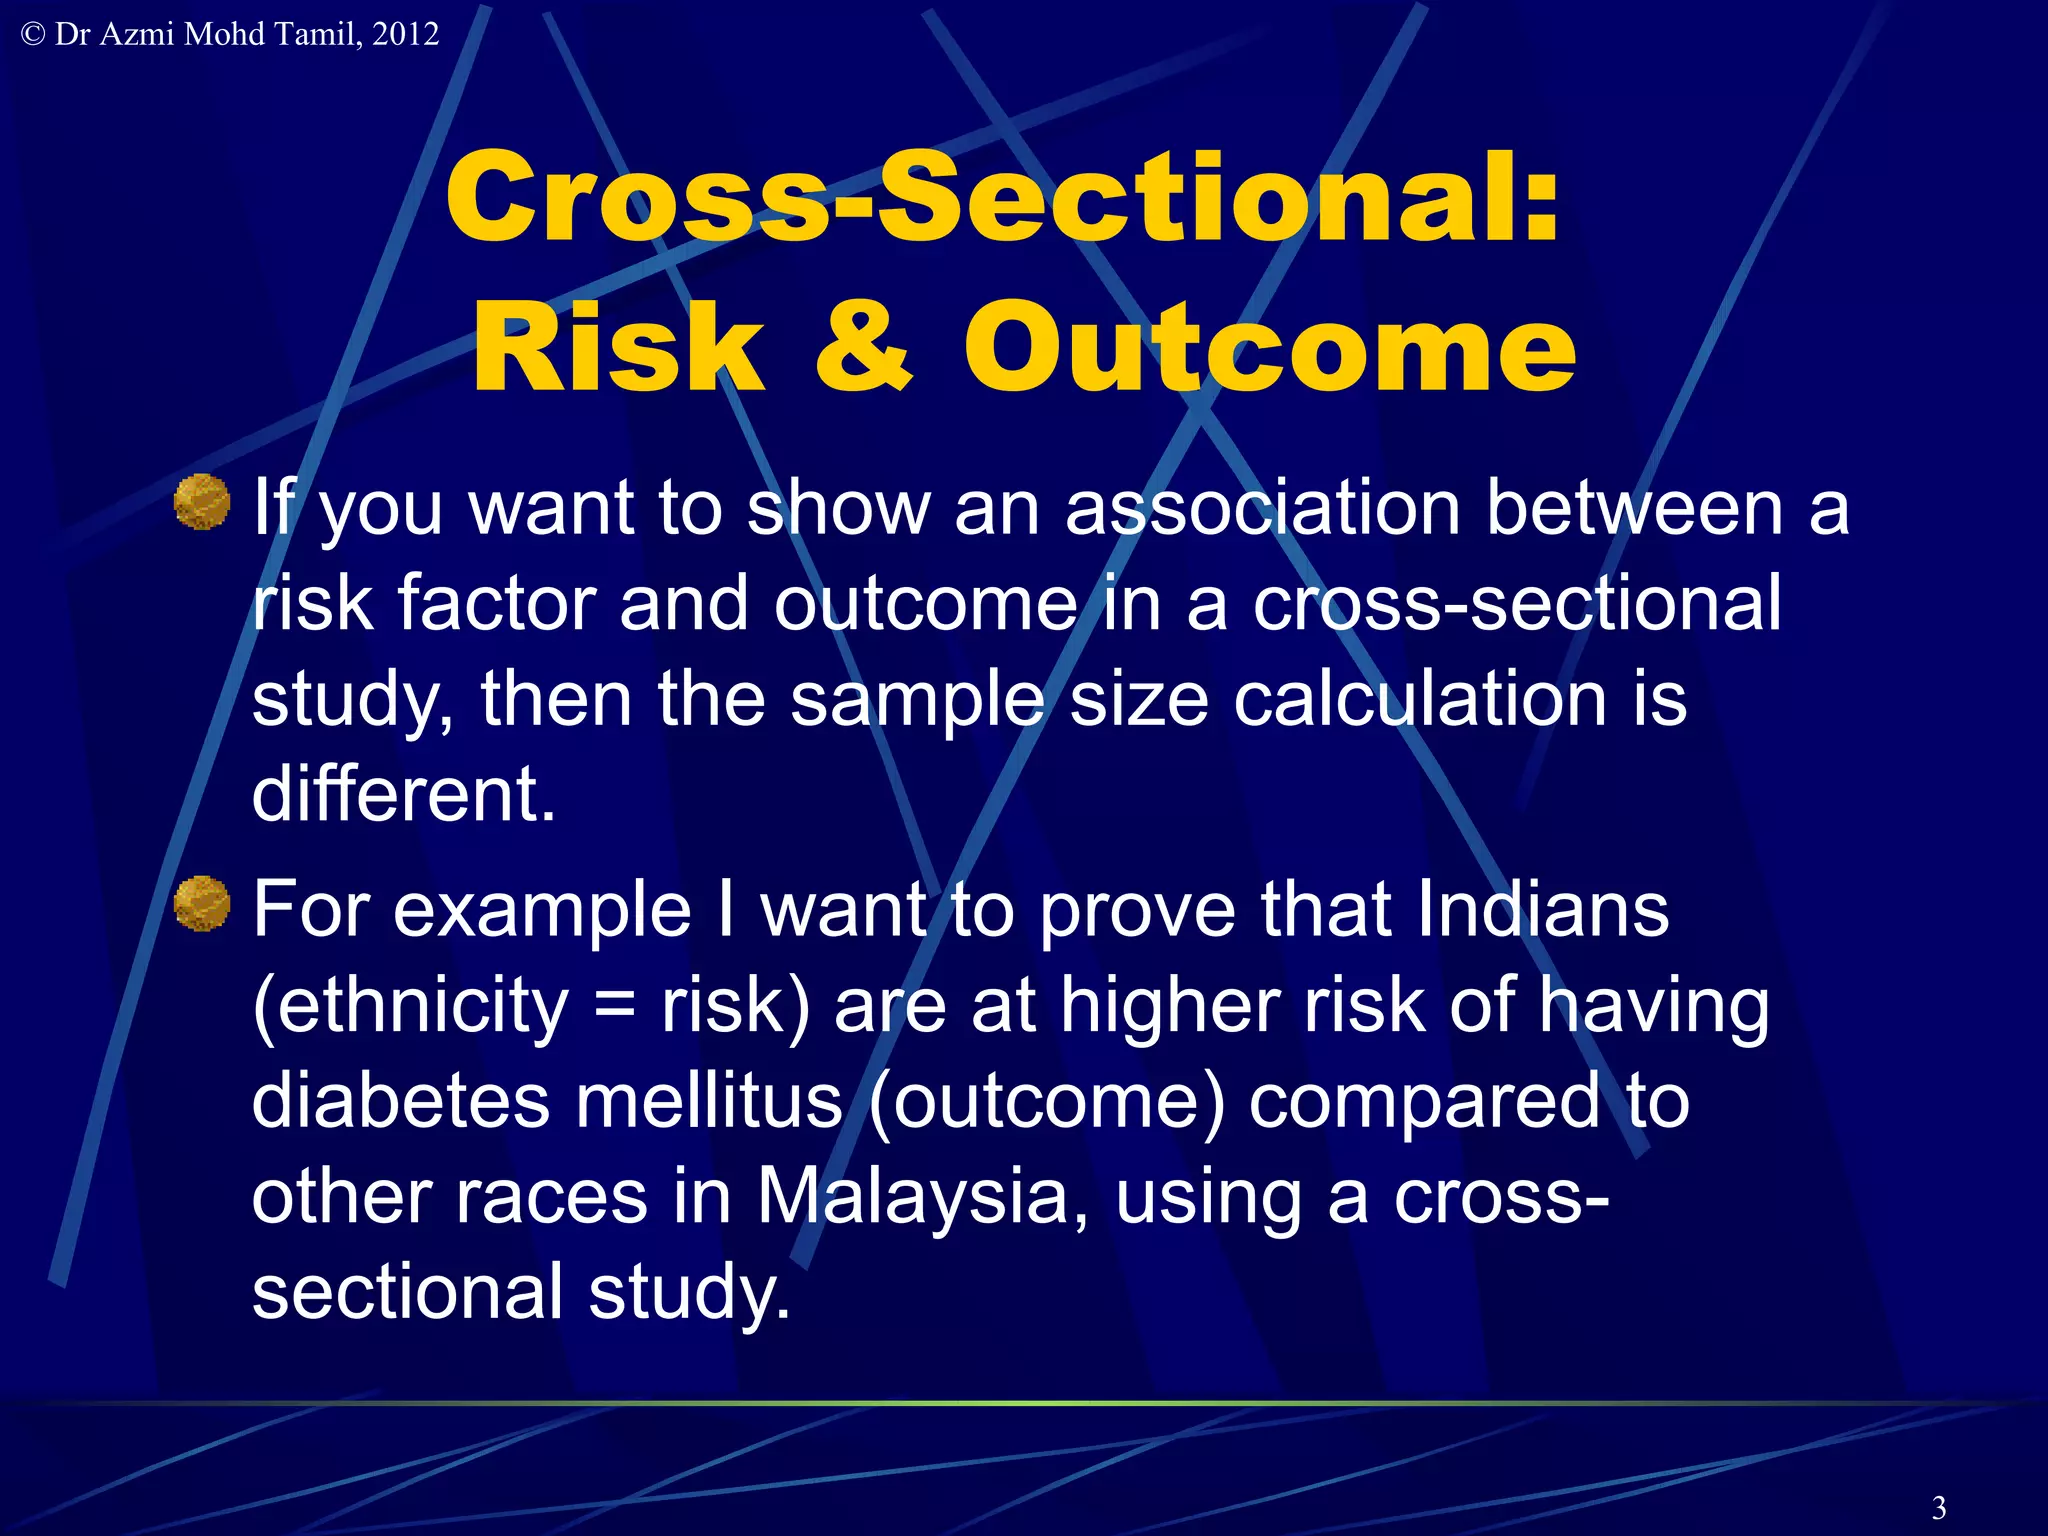
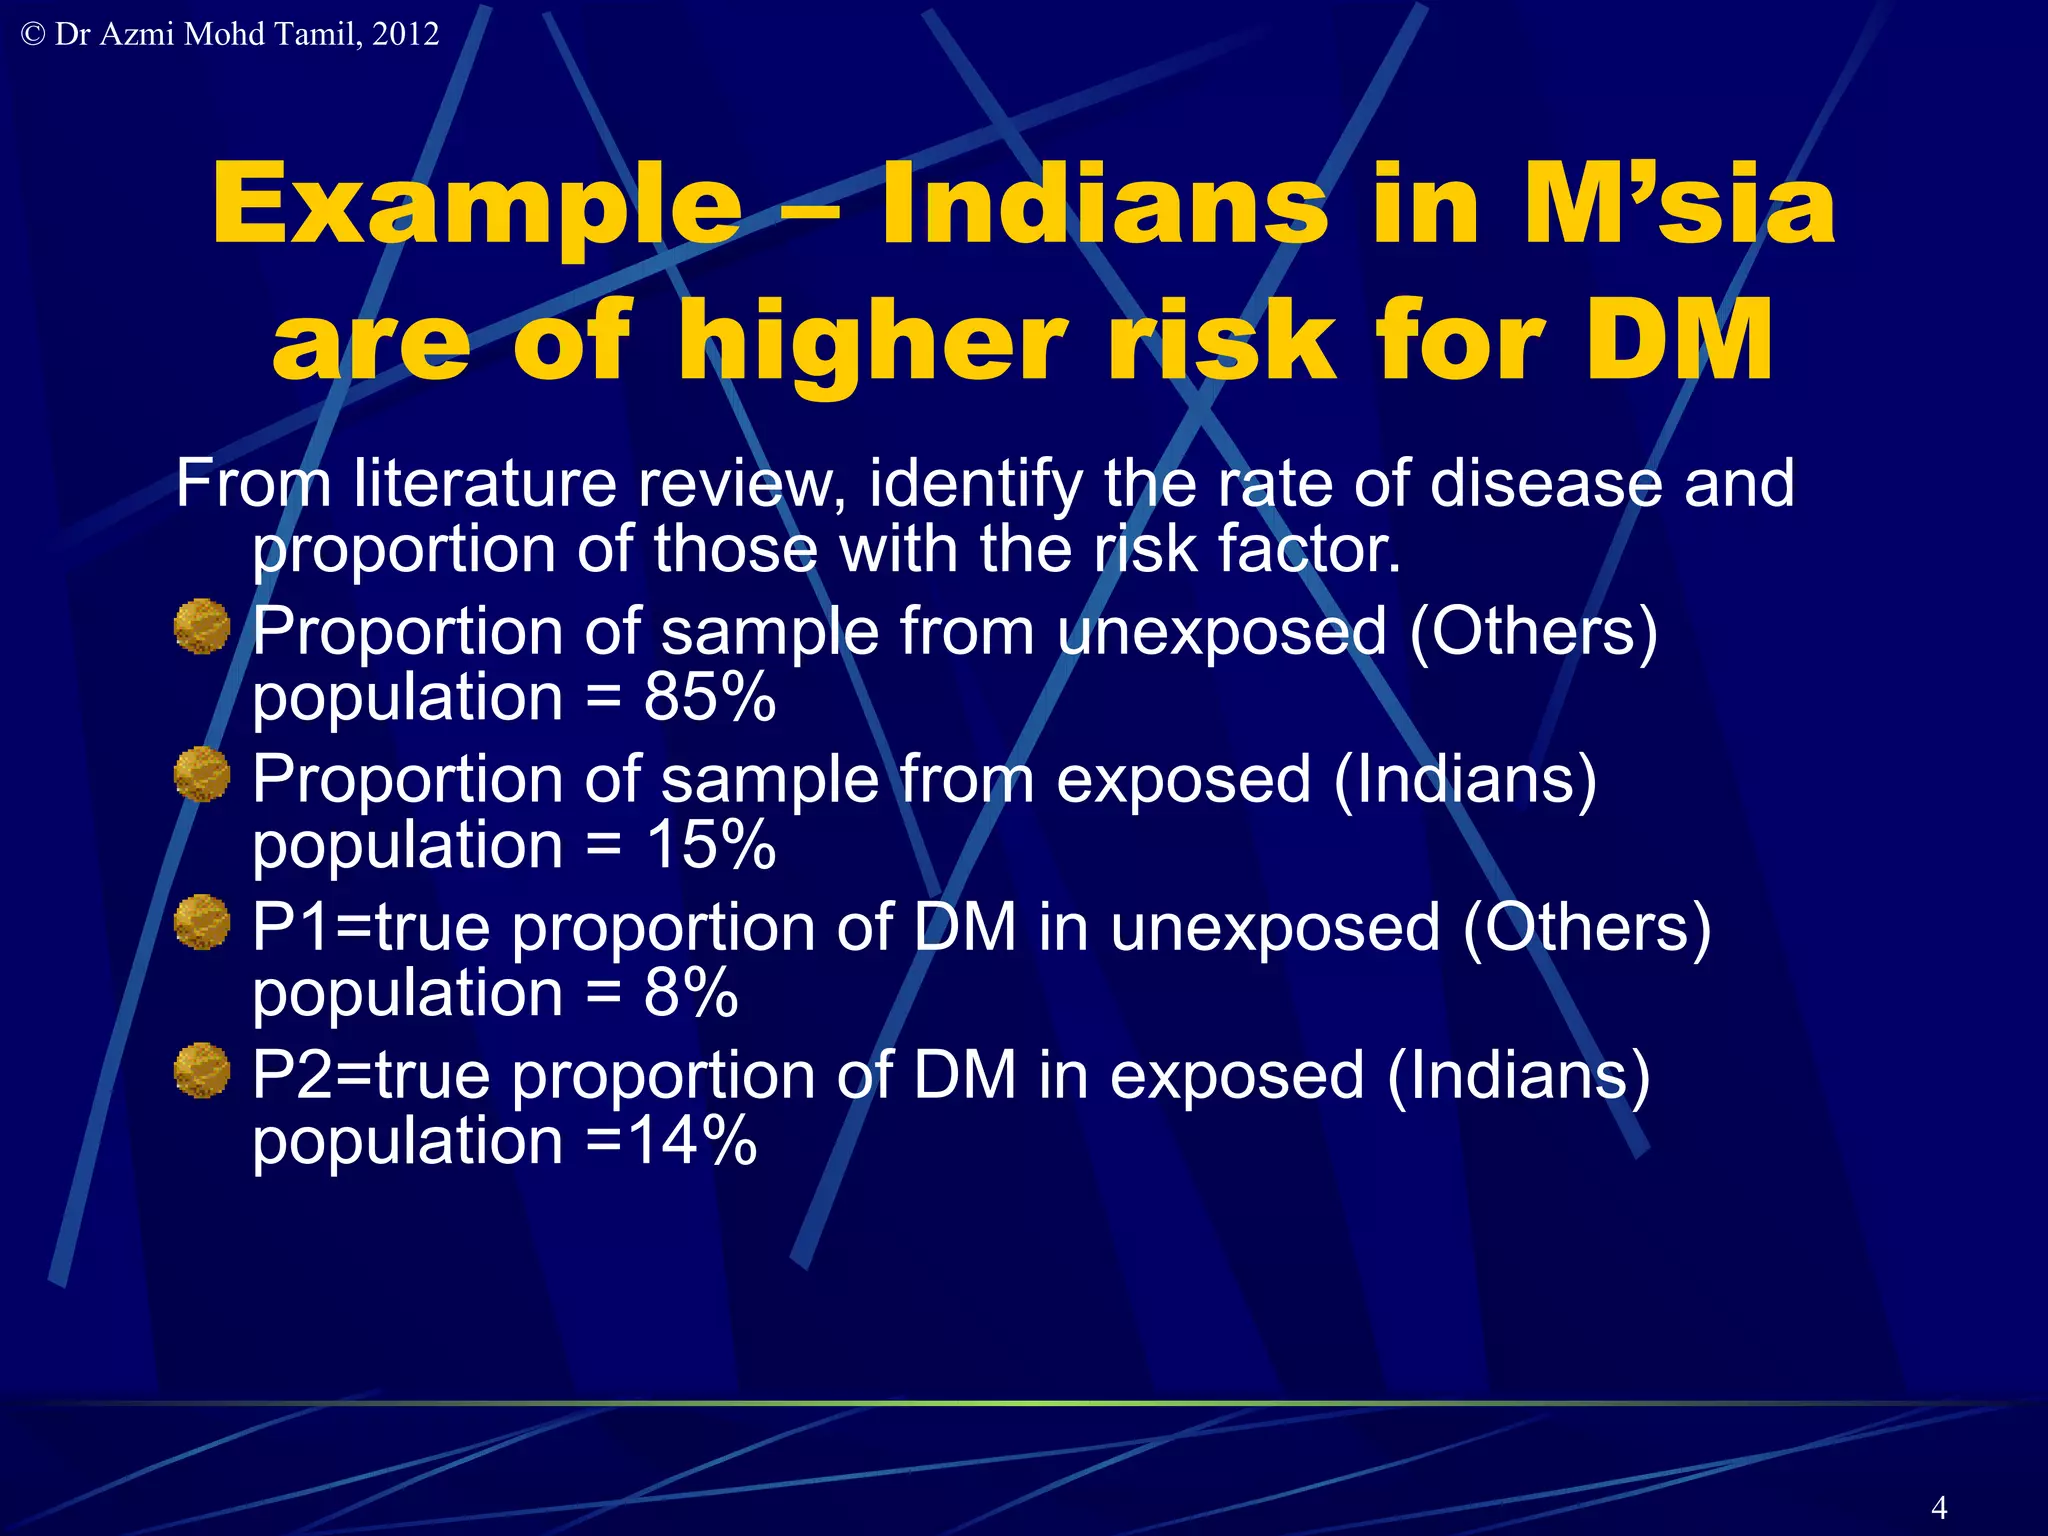
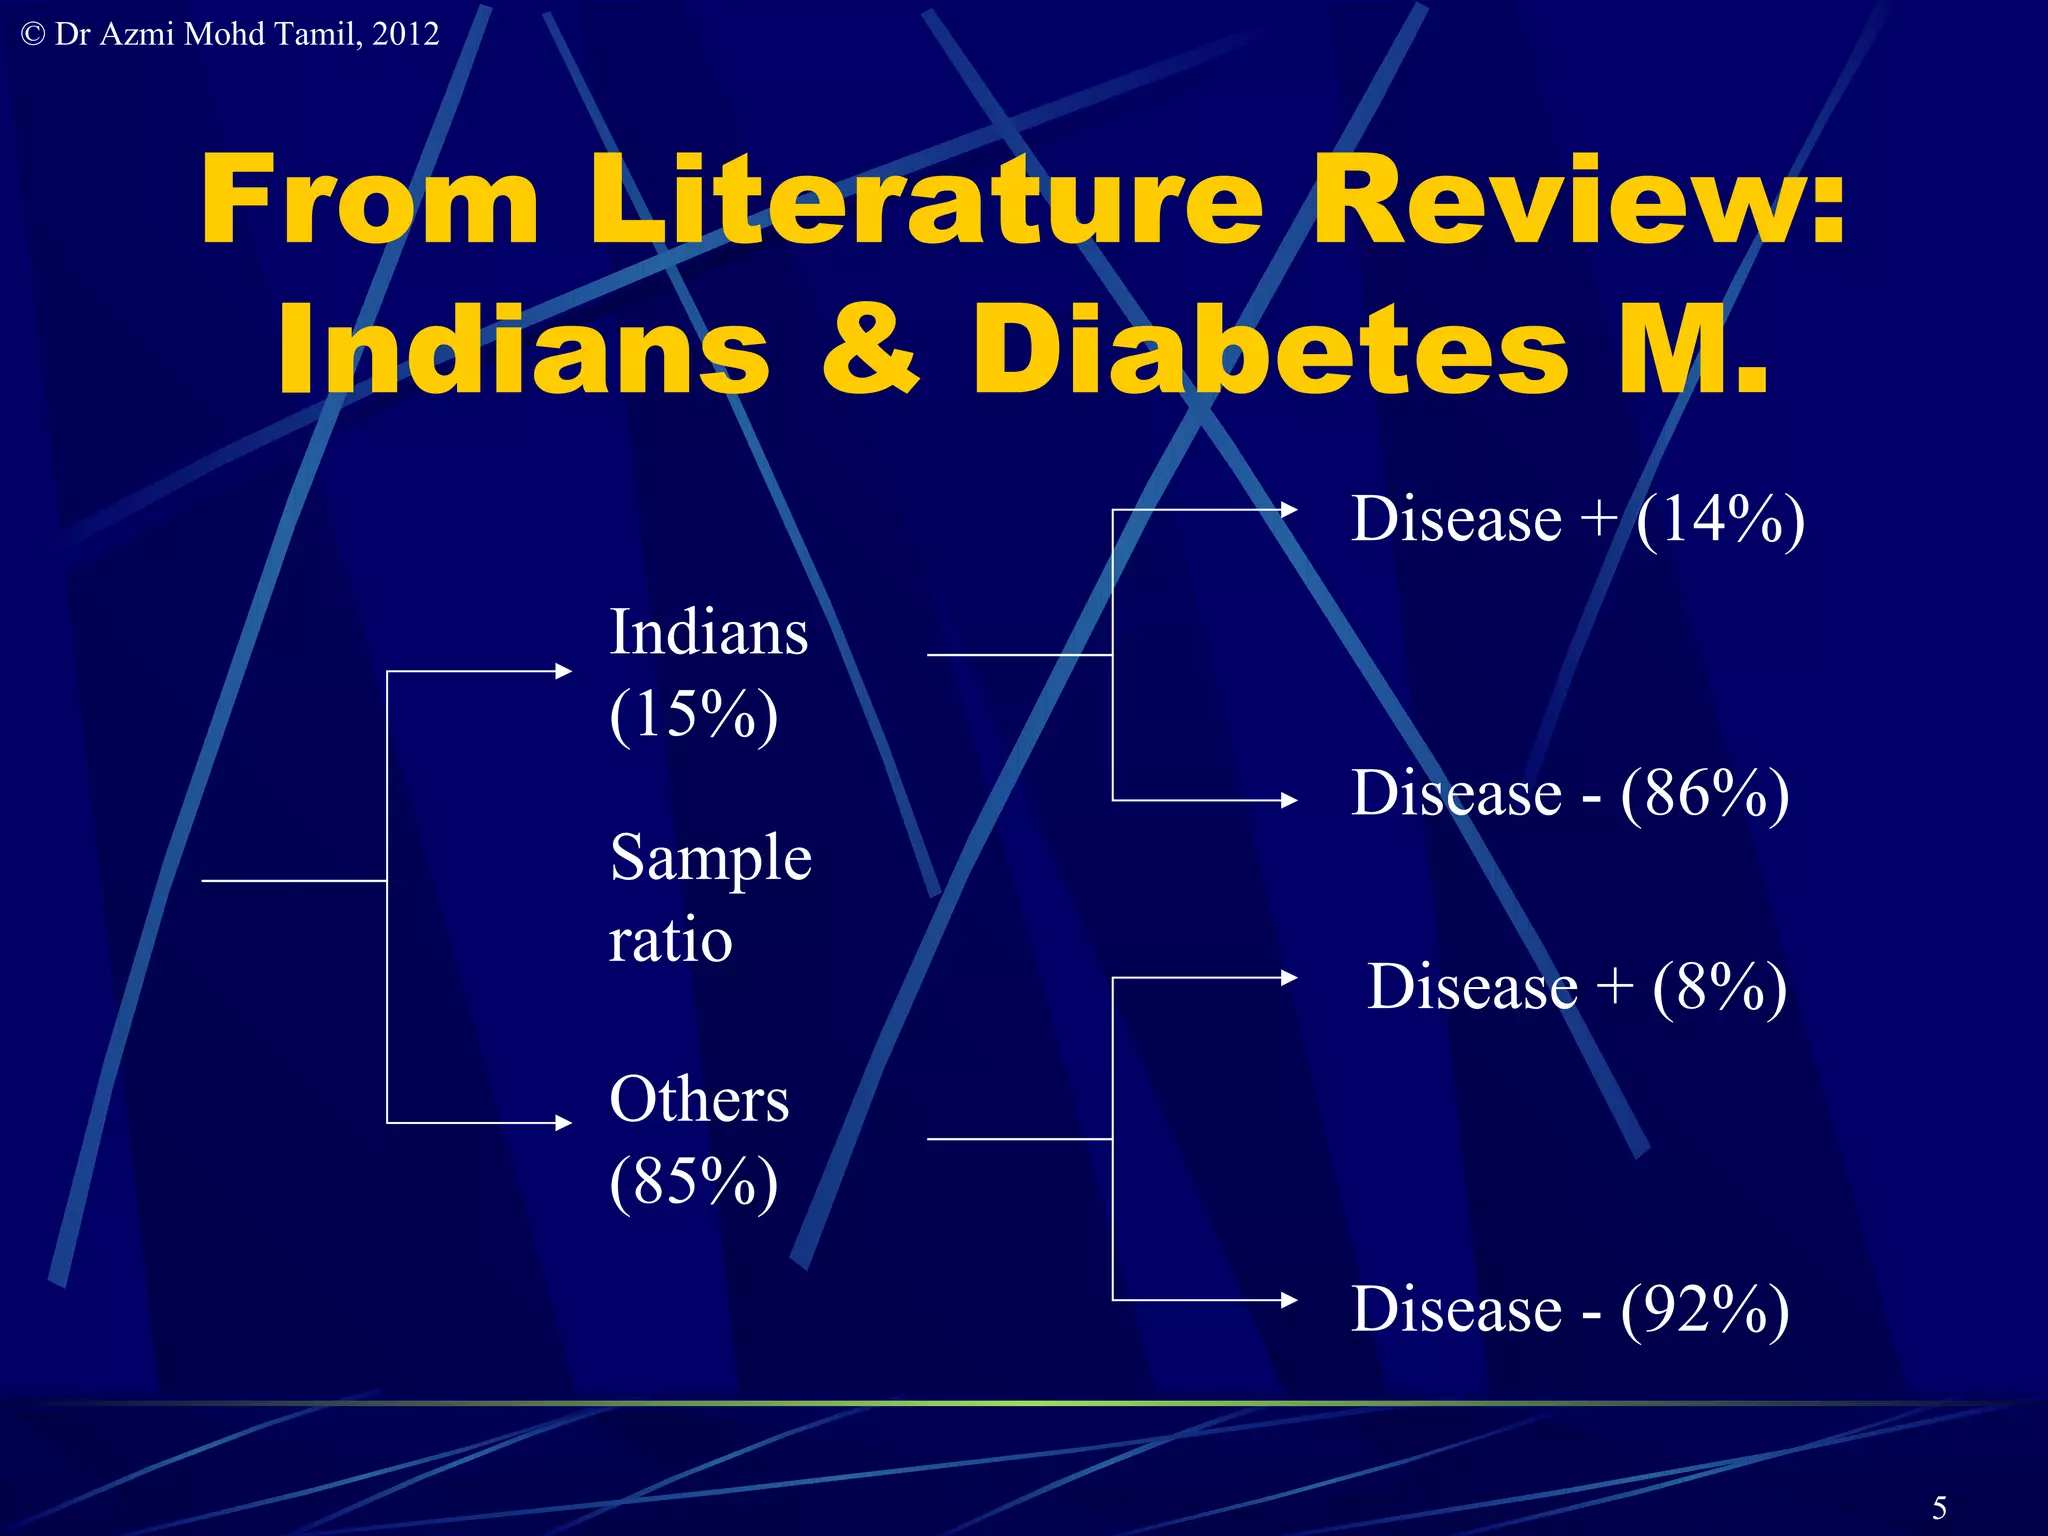
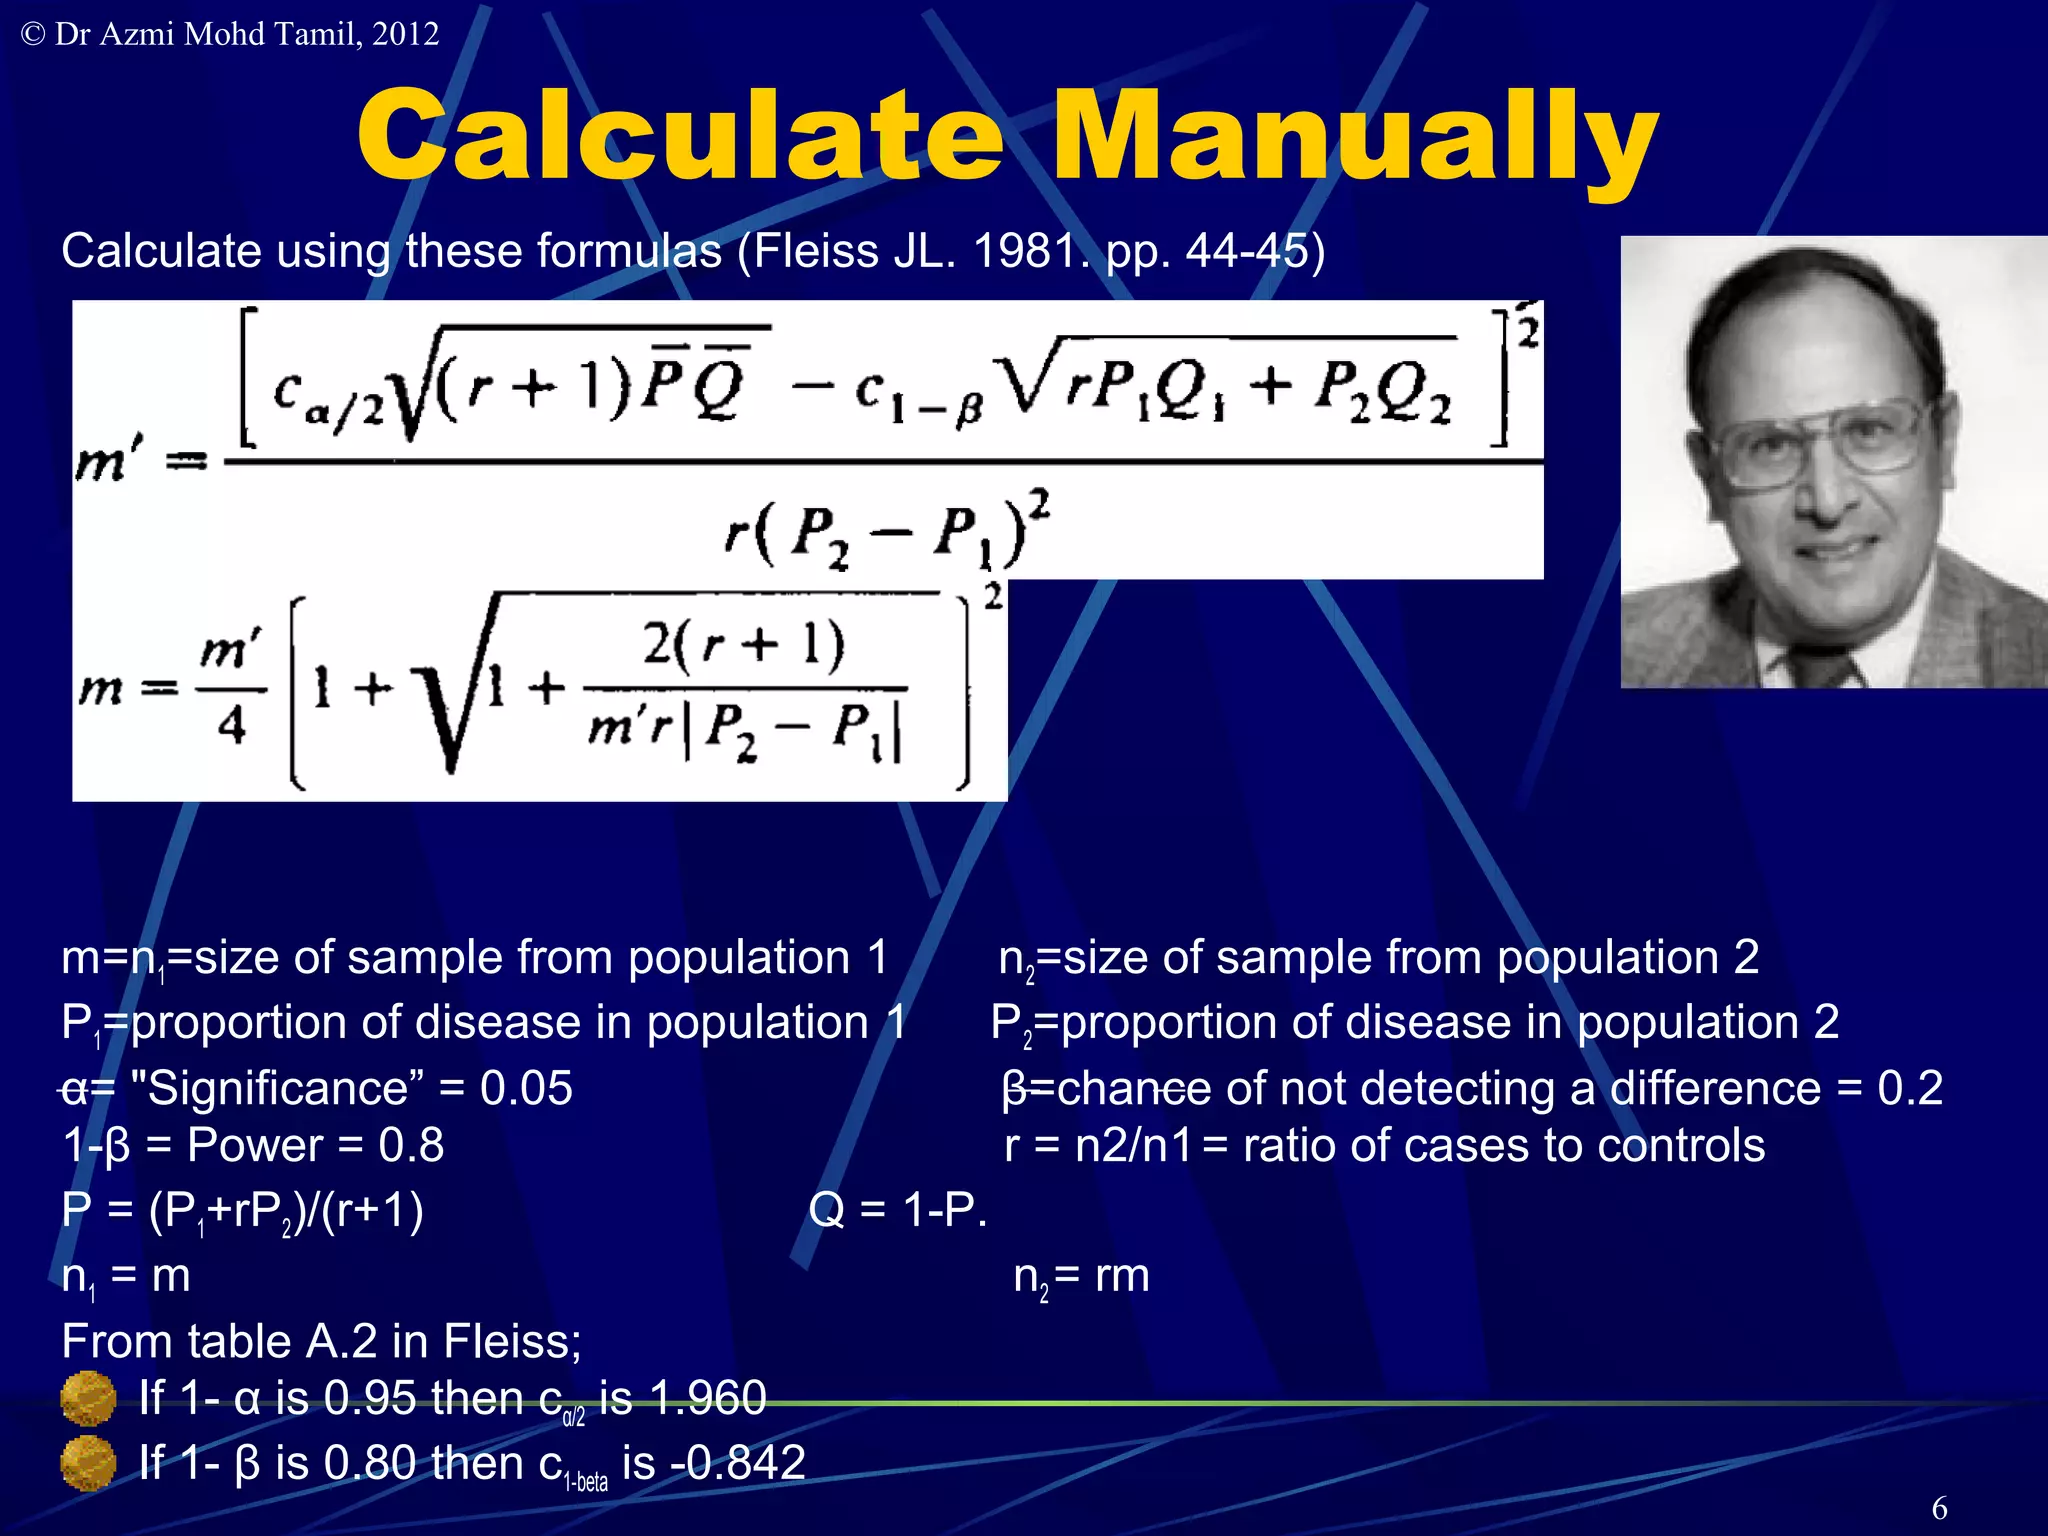
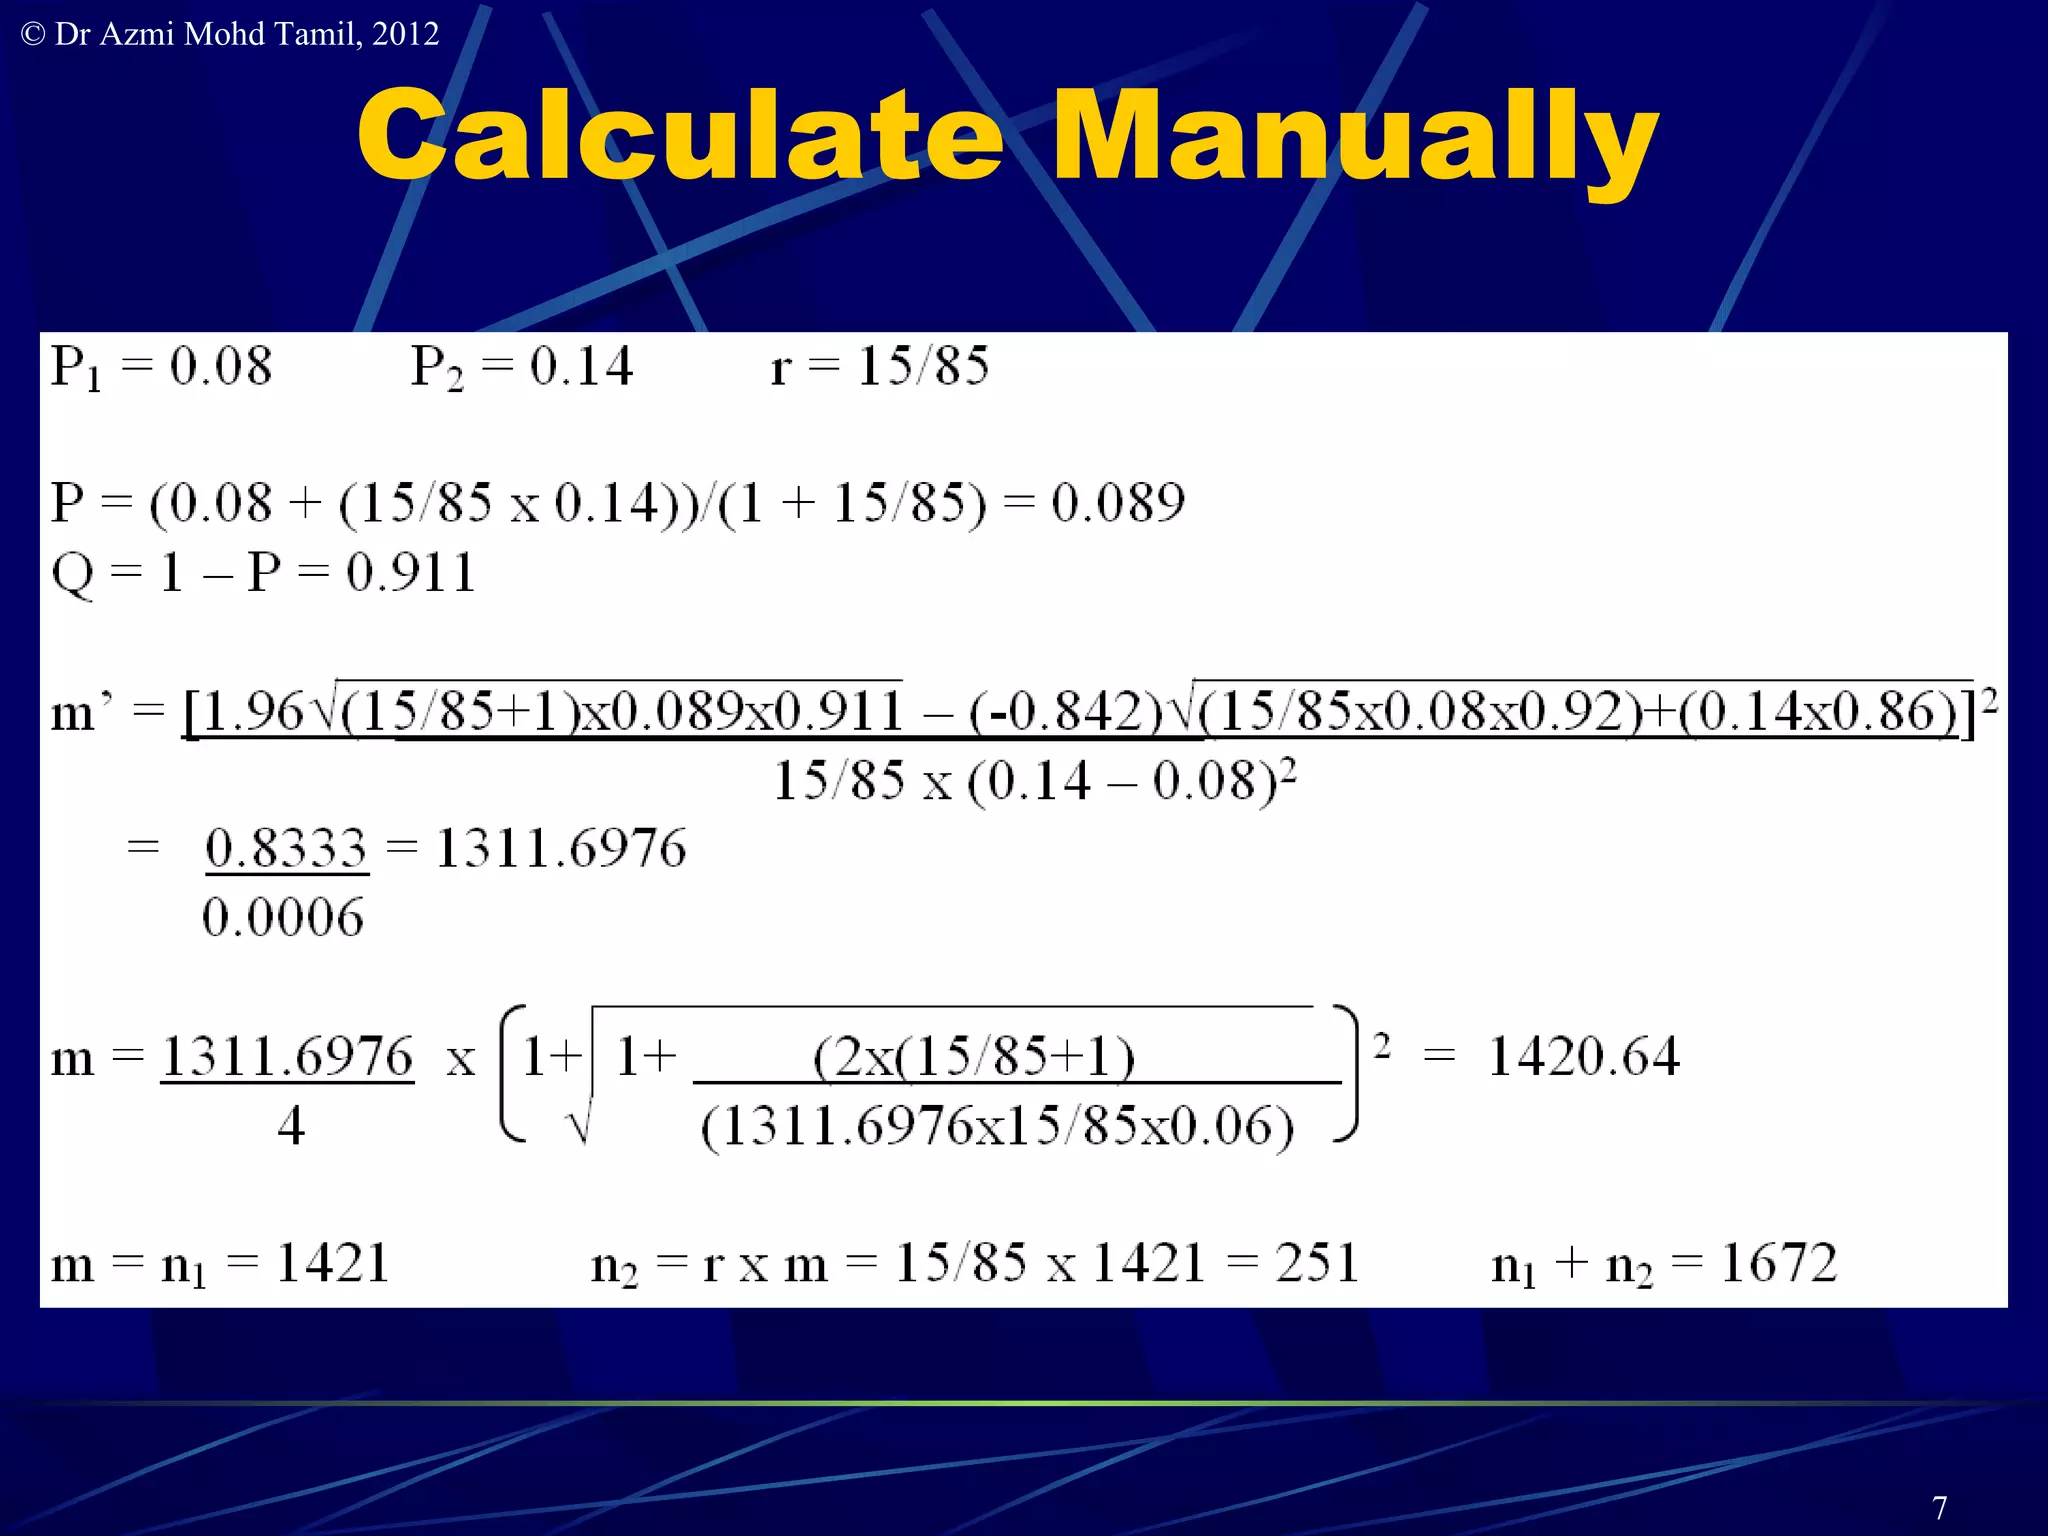
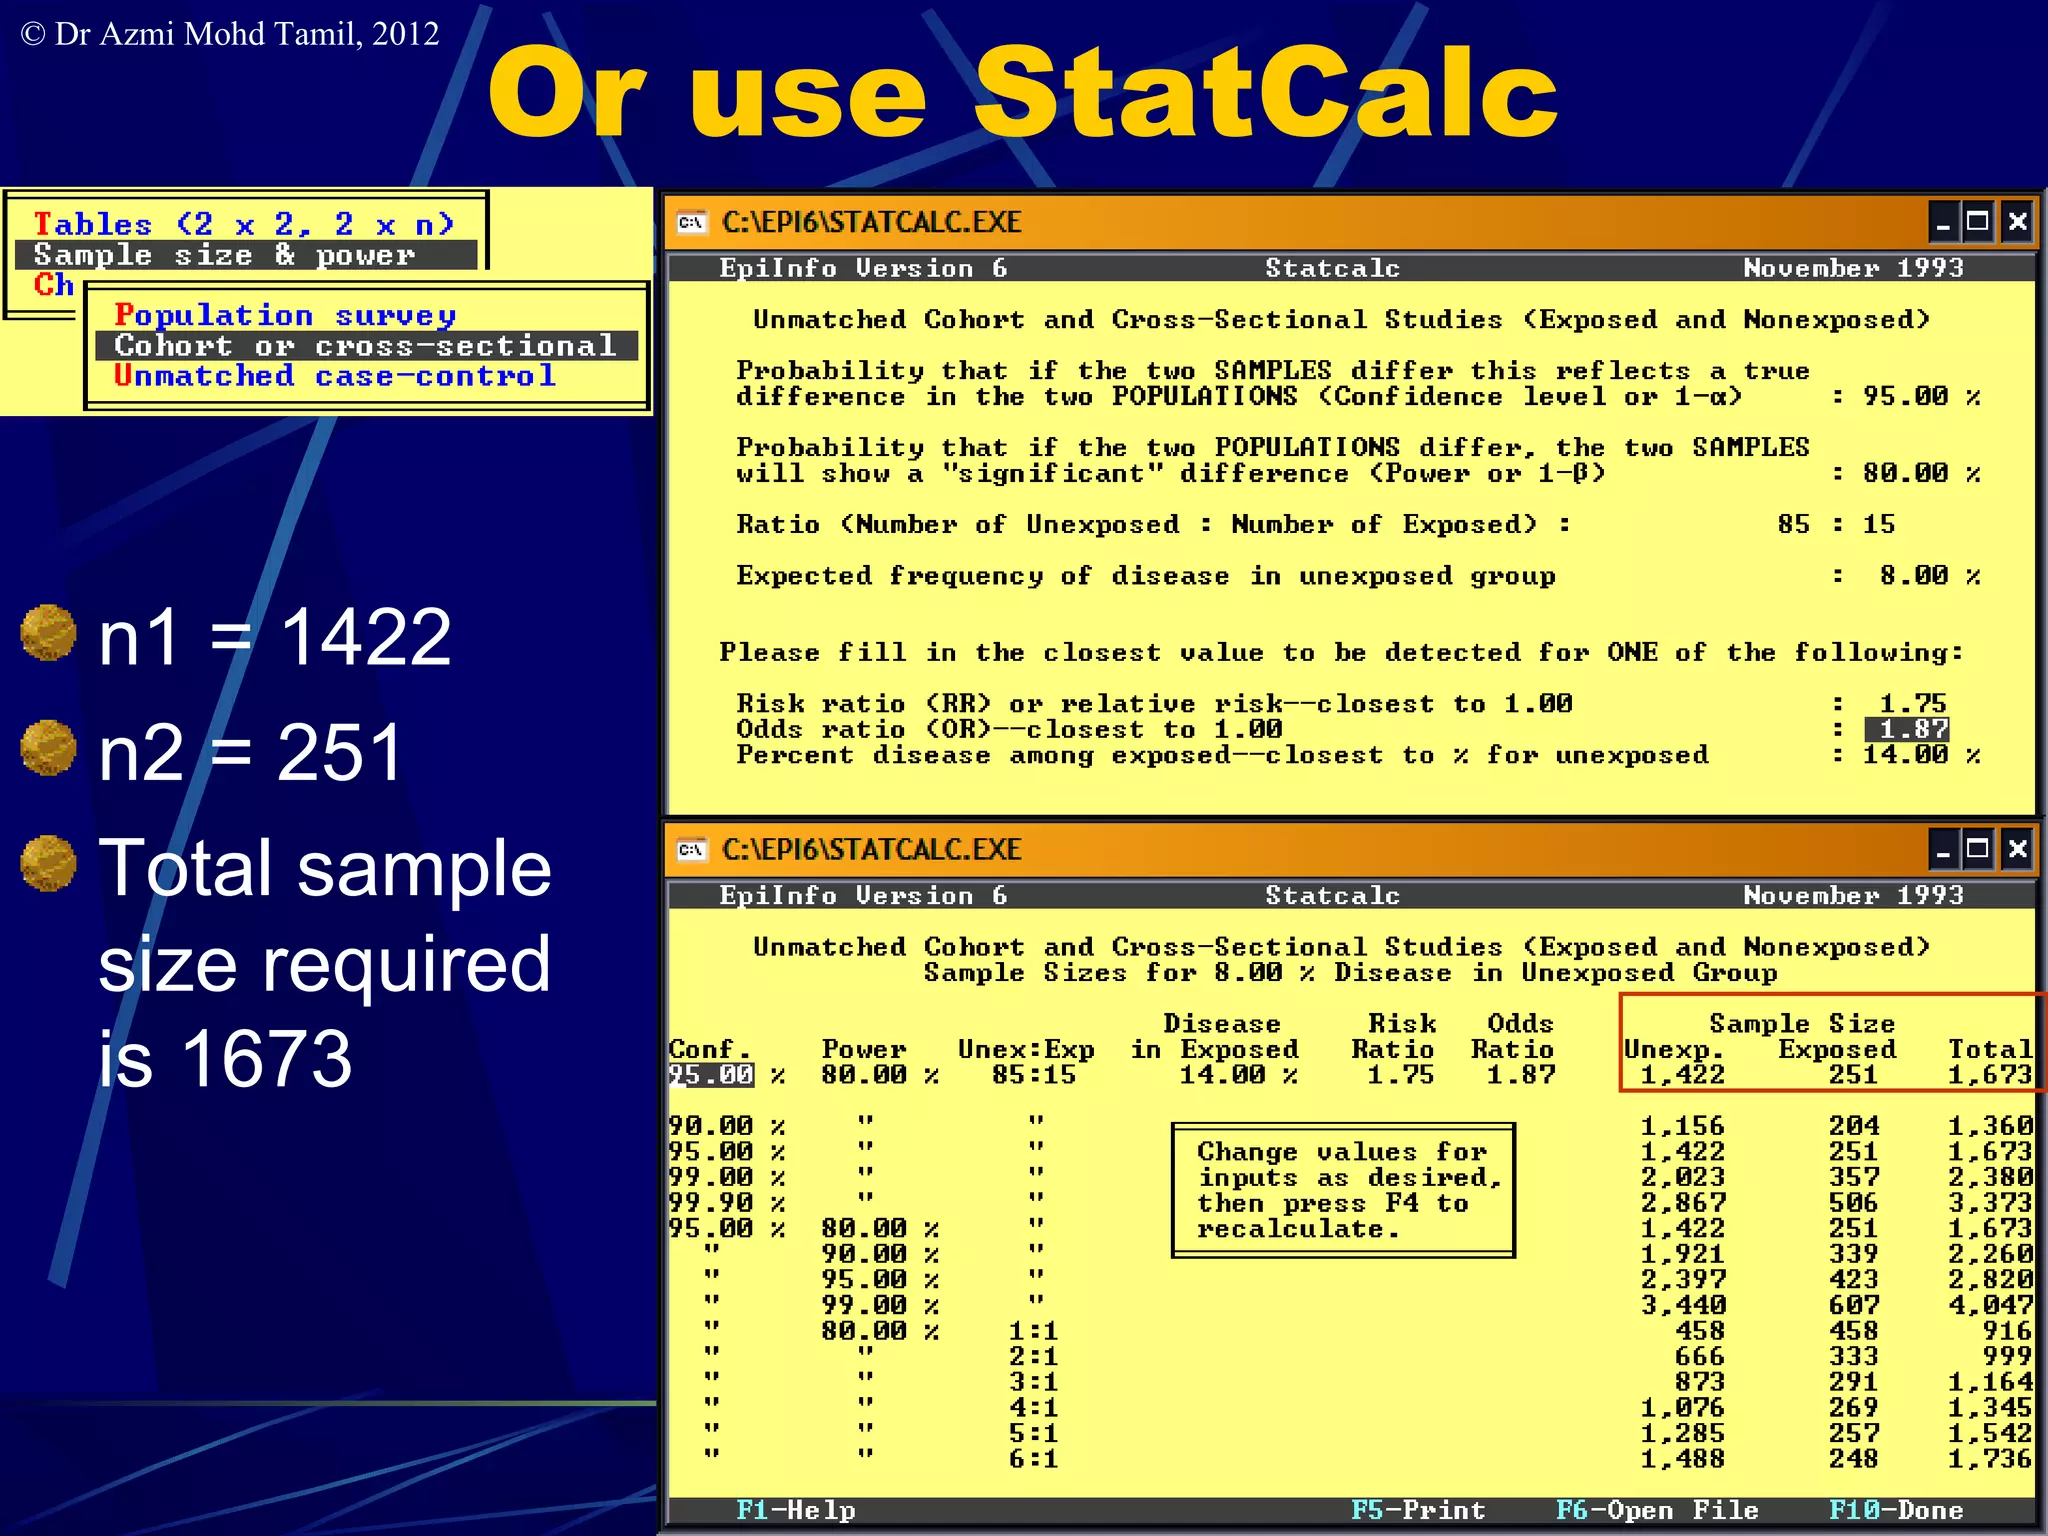
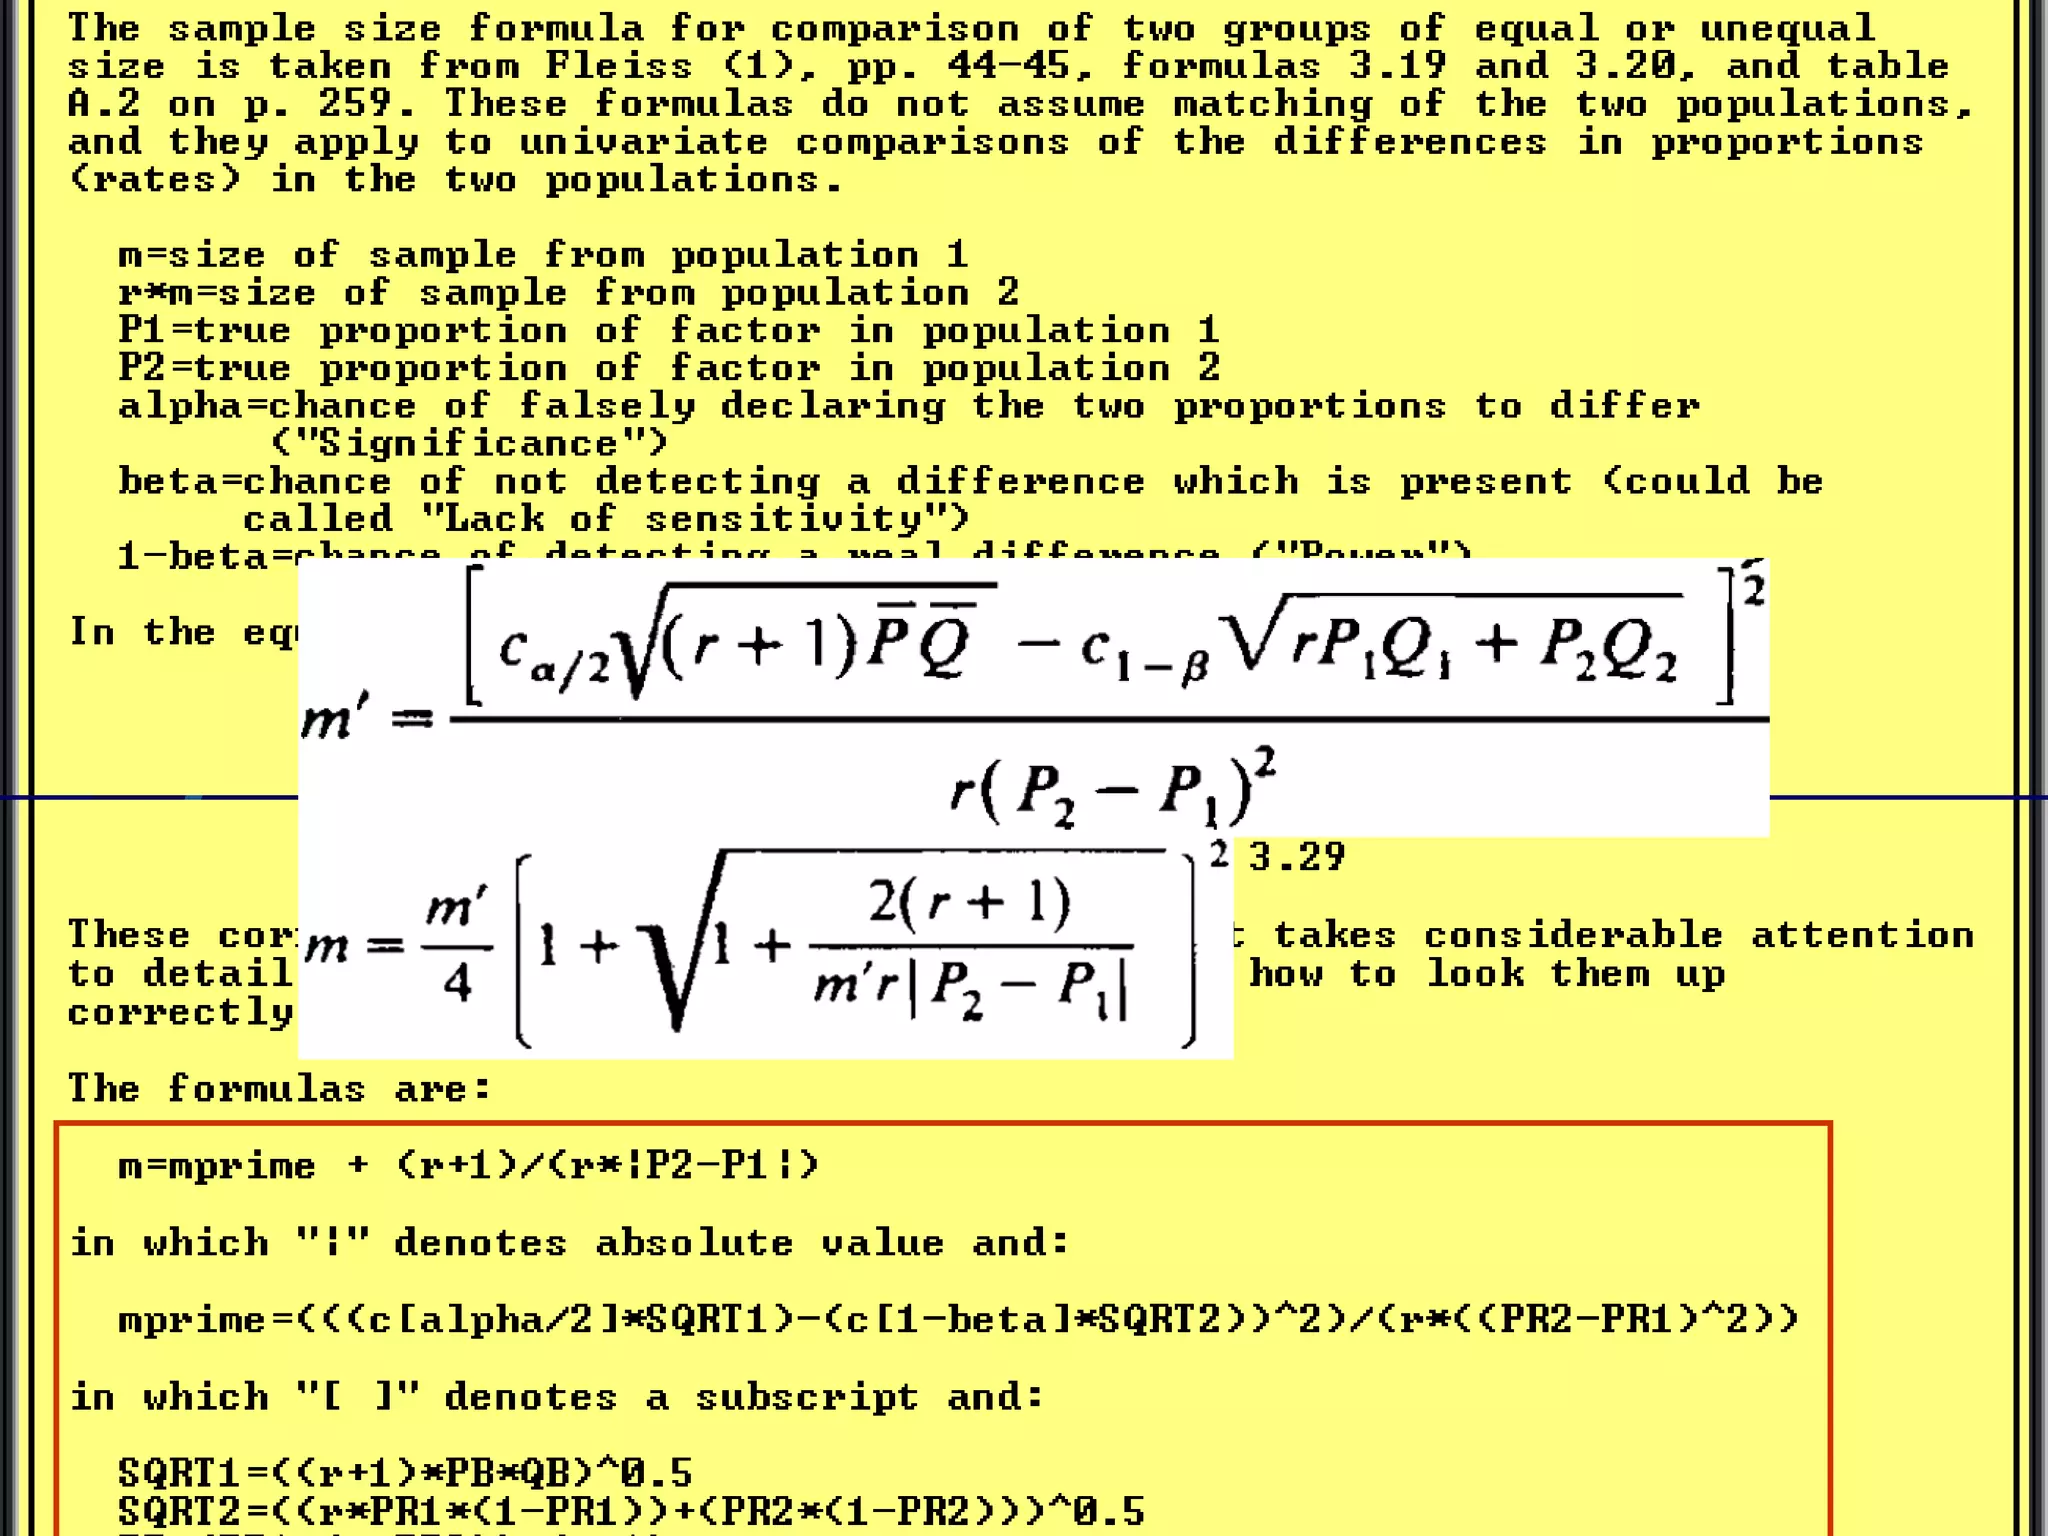
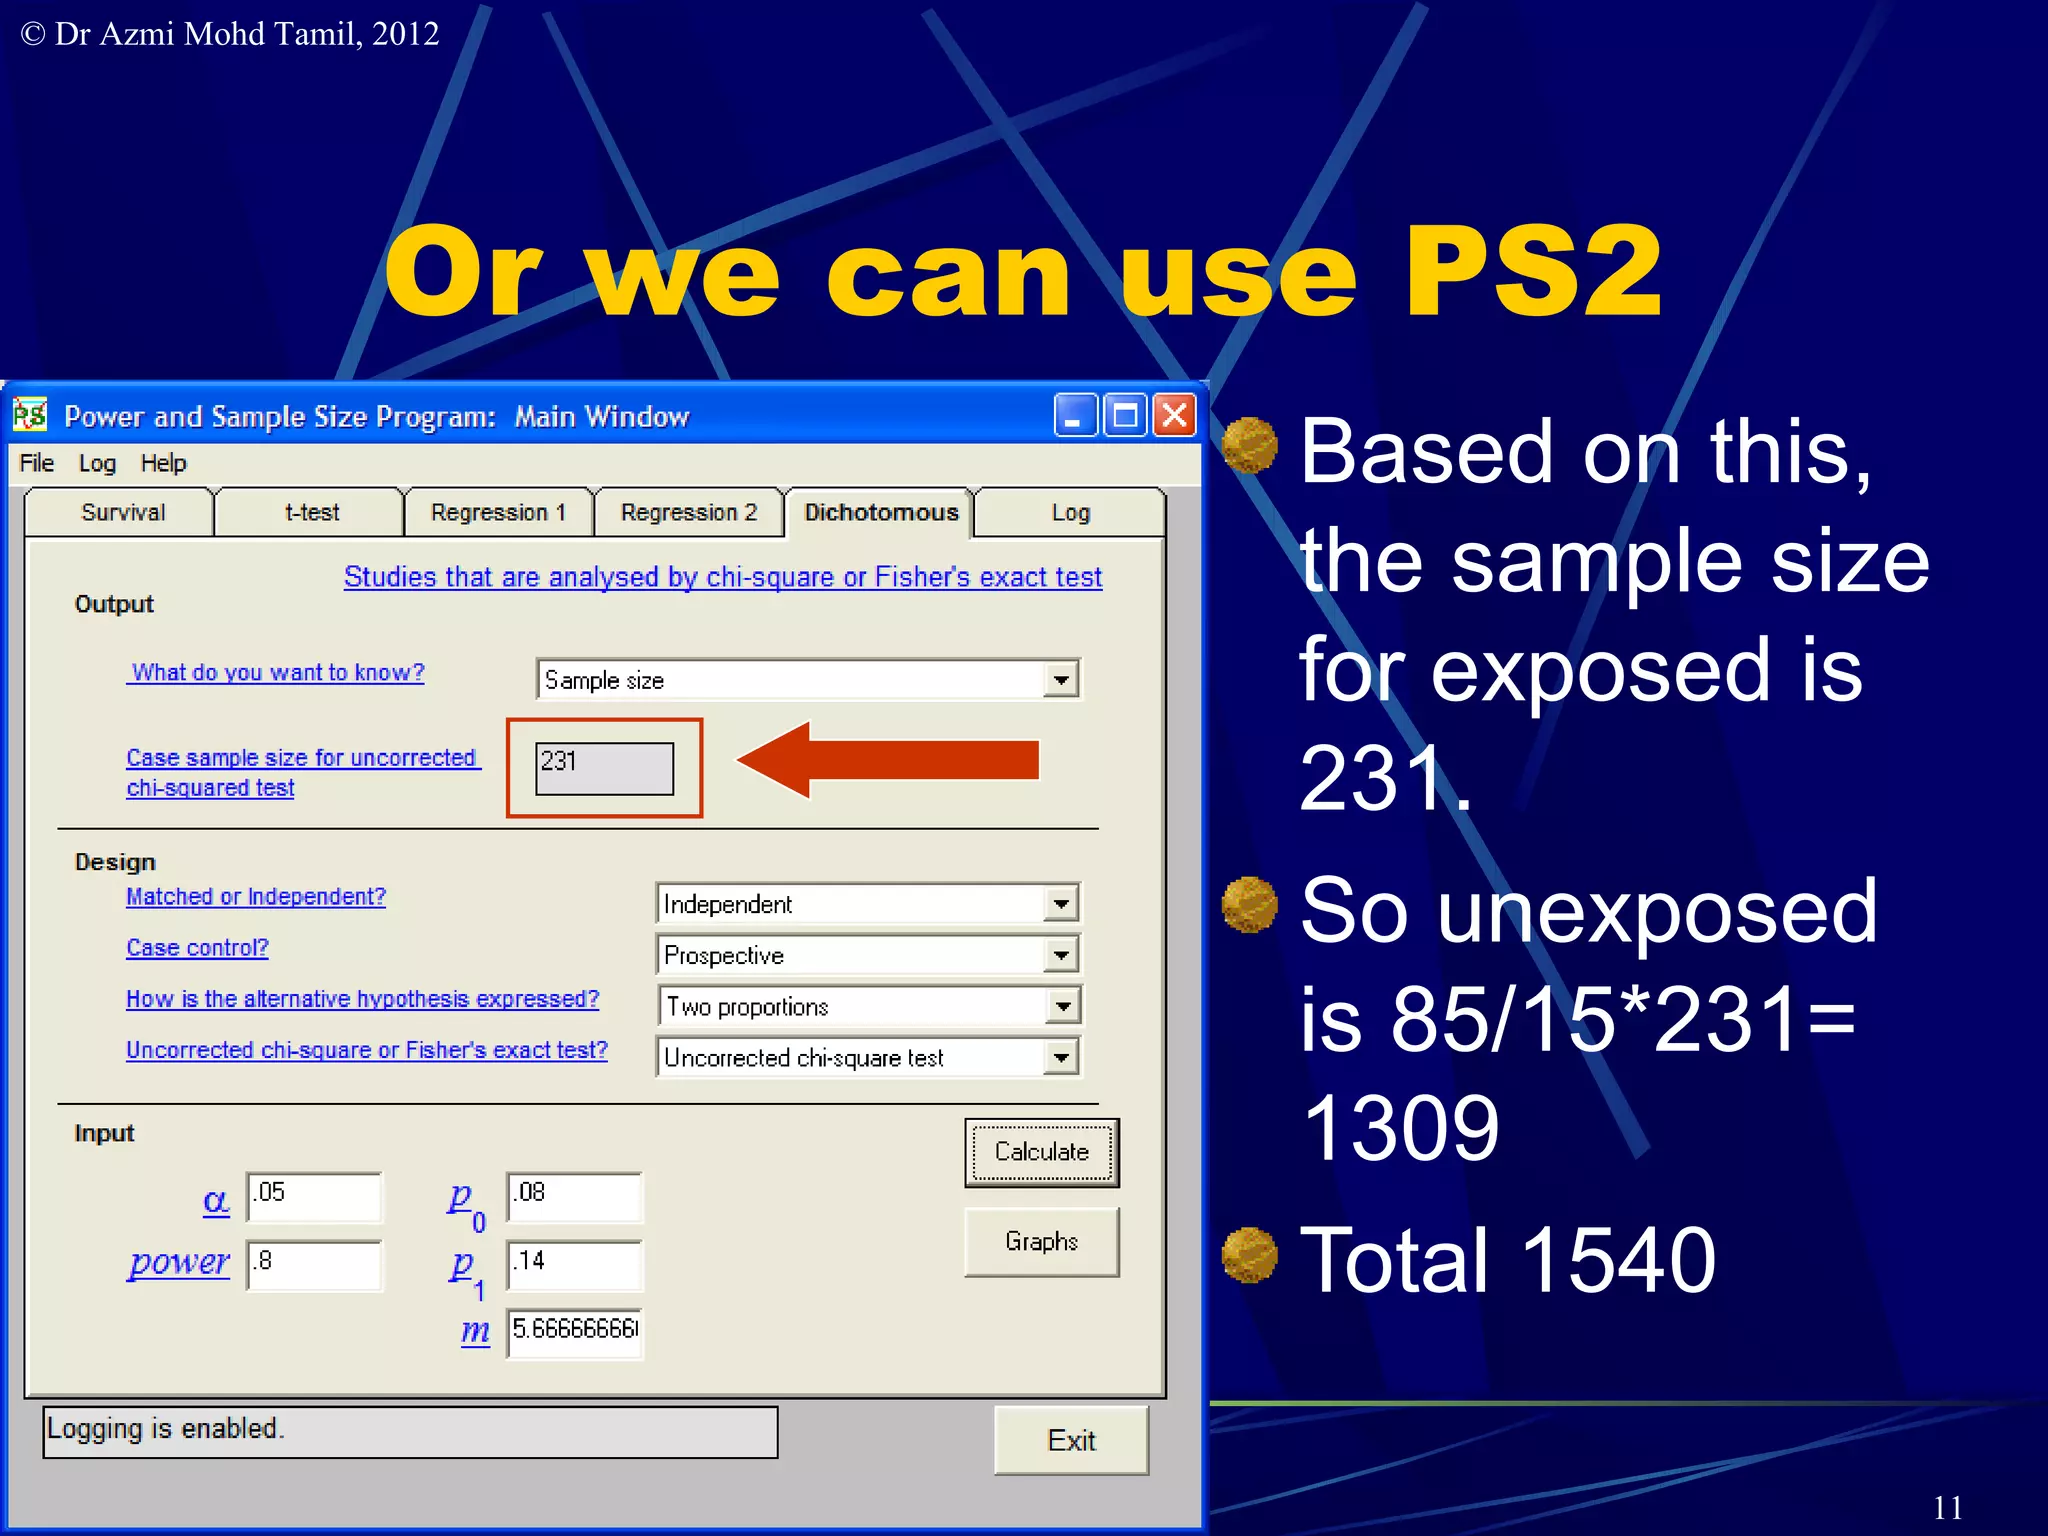
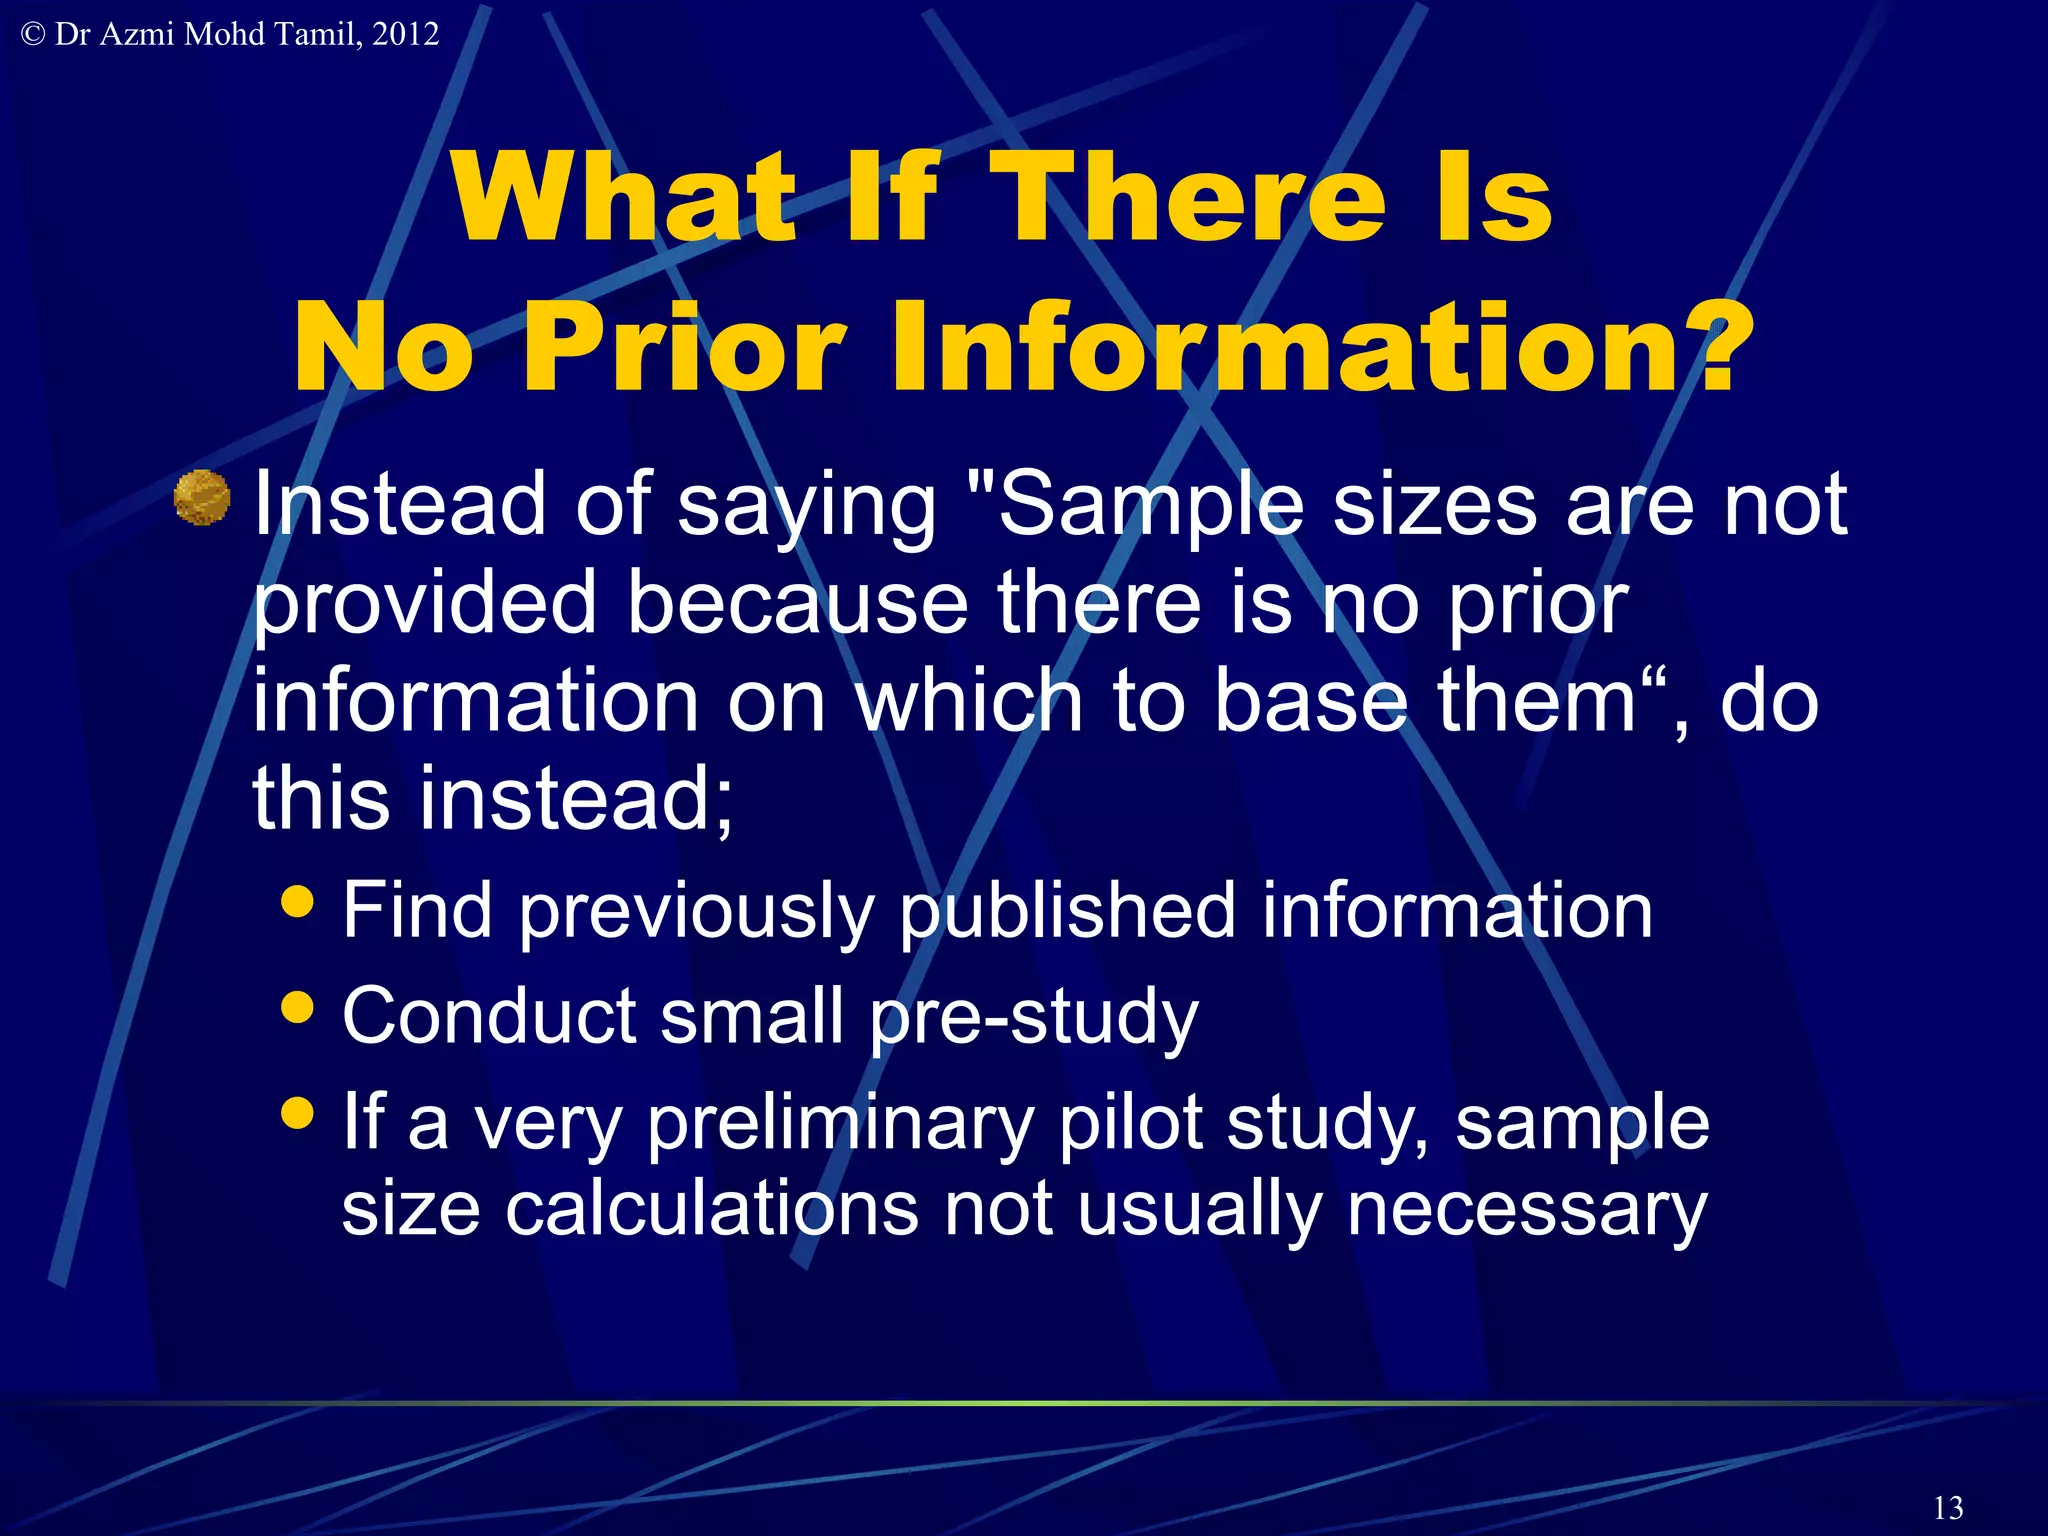
© Dr Azmi Mohd Tamil, 2012


                   Calculate Your Own
                   Sample Size – Part 4
                    Comparative Cross-Sectional Study –
                       Proving Association Between
                              Risk & Outcome


                                                          1
© Dr Azmi Mohd Tamil, 2012


                    Comparative Cross-
                       Sectional
              What is the main objective of the study?

                Association    between the major risk
                   factor being studied and the outcome?


                                                           2
© Dr Azmi Mohd Tamil, 2012


                             Cross-Sectional:
                             Risk & Outcome
              If you want to show an association between a
              risk factor and outcome in a cross-sectional
              study, then the sample size calculation is
              different.
              For example I want to prove that Indians
              (ethnicity = risk) are at higher risk of having
              diabetes mellitus (outcome) compared to
              other races in Malaysia, using a cross-
              sectional study.

                                                                3
© Dr Azmi Mohd Tamil, 2012


           Example – Indians in M’sia
            are of higher risk for DM
         From literature review, identify the rate of disease and
           proportion of those with the risk factor.
           Proportion of sample from unexposed (Others)
           population = 85%
           Proportion of sample from exposed (Indians)
           population = 15%
           P1=true proportion of DM in unexposed (Others)
           population = 8%
           P2=true proportion of DM in exposed (Indians)
           population =14%


                                                                    4
© Dr Azmi Mohd Tamil, 2012


          From Literature Review:
           Indians & Diabetes M.
                                       Disease + (14%)
                             Indians
                             (15%)
                                       Disease - (86%)
                             Sample
                             ratio
                                       Disease + (8%)
                             Others
                             (85%)
                                       Disease - (92%)

                                                         5
© Dr Azmi Mohd Tamil, 2012


                    Calculate Manually
  Calculate using these formulas (Fleiss JL. 1981. pp. 44-45)


  m=n1=size of sample from population 1               n2=size of sample from population 2
  P1=proportion of disease in population 1            P2=proportion of disease in population 2
  α= "Significance” = 0.05                            β=chance of not detecting a difference = 0.2
  1-β = Power = 0.8                                   r = n2/n1 = ratio of cases to controls
  P = (P1+rP2)/(r+1)                         Q = 1-P.
  n1 = m                                               n2 = rm
  From table A.2 in Fleiss;
      If 1- α is 0.95 then cα/2 is 1.960
      If 1- β is 0.80 then c1-beta is -0.842
                                                                                                 6
© Dr Azmi Mohd Tamil, 2012


                    Calculate Manually


                                         7
Or use StatCalc
© Dr Azmi Mohd Tamil, 2012


    n1 = 1422
    n2 = 251
    Total sample
    size required
    is 1673


                                               8
© Dr Azmi Mohd Tamil, 2012


                       StatCalc = Manual
              Sample size calculated manually is
              similar to the sample size generated by
              StatCalc.
              Since both methods use Fleiss JL
              (1981) unequal sample size formula as
              shown in the next slide.


                                                        9
© Dr Azmi Mohd Tamil, 2012


                             10
© Dr Azmi Mohd Tamil, 2012


                      Or we can use PS2
                                  Based on this,
                                  the sample size
                                  for exposed is
                                  231.
                                  So unexposed
                                  is 85/15*231=
                                  1309
                                  Total 1540

                                                11
© Dr Azmi Mohd Tamil, 2012


                             PS2 ≠ StatCalc
              PS2 uses Schlesselman’s method for
              independent case and control groups for
              studies that will be analysed using an
              uncorrected chi-square test
              PS2 uses Casagrande et al’s method for
              independent studies that will be analysed
              using Yates Correction or Fisher's exact test.
              PS2 only uses the generalisation of
              Casagrande's method proposed by Fleiss for
              unequal case & control sample size. Even
              then the answers differ; 1673 vs 1540

                                                               12
© Dr Azmi Mohd Tamil, 2012


                  What If There Is
                No Prior Information?
              Instead of saying "Sample sizes are not
              provided because there is no prior
              information on which to base them“, do
              this instead;
                Find  previously published information
                Conduct small pre-study
                If a very preliminary pilot study, sample
                 size calculations not usually necessary


                                                             13
© Dr Azmi Mohd Tamil, 2012


                             Conclusion
              You can calculate your own sample size.
              Tools are available and most of them are free.
              Decide what is your study design and choose
              the appropriate method to calculate the
              sample size.
              If despite following ALL these notes
              fastidiously, your proposal is still rejected by
              the committee due to sample size, kindly SEE
              THEM, not us.


                                                                 14
© Dr Azmi Mohd Tamil, 2012


               References (incl. for StatCalc)
             Fleiss JL. Statistical methods for rates and proportions. New
             York: John Wiley and Sons, 1981.
             Gehan EA. Clinical Trials in Cancer Research. Environmental
             Health Perspectives Vol. 32, pp. 3148, 1979.
             Jones SR, Carley S & Harrison M. An introduction to power and
             sample size estimation. Emergency Medical Journal
             2003;20;453-458. 2003
             Kish L. Survey sampling. John Wiley & Sons, N.Y., 1965.
             Krejcie, R.V. & Morgan, D.W. (1970). Determining sample size
             for research activities. Educational & Psychological
             Measurement, 30, 607-610.
             Snedecor GW, Cochran WG. 1989. Statistical Methods. 8th Ed.
             Ames: Iowa State Press.


                                                                             15
© Dr Azmi Mohd Tamil, 2012


                         References (PS2)
              Dupont WD, Plummer WD, Jr: Power and Sample Size Calculations: A Review
              and Computer Program. Controlled Clinical Trials 11:116-128, 1990
              Dupont WD, Plummer WD, Jr: Power and Sample Size Calculations for Studies
              Involving Linear Regression. Controlled Clinical Trials 19:589-601, 1998
              Schoenfeld DA, Richter JR: Nomograms for calculating the number of patients
              needed for a clinical trial with survival as an endpoint. Biometrics 38:163-170,
              1982
              Pearson ES, Hartley HO: Biometrika Tables for Statisticians Vol. I 3rd Ed.
              Cambridge: Cambridge University Press, 1970
              Schlesselman JJ: Case-Control Studies: Design, Conduct, Analysis. New York:
              Oxford University Press, 1982
              Casagrande JT, Pike MC, Smith PG: An improved approximate formula for
              calculating sample sizes for comparing two binomial distributions. Biometrics
              34:483-486, 1978
              Dupont WD: Power calculations for matched case-control studies. Biometrics
              44:1157-1168, 1988
              Fleiss JL. Statistical methods for rates and proportions. New York: John Wiley
              and Sons, 1981.


                                                                                                 16
© Dr Azmi Mohd Tamil, 2012


                             THANK
                              YOU

4. Calculate samplesize for cross-sectional studies

  • 1.
    © Dr AzmiMohd Tamil, 2012 Calculate Your Own Sample Size – Part 4 Comparative Cross-Sectional Study – Proving Association Between Risk & Outcome 1
  • 2.
    © Dr AzmiMohd Tamil, 2012 Comparative Cross- Sectional What is the main objective of the study?  Association between the major risk factor being studied and the outcome? 2
  • 3.
    © Dr AzmiMohd Tamil, 2012 Cross-Sectional: Risk & Outcome If you want to show an association between a risk factor and outcome in a cross-sectional study, then the sample size calculation is different. For example I want to prove that Indians (ethnicity = risk) are at higher risk of having diabetes mellitus (outcome) compared to other races in Malaysia, using a cross- sectional study. 3
  • 4.
    © Dr AzmiMohd Tamil, 2012 Example – Indians in M’sia are of higher risk for DM From literature review, identify the rate of disease and proportion of those with the risk factor. Proportion of sample from unexposed (Others) population = 85% Proportion of sample from exposed (Indians) population = 15% P1=true proportion of DM in unexposed (Others) population = 8% P2=true proportion of DM in exposed (Indians) population =14% 4
  • 5.
    © Dr AzmiMohd Tamil, 2012 From Literature Review: Indians & Diabetes M. Disease + (14%) Indians (15%) Disease - (86%) Sample ratio Disease + (8%) Others (85%) Disease - (92%) 5
  • 6.
    © Dr AzmiMohd Tamil, 2012 Calculate Manually Calculate using these formulas (Fleiss JL. 1981. pp. 44-45) m=n1=size of sample from population 1 n2=size of sample from population 2 P1=proportion of disease in population 1 P2=proportion of disease in population 2 α= "Significance” = 0.05 β=chance of not detecting a difference = 0.2 1-β = Power = 0.8 r = n2/n1 = ratio of cases to controls P = (P1+rP2)/(r+1) Q = 1-P. n1 = m n2 = rm From table A.2 in Fleiss; If 1- α is 0.95 then cα/2 is 1.960 If 1- β is 0.80 then c1-beta is -0.842 6
  • 7.
    © Dr AzmiMohd Tamil, 2012 Calculate Manually 7
  • 8.
    Or use StatCalc ©Dr Azmi Mohd Tamil, 2012 n1 = 1422 n2 = 251 Total sample size required is 1673 8
  • 9.
    © Dr AzmiMohd Tamil, 2012 StatCalc = Manual Sample size calculated manually is similar to the sample size generated by StatCalc. Since both methods use Fleiss JL (1981) unequal sample size formula as shown in the next slide. 9
  • 10.
    © Dr AzmiMohd Tamil, 2012 10
  • 11.
    © Dr AzmiMohd Tamil, 2012 Or we can use PS2 Based on this, the sample size for exposed is 231. So unexposed is 85/15*231= 1309 Total 1540 11
  • 12.
    © Dr AzmiMohd Tamil, 2012 PS2 ≠ StatCalc PS2 uses Schlesselman’s method for independent case and control groups for studies that will be analysed using an uncorrected chi-square test PS2 uses Casagrande et al’s method for independent studies that will be analysed using Yates Correction or Fisher's exact test. PS2 only uses the generalisation of Casagrande's method proposed by Fleiss for unequal case & control sample size. Even then the answers differ; 1673 vs 1540 12
  • 13.
    © Dr AzmiMohd Tamil, 2012 What If There Is No Prior Information? Instead of saying "Sample sizes are not provided because there is no prior information on which to base them“, do this instead;  Find previously published information  Conduct small pre-study  If a very preliminary pilot study, sample size calculations not usually necessary 13
  • 14.
    © Dr AzmiMohd Tamil, 2012 Conclusion You can calculate your own sample size. Tools are available and most of them are free. Decide what is your study design and choose the appropriate method to calculate the sample size. If despite following ALL these notes fastidiously, your proposal is still rejected by the committee due to sample size, kindly SEE THEM, not us. 14
  • 15.
    © Dr AzmiMohd Tamil, 2012 References (incl. for StatCalc) Fleiss JL. Statistical methods for rates and proportions. New York: John Wiley and Sons, 1981. Gehan EA. Clinical Trials in Cancer Research. Environmental Health Perspectives Vol. 32, pp. 3148, 1979. Jones SR, Carley S & Harrison M. An introduction to power and sample size estimation. Emergency Medical Journal 2003;20;453-458. 2003 Kish L. Survey sampling. John Wiley & Sons, N.Y., 1965. Krejcie, R.V. & Morgan, D.W. (1970). Determining sample size for research activities. Educational & Psychological Measurement, 30, 607-610. Snedecor GW, Cochran WG. 1989. Statistical Methods. 8th Ed. Ames: Iowa State Press. 15
  • 16.
    © Dr AzmiMohd Tamil, 2012 References (PS2) Dupont WD, Plummer WD, Jr: Power and Sample Size Calculations: A Review and Computer Program. Controlled Clinical Trials 11:116-128, 1990 Dupont WD, Plummer WD, Jr: Power and Sample Size Calculations for Studies Involving Linear Regression. Controlled Clinical Trials 19:589-601, 1998 Schoenfeld DA, Richter JR: Nomograms for calculating the number of patients needed for a clinical trial with survival as an endpoint. Biometrics 38:163-170, 1982 Pearson ES, Hartley HO: Biometrika Tables for Statisticians Vol. I 3rd Ed. Cambridge: Cambridge University Press, 1970 Schlesselman JJ: Case-Control Studies: Design, Conduct, Analysis. New York: Oxford University Press, 1982 Casagrande JT, Pike MC, Smith PG: An improved approximate formula for calculating sample sizes for comparing two binomial distributions. Biometrics 34:483-486, 1978 Dupont WD: Power calculations for matched case-control studies. Biometrics 44:1157-1168, 1988 Fleiss JL. Statistical methods for rates and proportions. New York: John Wiley and Sons, 1981. 16
  • 17.
    © Dr AzmiMohd Tamil, 2012 THANK YOU