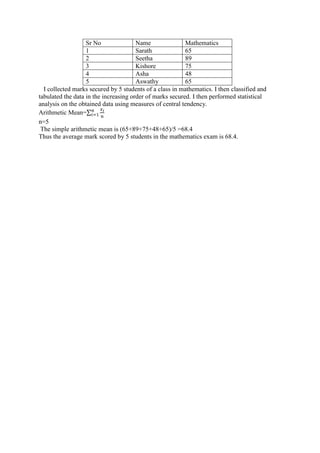
MEASURES OF CENTRAL TENDENCY ( AVERAGES)<br />                      <br />INTRODUCTION  <br />                                Classification and tabulation are two statistical methods by which the massive numerical facts are condensed. No doubt, these two are very important and useful methods. These two methods can be used for arranging the data in a manner which will make the data simple and understandable. But these two methods do not throw light on important characteristics of data. <br />                                    It is difficult for everybody to understand or remember a large set of facts. Therefore one would like to know certain values which will  represent or summarise all these  facts. After all, the basic purpose of  statistical analysis is to develop  summary measures in statistical analysis is averages    or  measures of central tendency.    <br />DEFINITION <br />                      According to Clark “An average is a figure that represents the whole group “.  And according to Croxton and cowden “An average is a single value within the range of the data that is used to represent all the values in the series. Since an average is somewhere within the range of the data it is sometimes called measures of central value. <br /> ARITHEMETIC MEAN                       Arithmetic mean is one of the measures of central tendency. It is mathematical average. It is a method of representing the whole data by one figure.  It is a simple measure and most widely used.  <br />          i=1nxin<br />MEDIAN<br />                Median is defined as the value of the middle item  when the data are arranged  in an ascending or descending order of magnitude. Thus, in an ungrouped frequency  distribution if the `n’ values are arranged in ascending or descending order of magnitude , the median is the middle value if `n’ is even is odd . When `n’ is even , the median is the mean of the two middle values.<br />          The series consist of odd number of items, to find out the value of the middle item, we use the formula,<br />                                                              n+1/2<br />In the case of a grouped series ,the median is calculated  by liner interpolation  with the following formula, <br />               M = l 1+l 2-l 1f(m-c)<br />               M =  median<br />              l 1  =   the lower limit of the class in which the median lies <br />             l 2  =   the upper limit of the class in which the median lies <br />              f    =   the frequency of the class  in which the median lies <br />              m  =   the middle item or  (n+1) 2 th , where `n’  stands for total  number o items.<br />              C   = the cumulative frequency  of the class preceding the one in which the median lies .  <br />                  <br />MODE<br />          The mode is another  measure of central tendency . It is the value at  the point  around which the items are most heavily concentrated . In the case of grouped data , mode is determined by the following formula: <br />         M  = l1f1-f0f1-f0+(f1-f2)×i<br />           l 1=  the lower value of the class in which the mode lies <br />           f 1= the frequency of the class in which the mode lies   <br />           f 0= the frequency of the class preceding the model class <br />           f 2= the frequency of the class succeeded  the modal class<br />        i   = the class –interval of the model<br /> HARMONIC MEAN<br />                The Harmonic Mean is defined as the reciprocal of the arithmetic mean of the reciprocals of individual observation . symbolically ,<br />                  HM= n1x1+1x2+1x3+…+(1xn)=Reciprocal  (∑1/x) /n<br />In case of grouped data<br />     HM = Reciprocal of  i=1n(fi×1xi)<br />GEOMETRIC  MEAN <br />          Apart from the three measures of central tendency as discussed above, there are two other  means that are used sometimes in business and economics. These are the Geometric mean. We discuss below both these means. First, we take up the Geometric mean.<br />                                          Geometric mean is defined at the n th root of the product of n observations of a distribution. Symbolically, GM = nx1.x 2…x n. If we have only two observation , say , 4 and 16 then GM=√4×16 =64=8.Similarly, if there are three observations, then we have to calculate the cube root of the product of these three observations; and so on. When the numbers of  items is large, it becomes extremely difficult to multiply the numbers and to calculate the root. To simplify calculations, logarithms are used. <br />    If you have find out the Geometric Mean of 2, 4 and 8, then we find<br />                             Log GM = logxi/n<br />     When the data are given in the form of frequency distribution , then the Geometric Mean can be obtained by the formula             <br /> GM= Antilog ∑f.logx/n <br />                MEASURS OF DISPERSION<br /> Introduction<br />           The Means are just the Measures of  central tendency and do not indicate the extent of variability in a distribution. A point worth noting is that a high degree of uniformity is a desirable quality . If in a business there are high degree of variability  in the raw materials , then it could find mass production uneconomical. There are five measures of dispersion:<br />The  Range <br /> The Quartile deviation or interquartile range<br /> The mean deviation<br /> The standard deviation <br />The Lorence curve<br />THE RANGE<br />The simplest measure of dispersion is the range , which is the difference between the maximum value and minimum value of data. And the coefficient of range is calculated by the formula :<br />                                                      L-S/L+S<br /> <br />THE QUARTILE DEVIATION<br />The quartile deviation is better measure of variation in a distribution than the range . Here , the middle 50 percent of the distribution is used by avoiding the 25 percent of distribution at both the ends.<br />  Quartile Deviation = Q 3 –Q ½ <br />Coefficient of QD = Q 3- Q1/ Q3 +Q1<br />THE MEAN DEVIATION<br />The mean deviation is also known as the average deviation . As the name implies ,  it is the average of absolute amounts by which the  individual items deviate from the mean . Since the positive deviations from the mean are equal to the negative deviations, while computing the mean deviation , we ignore positive and negative signs. Symbolically, <br />             MD =∑│x│/n<br /> MD = mean deviation<br />│ X│     = deviation of an item from the mean , ignore positive and negative<br />        n     = the total number of observation.<br />THE STANDARD DEVIATION<br /> <br />                       The fourth method of dispersion to be considered is the standard deviation . It is similar to the mean deviation is that here too deviations are measured from the mean. At the same time, the standard  deviation is preferred to the mean deviation or the quartile deviation or the range because it has  desirable mathematical properties. Symbolically, <br />                        σ = ∑(xi-μ)2/N <br />Discribe  a real life situation  and  measures  use to describe the data.x2<br />          <br />    Suppose 5 student have secured the following  marks in their mathematics examination<br />Sr NoNameMathematics1Sarath652Seetha893Kishore754Asha485Aswathy65<br />   I collected marks secured by 5 students of a class in mathematics. I then classified and tabulated the data in the increasing order of marks secured. I then performed statistical analysis on the obtained data using measures of central tendency.<br />Arithmetic Mean=i=1nxin <br />n=5<br /> The simple arithmetic mean is (65+89+75+48+65)/5 =68.4<br />Thus the average mark scored by 5 students in the mathematics exam is 68.4.<br />
Q.t
Q.t
Q.t

Q.t

  • 1.
    MEASURES OF CENTRALTENDENCY ( AVERAGES)<br /> <br />INTRODUCTION <br /> Classification and tabulation are two statistical methods by which the massive numerical facts are condensed. No doubt, these two are very important and useful methods. These two methods can be used for arranging the data in a manner which will make the data simple and understandable. But these two methods do not throw light on important characteristics of data. <br /> It is difficult for everybody to understand or remember a large set of facts. Therefore one would like to know certain values which will represent or summarise all these facts. After all, the basic purpose of statistical analysis is to develop summary measures in statistical analysis is averages or measures of central tendency. <br />DEFINITION <br /> According to Clark “An average is a figure that represents the whole group “. And according to Croxton and cowden “An average is a single value within the range of the data that is used to represent all the values in the series. Since an average is somewhere within the range of the data it is sometimes called measures of central value. <br /> ARITHEMETIC MEAN Arithmetic mean is one of the measures of central tendency. It is mathematical average. It is a method of representing the whole data by one figure. It is a simple measure and most widely used. <br /> i=1nxin<br />MEDIAN<br /> Median is defined as the value of the middle item when the data are arranged in an ascending or descending order of magnitude. Thus, in an ungrouped frequency distribution if the `n’ values are arranged in ascending or descending order of magnitude , the median is the middle value if `n’ is even is odd . When `n’ is even , the median is the mean of the two middle values.<br /> The series consist of odd number of items, to find out the value of the middle item, we use the formula,<br /> n+1/2<br />In the case of a grouped series ,the median is calculated by liner interpolation with the following formula, <br /> M = l 1+l 2-l 1f(m-c)<br /> M = median<br /> l 1 = the lower limit of the class in which the median lies <br /> l 2 = the upper limit of the class in which the median lies <br /> f = the frequency of the class in which the median lies <br /> m = the middle item or (n+1) 2 th , where `n’ stands for total number o items.<br /> C = the cumulative frequency of the class preceding the one in which the median lies . <br /> <br />MODE<br /> The mode is another measure of central tendency . It is the value at the point around which the items are most heavily concentrated . In the case of grouped data , mode is determined by the following formula: <br /> M = l1f1-f0f1-f0+(f1-f2)×i<br /> l 1= the lower value of the class in which the mode lies <br /> f 1= the frequency of the class in which the mode lies <br /> f 0= the frequency of the class preceding the model class <br /> f 2= the frequency of the class succeeded the modal class<br /> i = the class –interval of the model<br /> HARMONIC MEAN<br /> The Harmonic Mean is defined as the reciprocal of the arithmetic mean of the reciprocals of individual observation . symbolically ,<br /> HM= n1x1+1x2+1x3+…+(1xn)=Reciprocal (∑1/x) /n<br />In case of grouped data<br /> HM = Reciprocal of i=1n(fi×1xi)<br />GEOMETRIC MEAN <br /> Apart from the three measures of central tendency as discussed above, there are two other means that are used sometimes in business and economics. These are the Geometric mean. We discuss below both these means. First, we take up the Geometric mean.<br /> Geometric mean is defined at the n th root of the product of n observations of a distribution. Symbolically, GM = nx1.x 2…x n. If we have only two observation , say , 4 and 16 then GM=√4×16 =64=8.Similarly, if there are three observations, then we have to calculate the cube root of the product of these three observations; and so on. When the numbers of items is large, it becomes extremely difficult to multiply the numbers and to calculate the root. To simplify calculations, logarithms are used. <br /> If you have find out the Geometric Mean of 2, 4 and 8, then we find<br /> Log GM = logxi/n<br /> When the data are given in the form of frequency distribution , then the Geometric Mean can be obtained by the formula <br /> GM= Antilog ∑f.logx/n <br /> MEASURS OF DISPERSION<br /> Introduction<br /> The Means are just the Measures of central tendency and do not indicate the extent of variability in a distribution. A point worth noting is that a high degree of uniformity is a desirable quality . If in a business there are high degree of variability in the raw materials , then it could find mass production uneconomical. There are five measures of dispersion:<br />The Range <br /> The Quartile deviation or interquartile range<br /> The mean deviation<br /> The standard deviation <br />The Lorence curve<br />THE RANGE<br />The simplest measure of dispersion is the range , which is the difference between the maximum value and minimum value of data. And the coefficient of range is calculated by the formula :<br /> L-S/L+S<br /> <br />THE QUARTILE DEVIATION<br />The quartile deviation is better measure of variation in a distribution than the range . Here , the middle 50 percent of the distribution is used by avoiding the 25 percent of distribution at both the ends.<br /> Quartile Deviation = Q 3 –Q ½ <br />Coefficient of QD = Q 3- Q1/ Q3 +Q1<br />THE MEAN DEVIATION<br />The mean deviation is also known as the average deviation . As the name implies , it is the average of absolute amounts by which the individual items deviate from the mean . Since the positive deviations from the mean are equal to the negative deviations, while computing the mean deviation , we ignore positive and negative signs. Symbolically, <br /> MD =∑│x│/n<br /> MD = mean deviation<br />│ X│ = deviation of an item from the mean , ignore positive and negative<br /> n = the total number of observation.<br />THE STANDARD DEVIATION<br /> <br /> The fourth method of dispersion to be considered is the standard deviation . It is similar to the mean deviation is that here too deviations are measured from the mean. At the same time, the standard deviation is preferred to the mean deviation or the quartile deviation or the range because it has desirable mathematical properties. Symbolically, <br /> σ = ∑(xi-μ)2/N <br />Discribe a real life situation and measures use to describe the data.x2<br /> <br /> Suppose 5 student have secured the following marks in their mathematics examination<br />Sr NoNameMathematics1Sarath652Seetha893Kishore754Asha485Aswathy65<br /> I collected marks secured by 5 students of a class in mathematics. I then classified and tabulated the data in the increasing order of marks secured. I then performed statistical analysis on the obtained data using measures of central tendency.<br />Arithmetic Mean=i=1nxin <br />n=5<br /> The simple arithmetic mean is (65+89+75+48+65)/5 =68.4<br />Thus the average mark scored by 5 students in the mathematics exam is 68.4.<br />