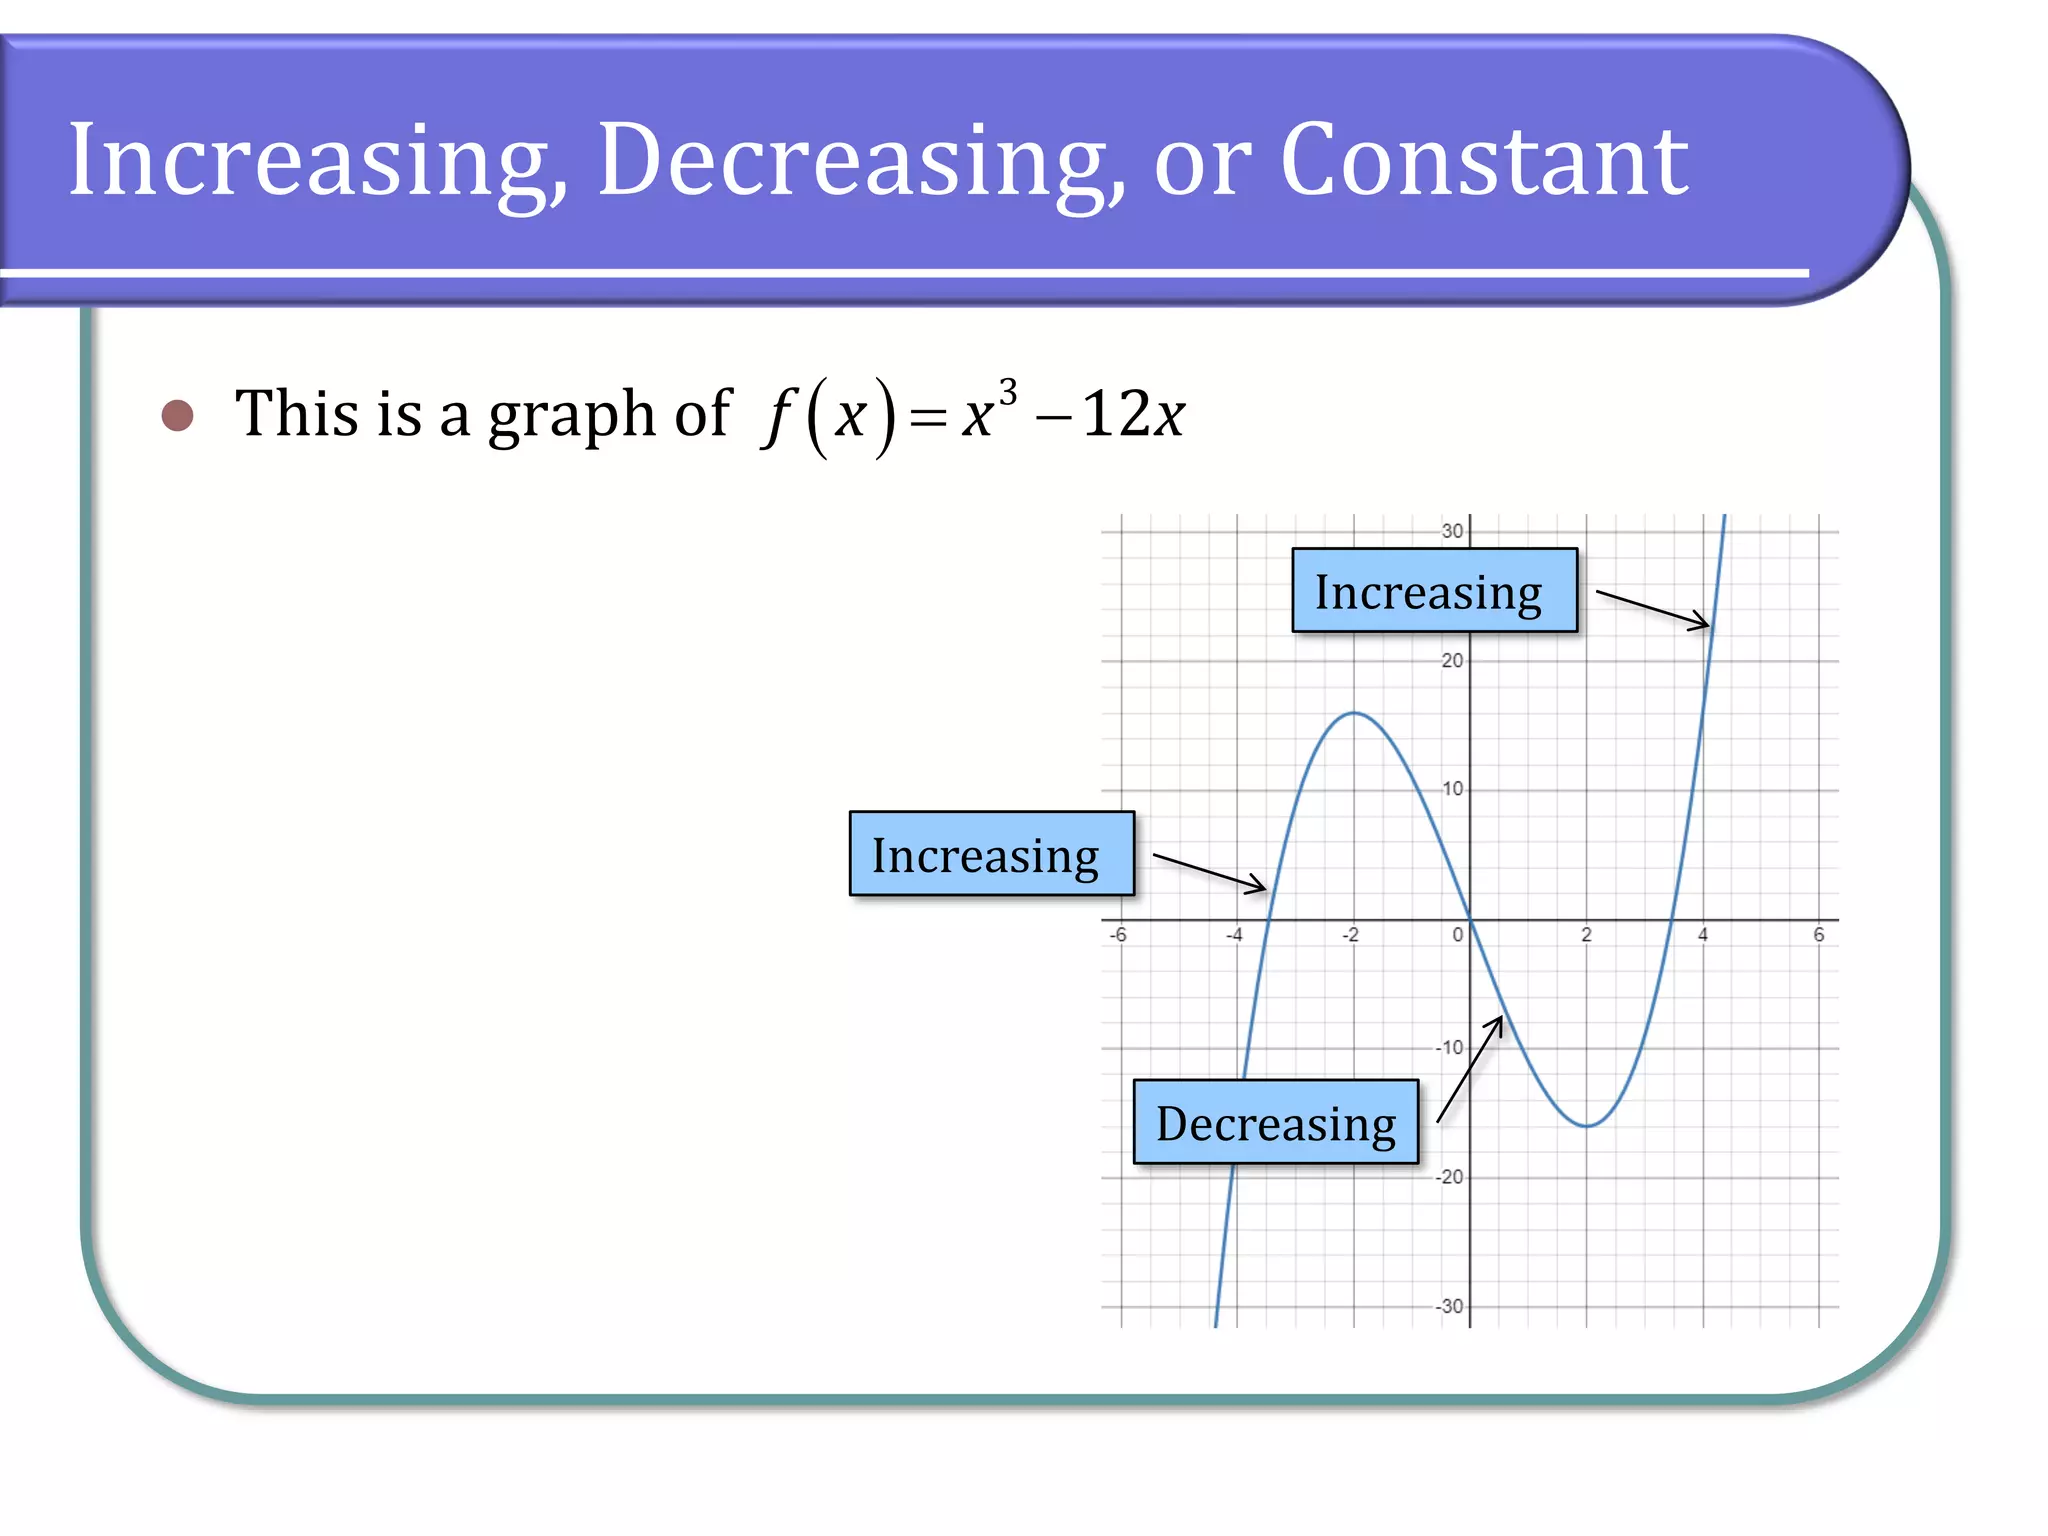
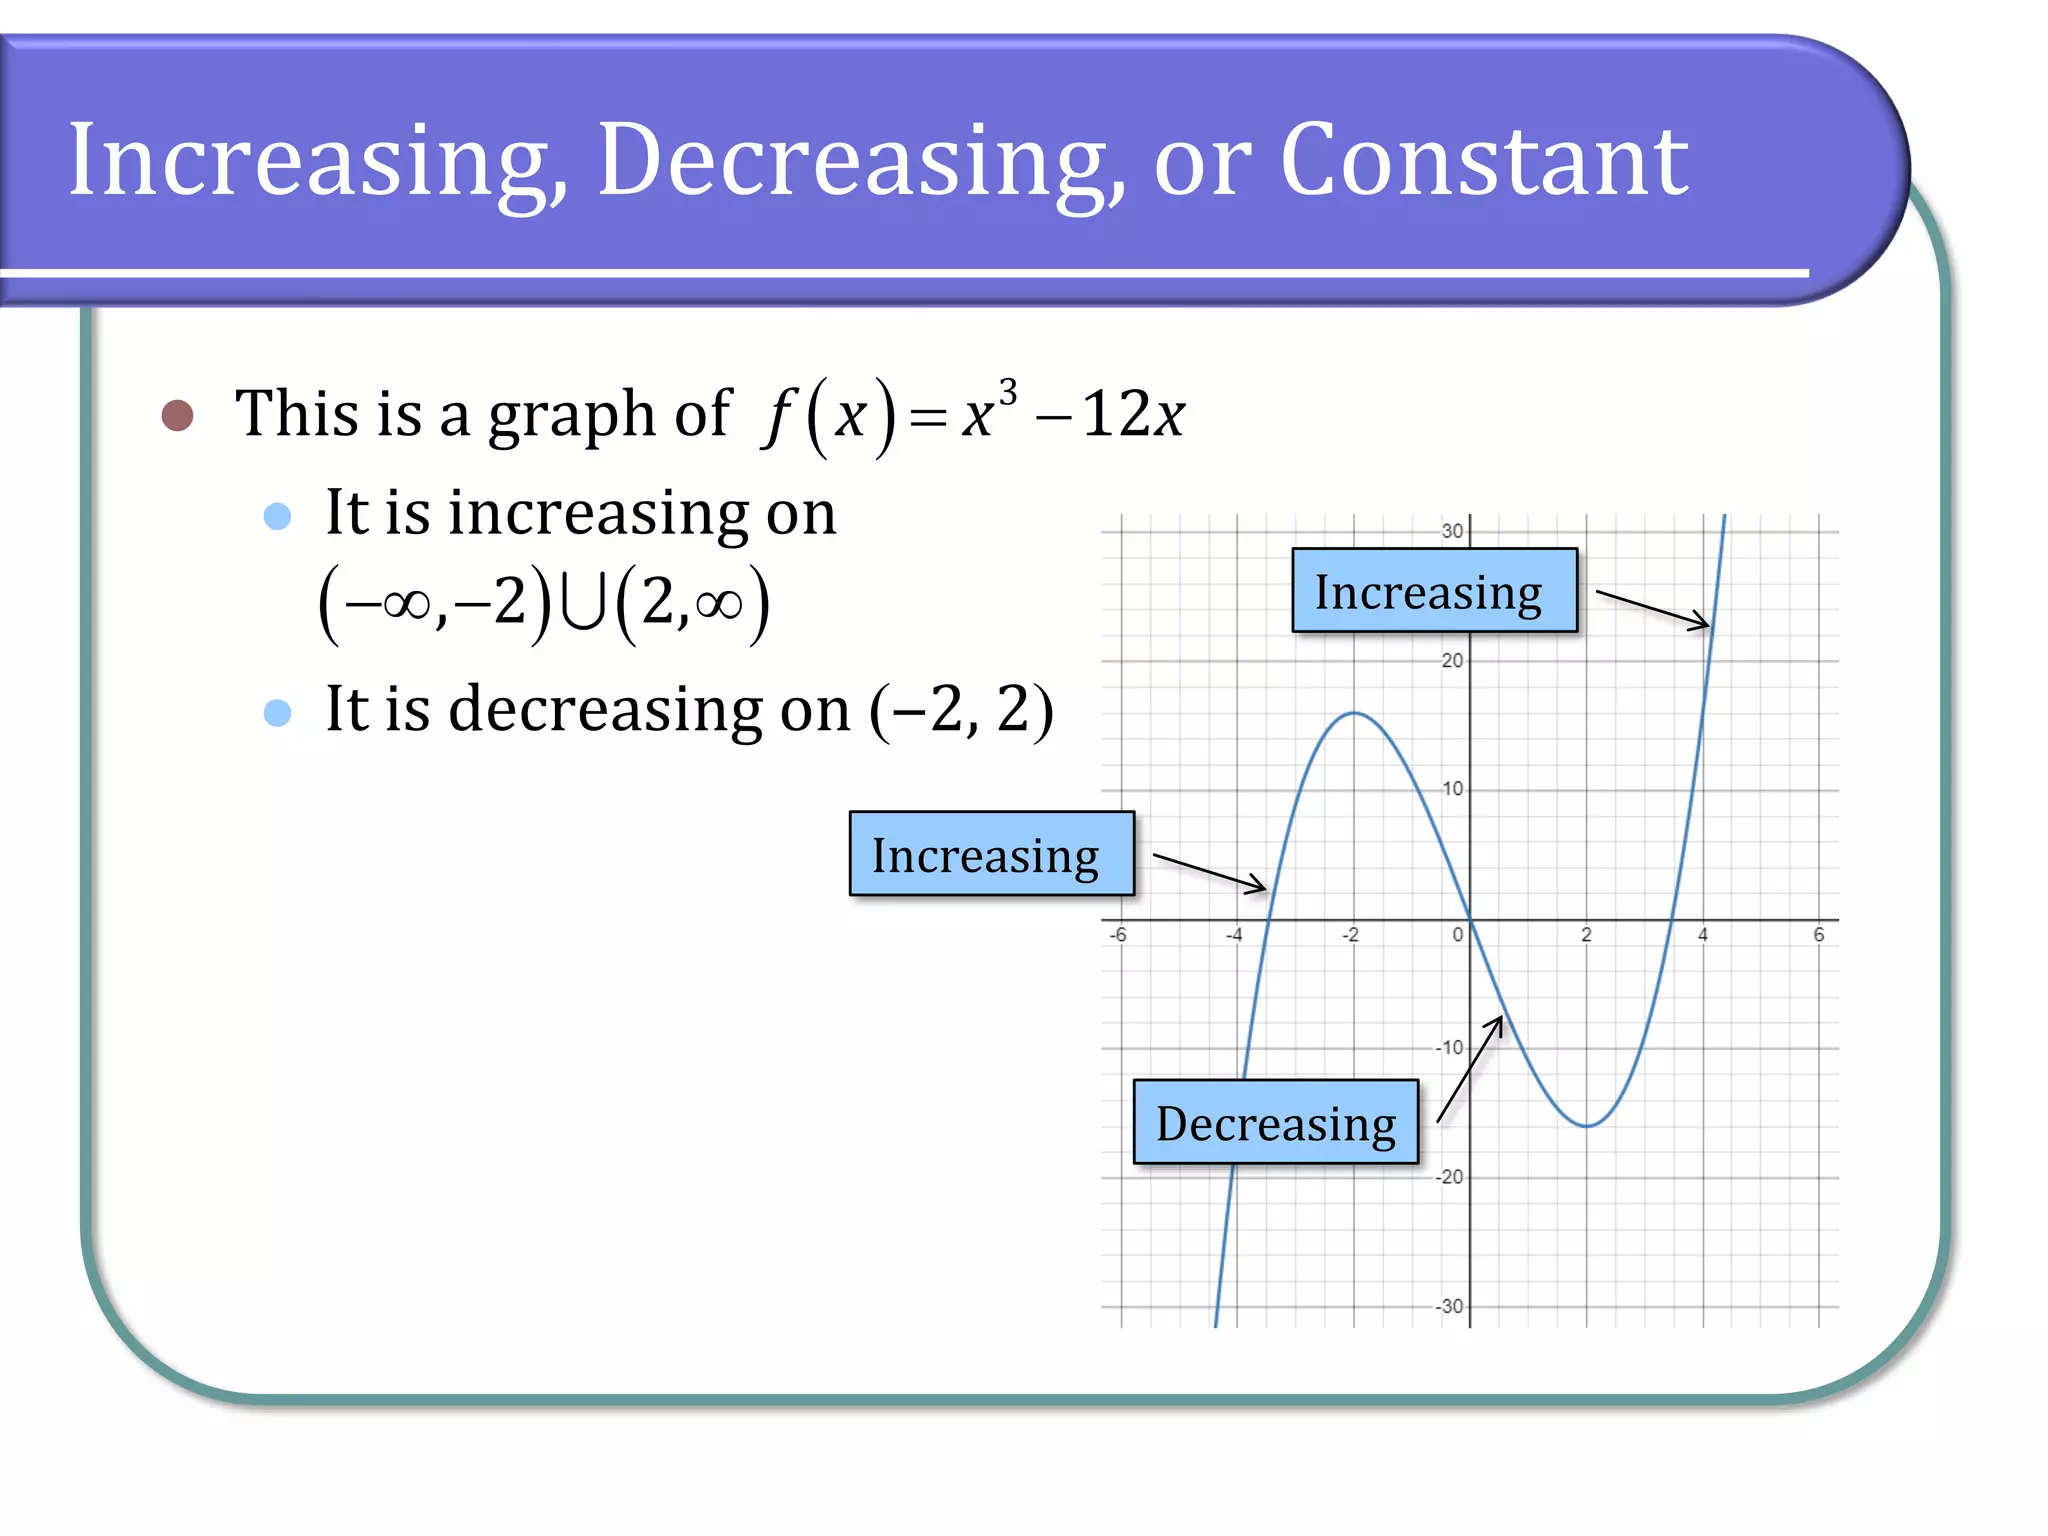
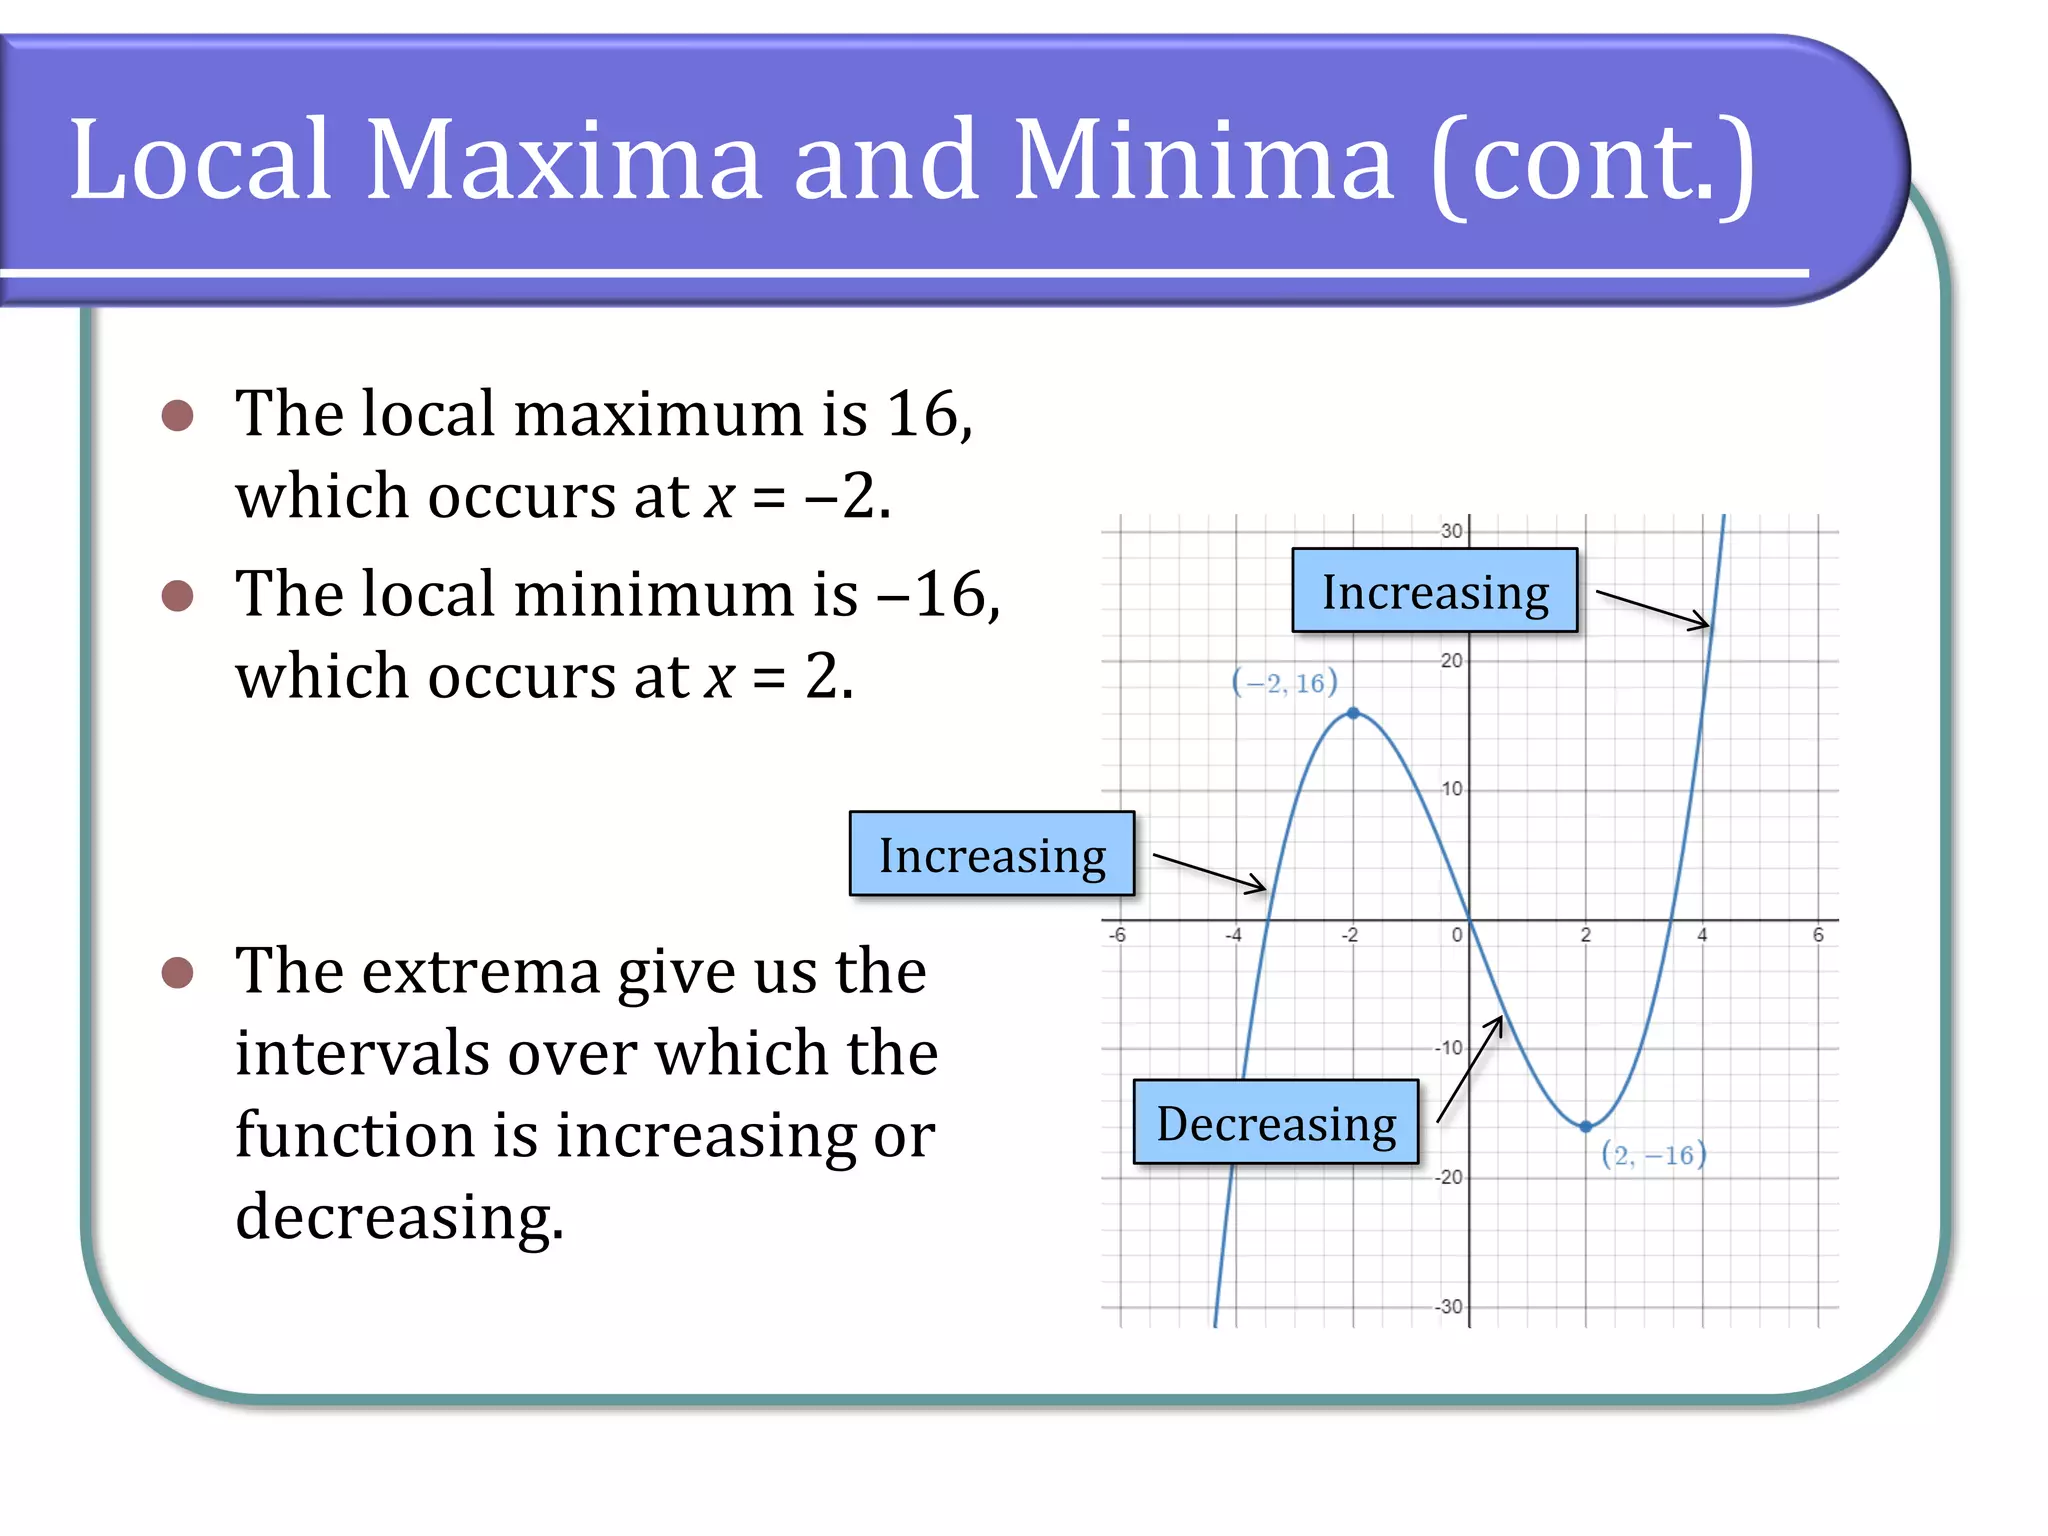
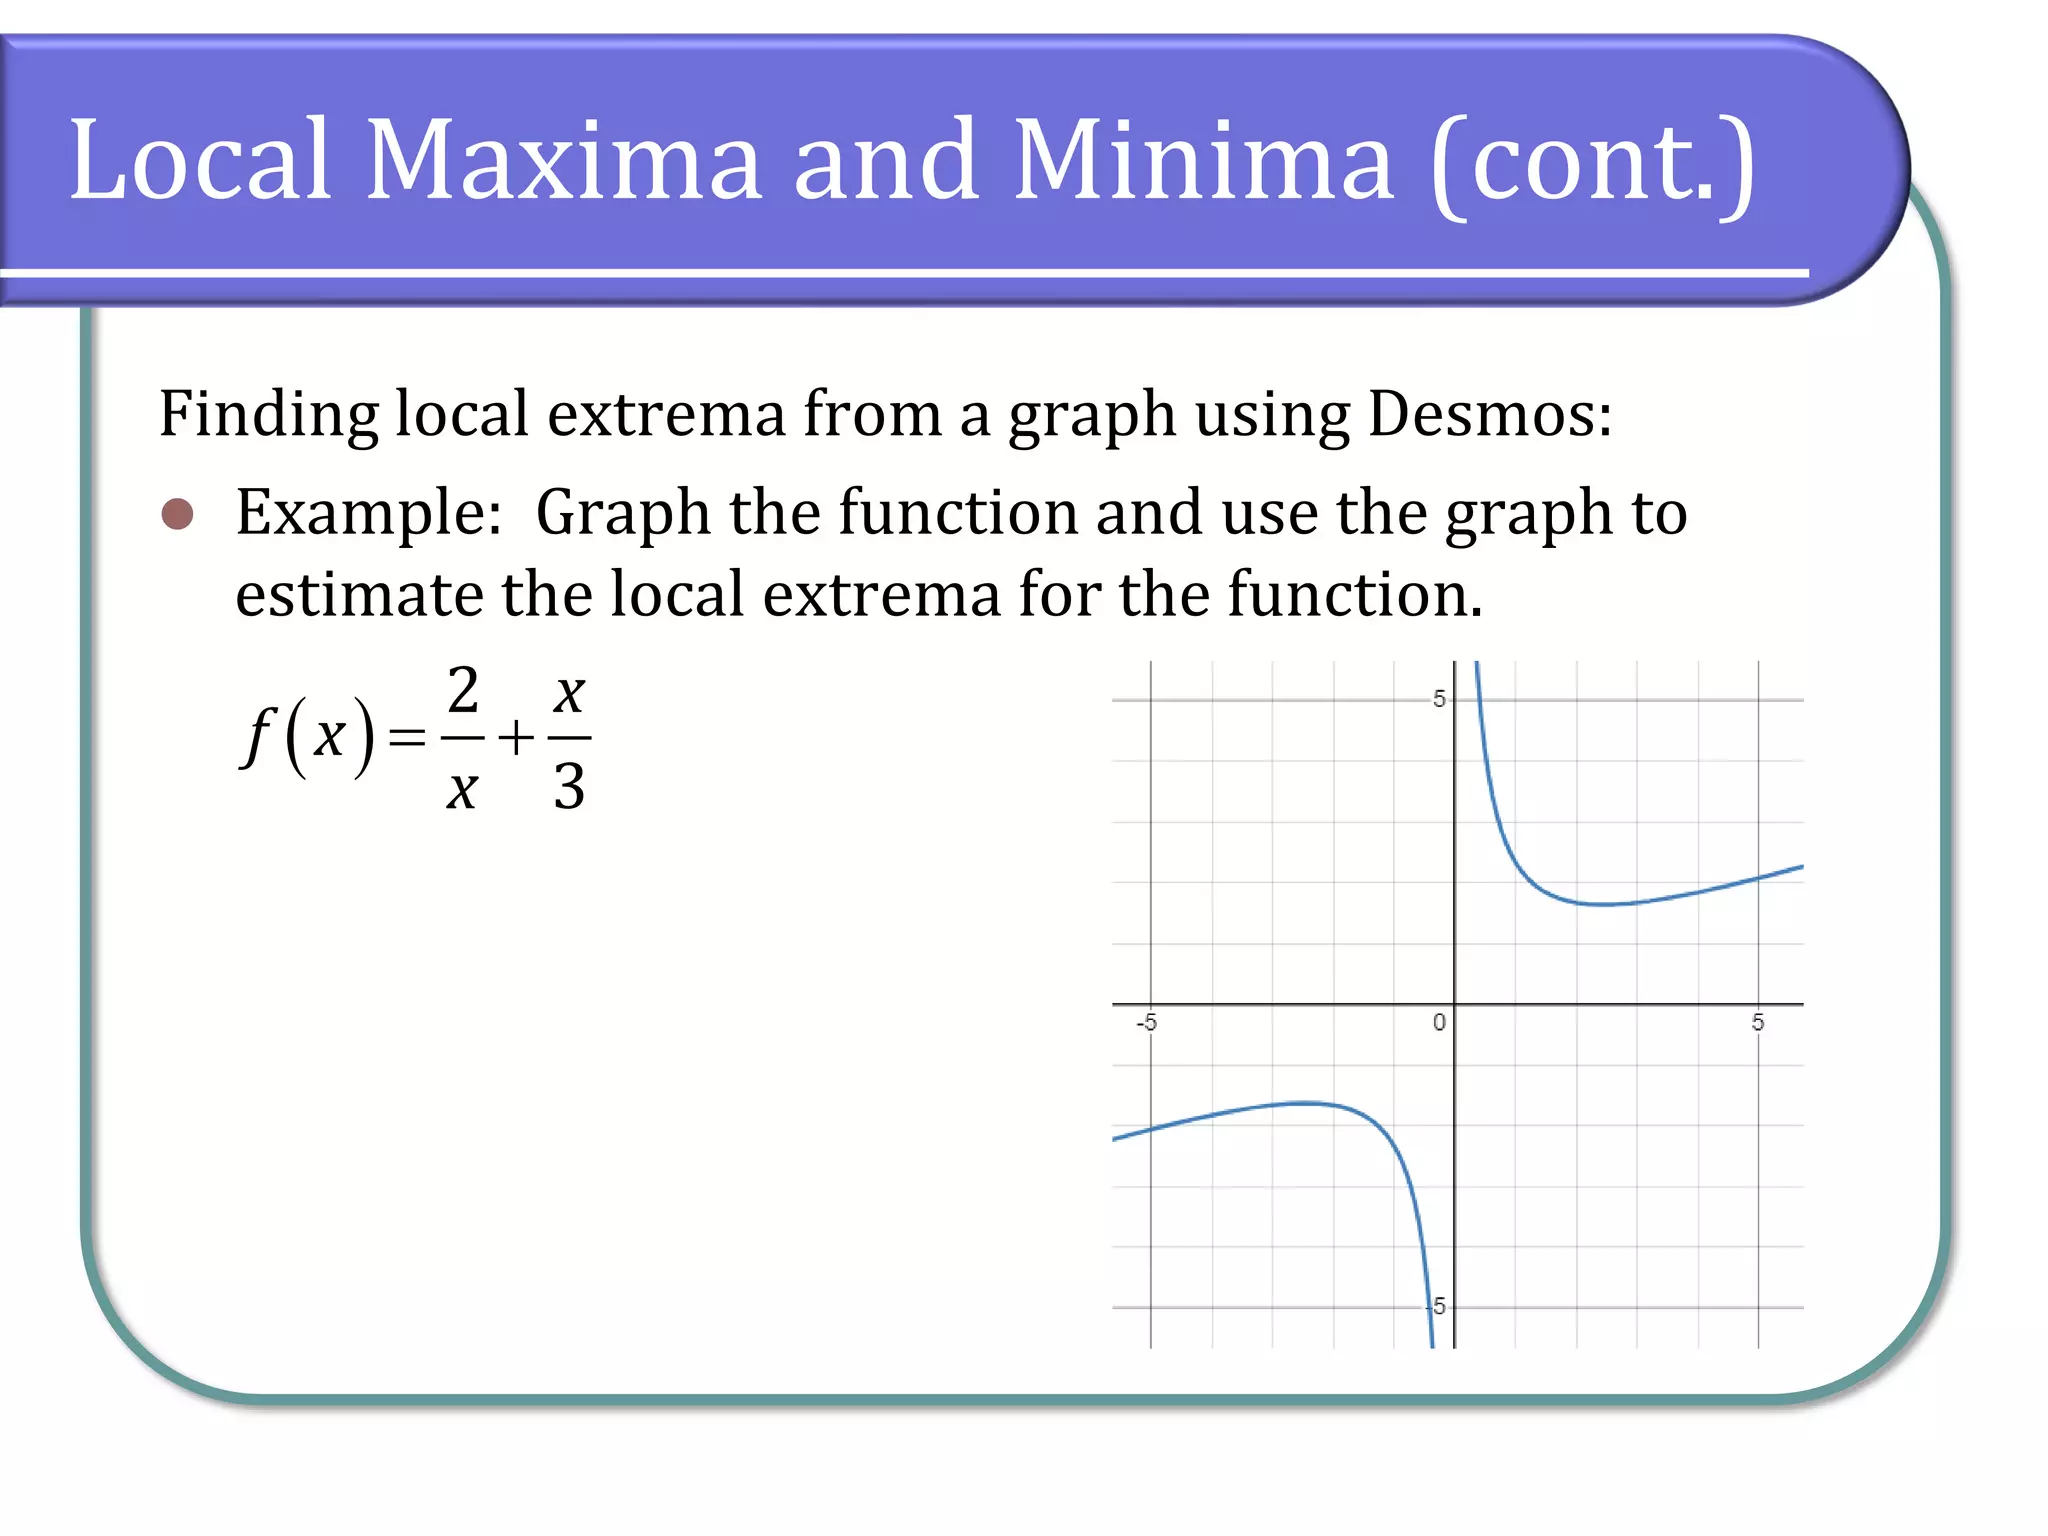
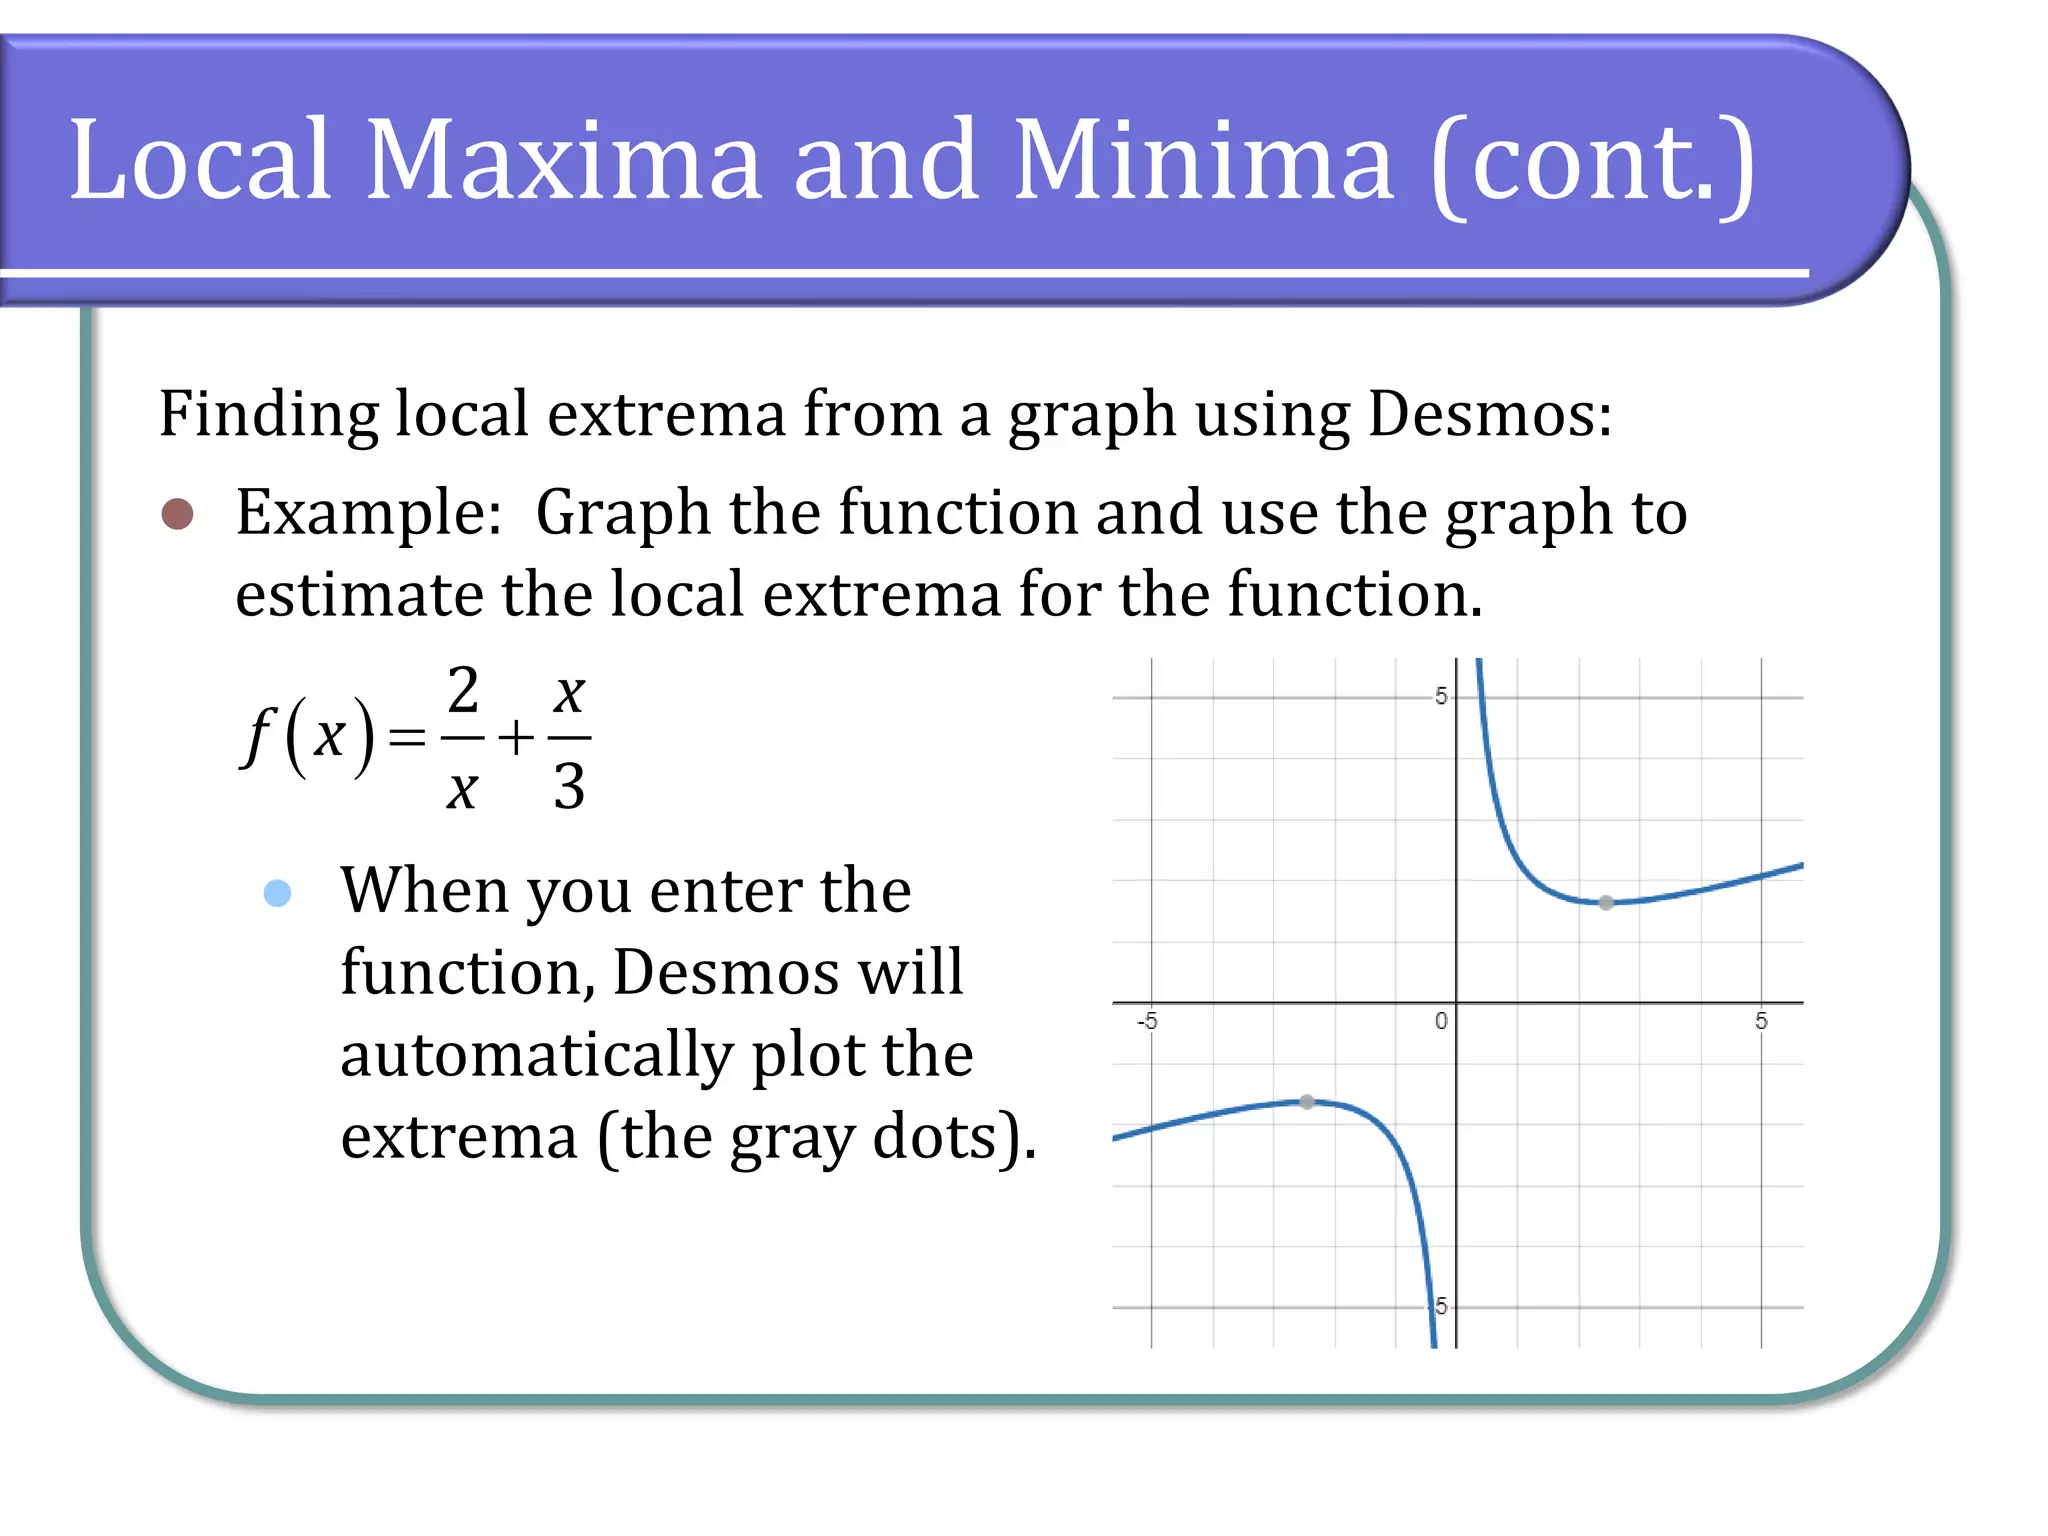
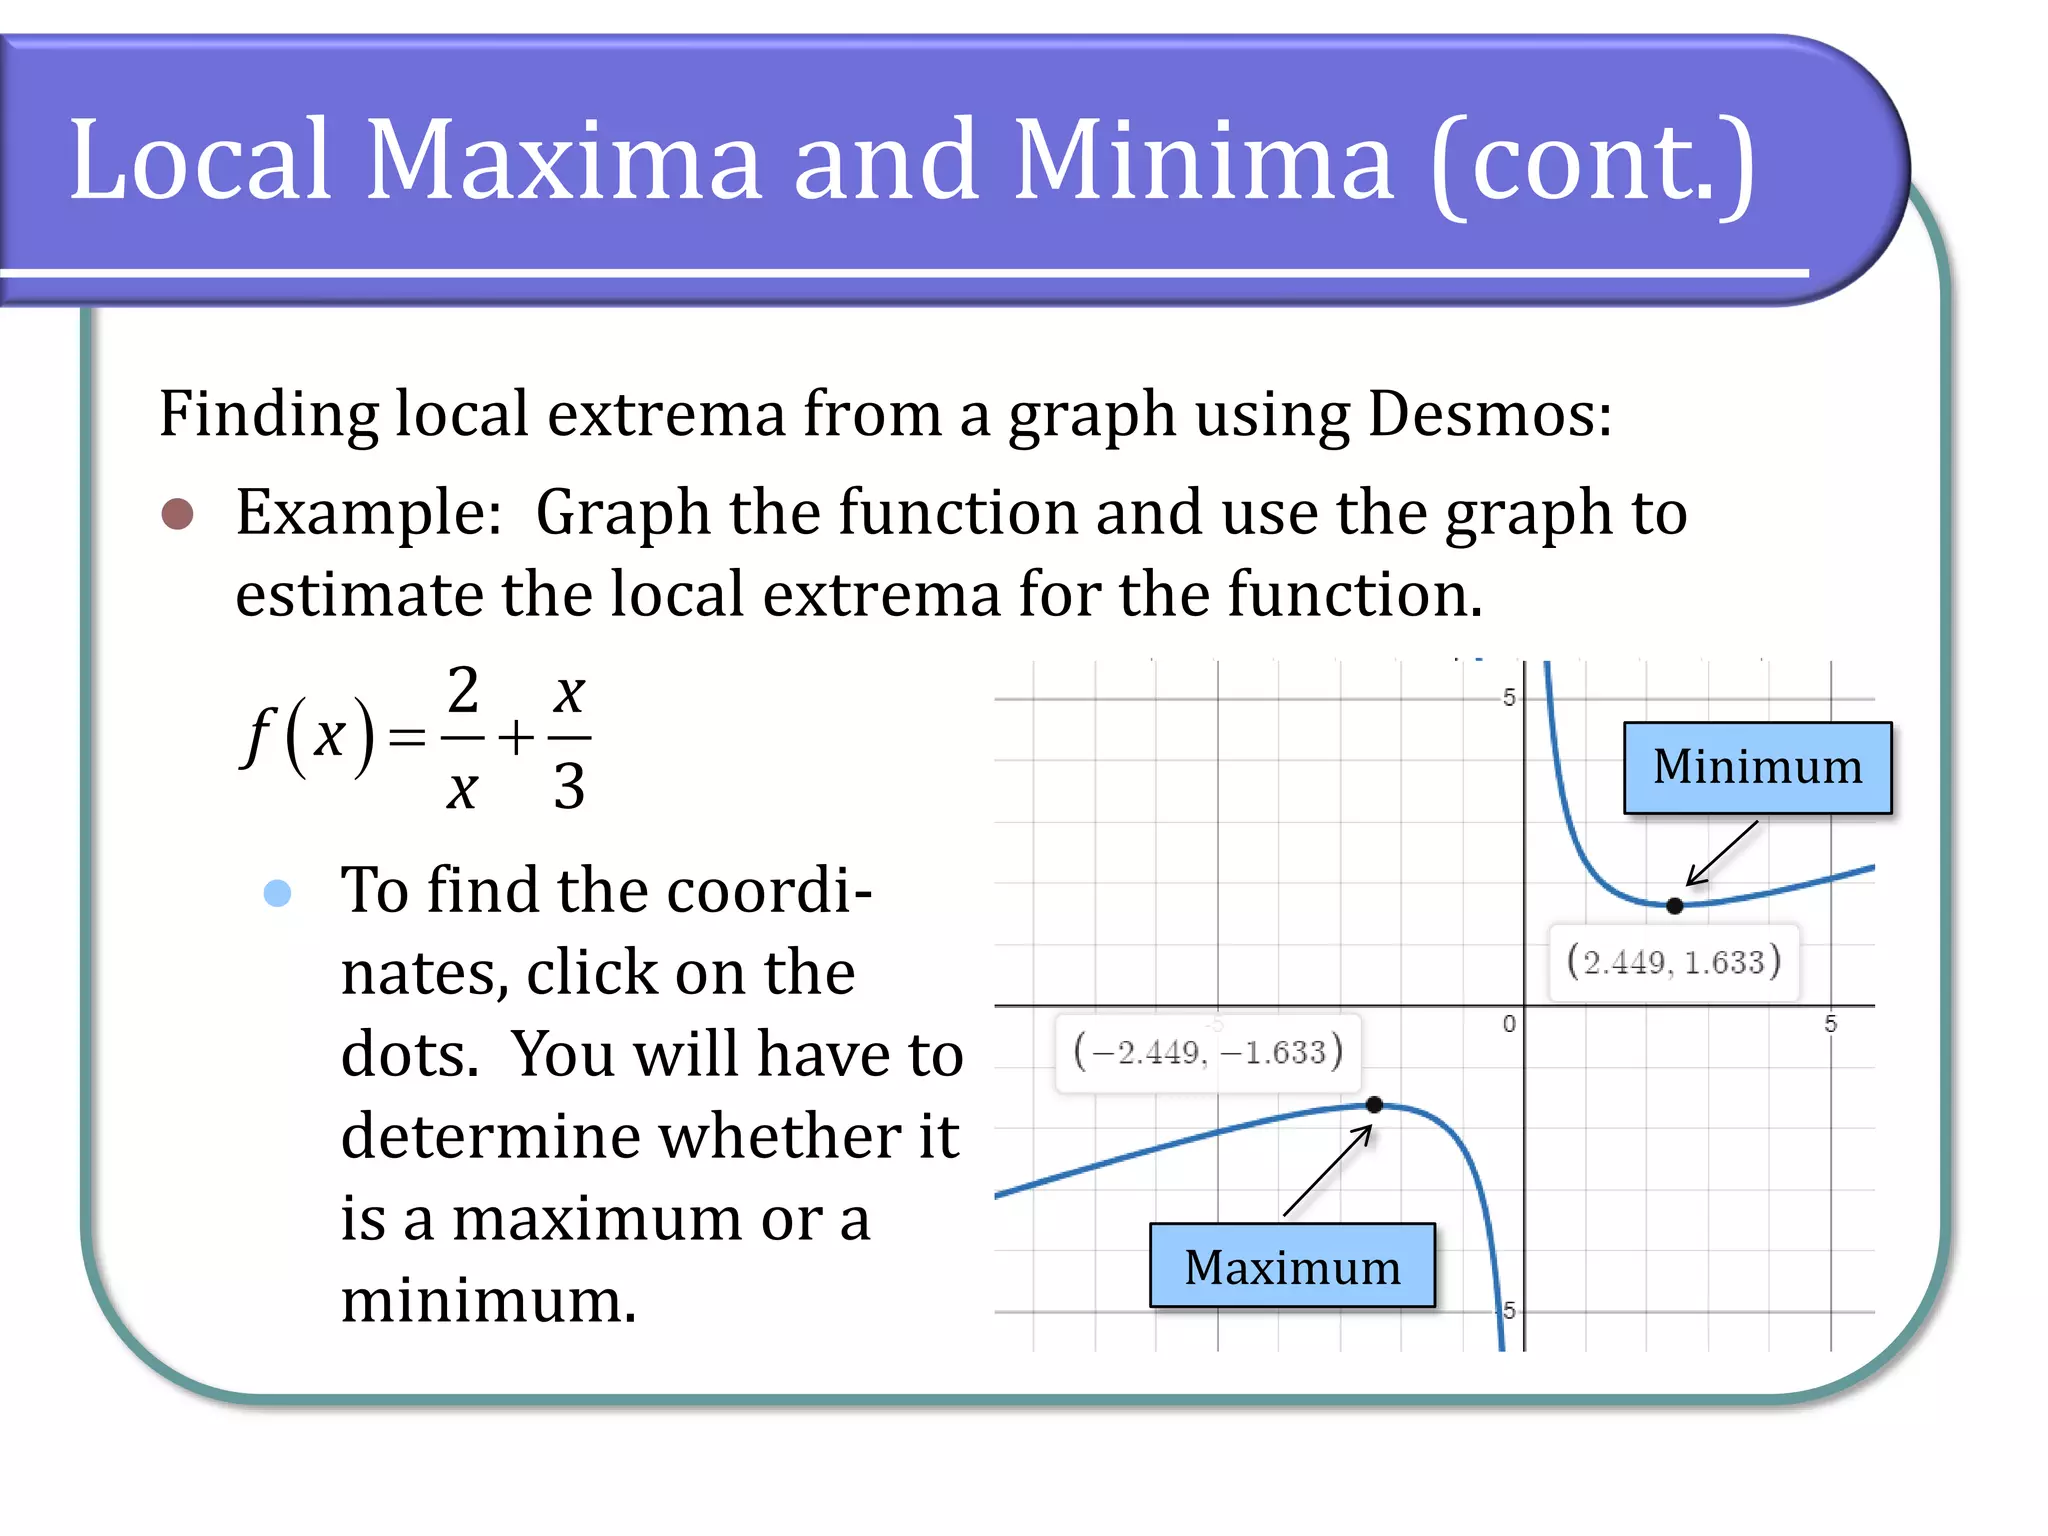
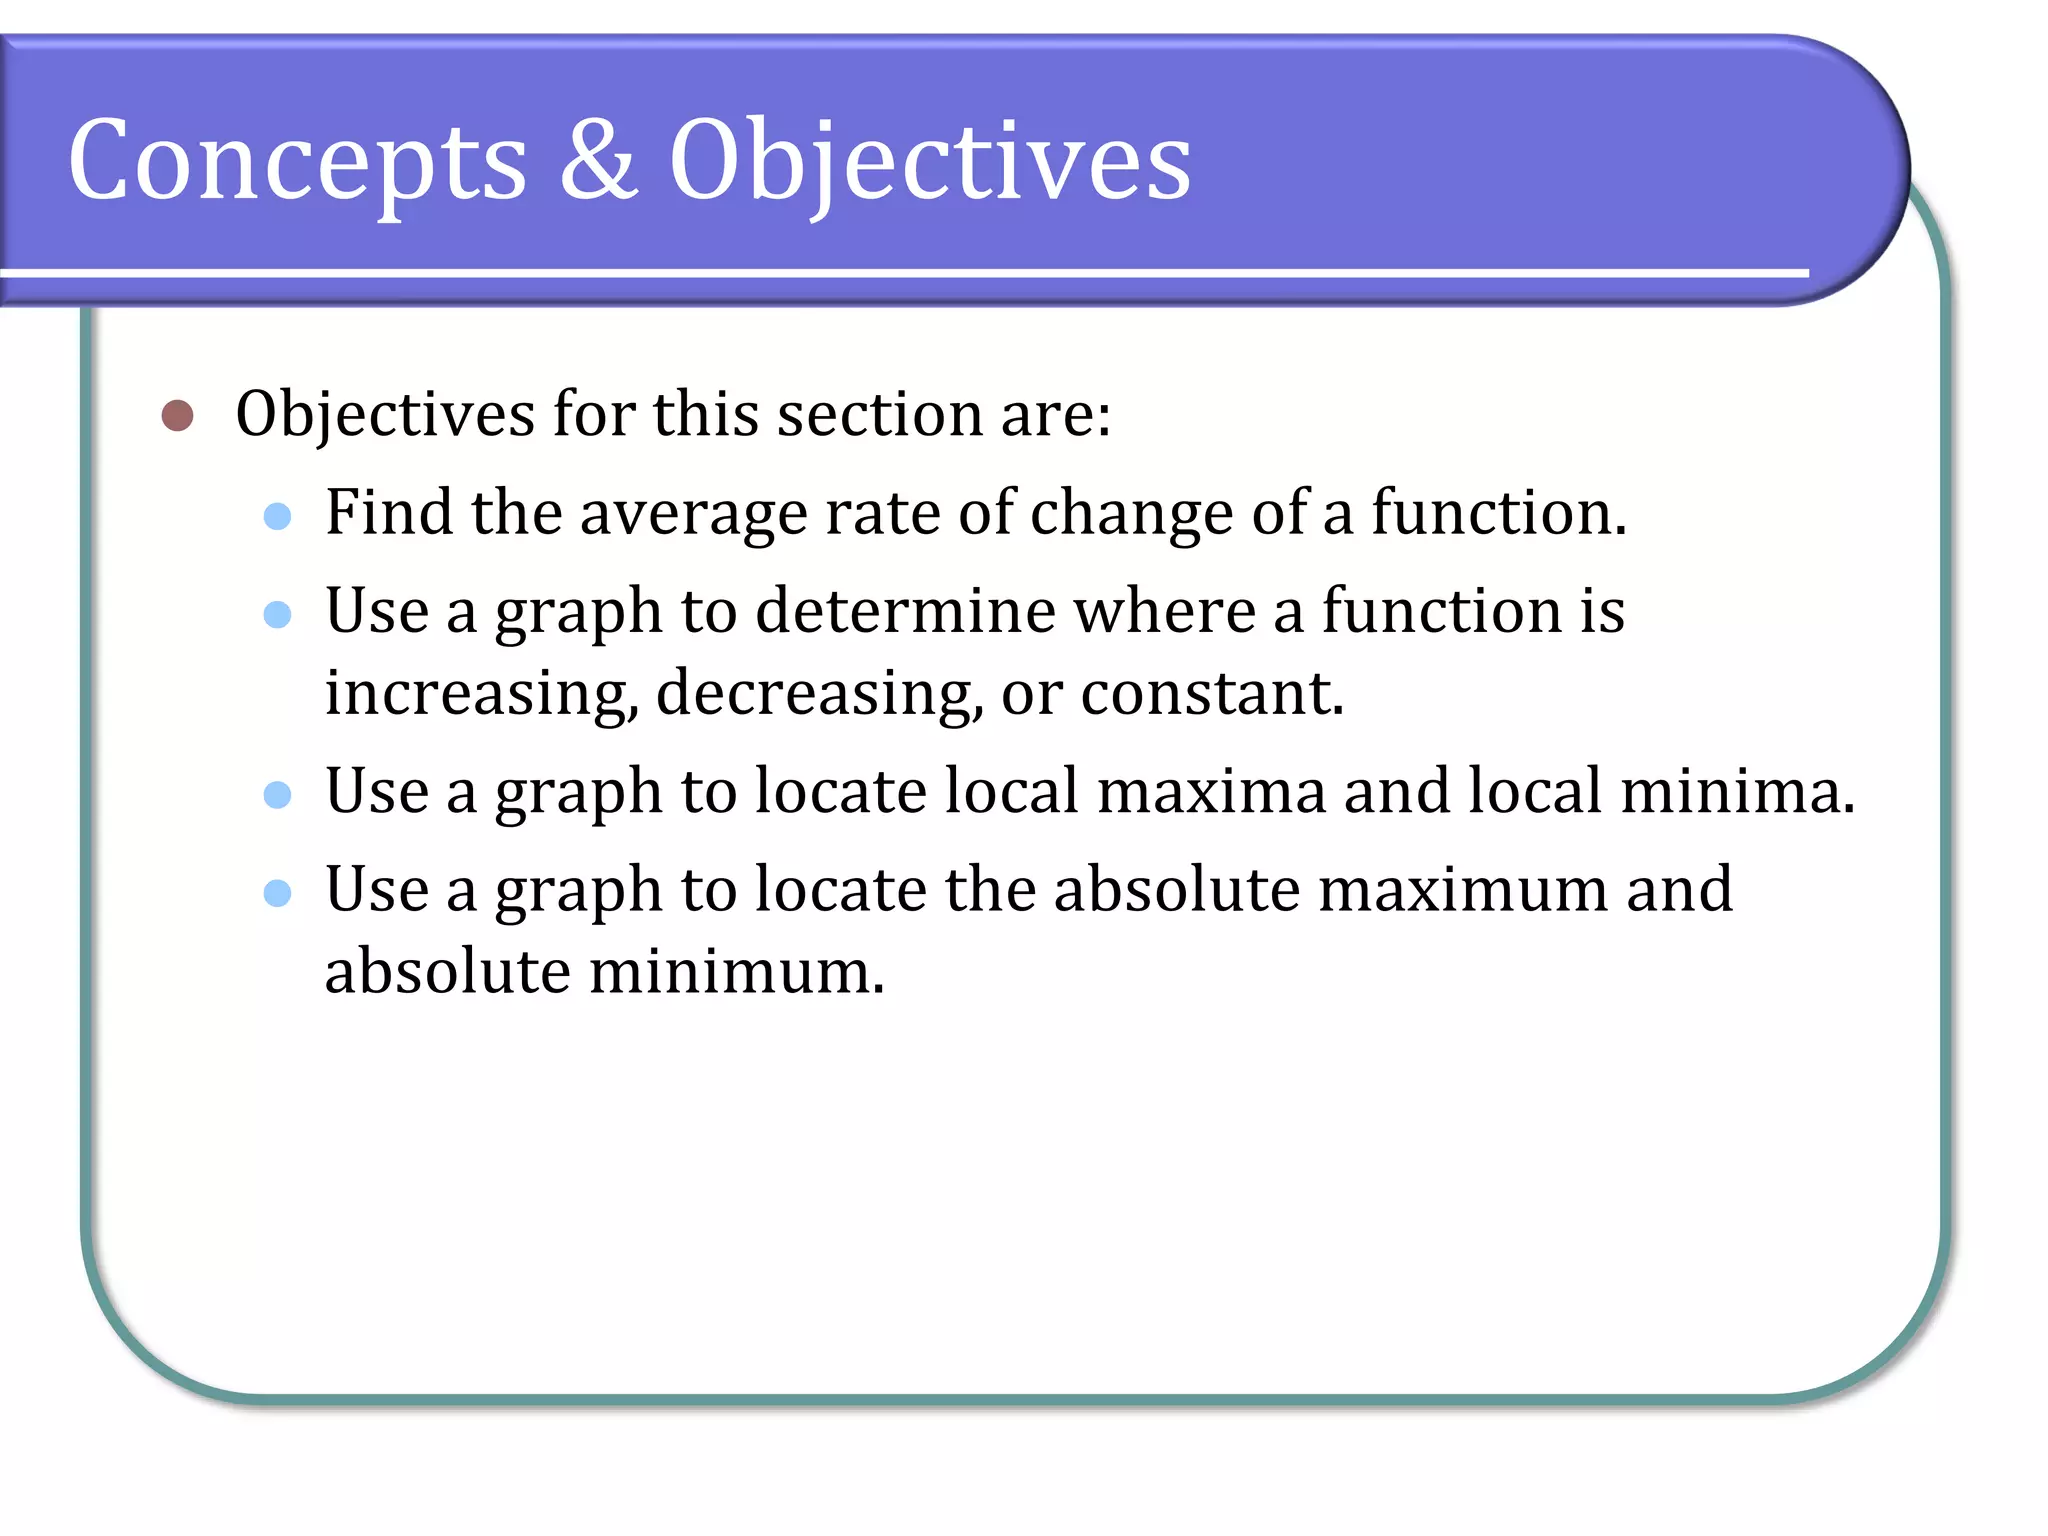
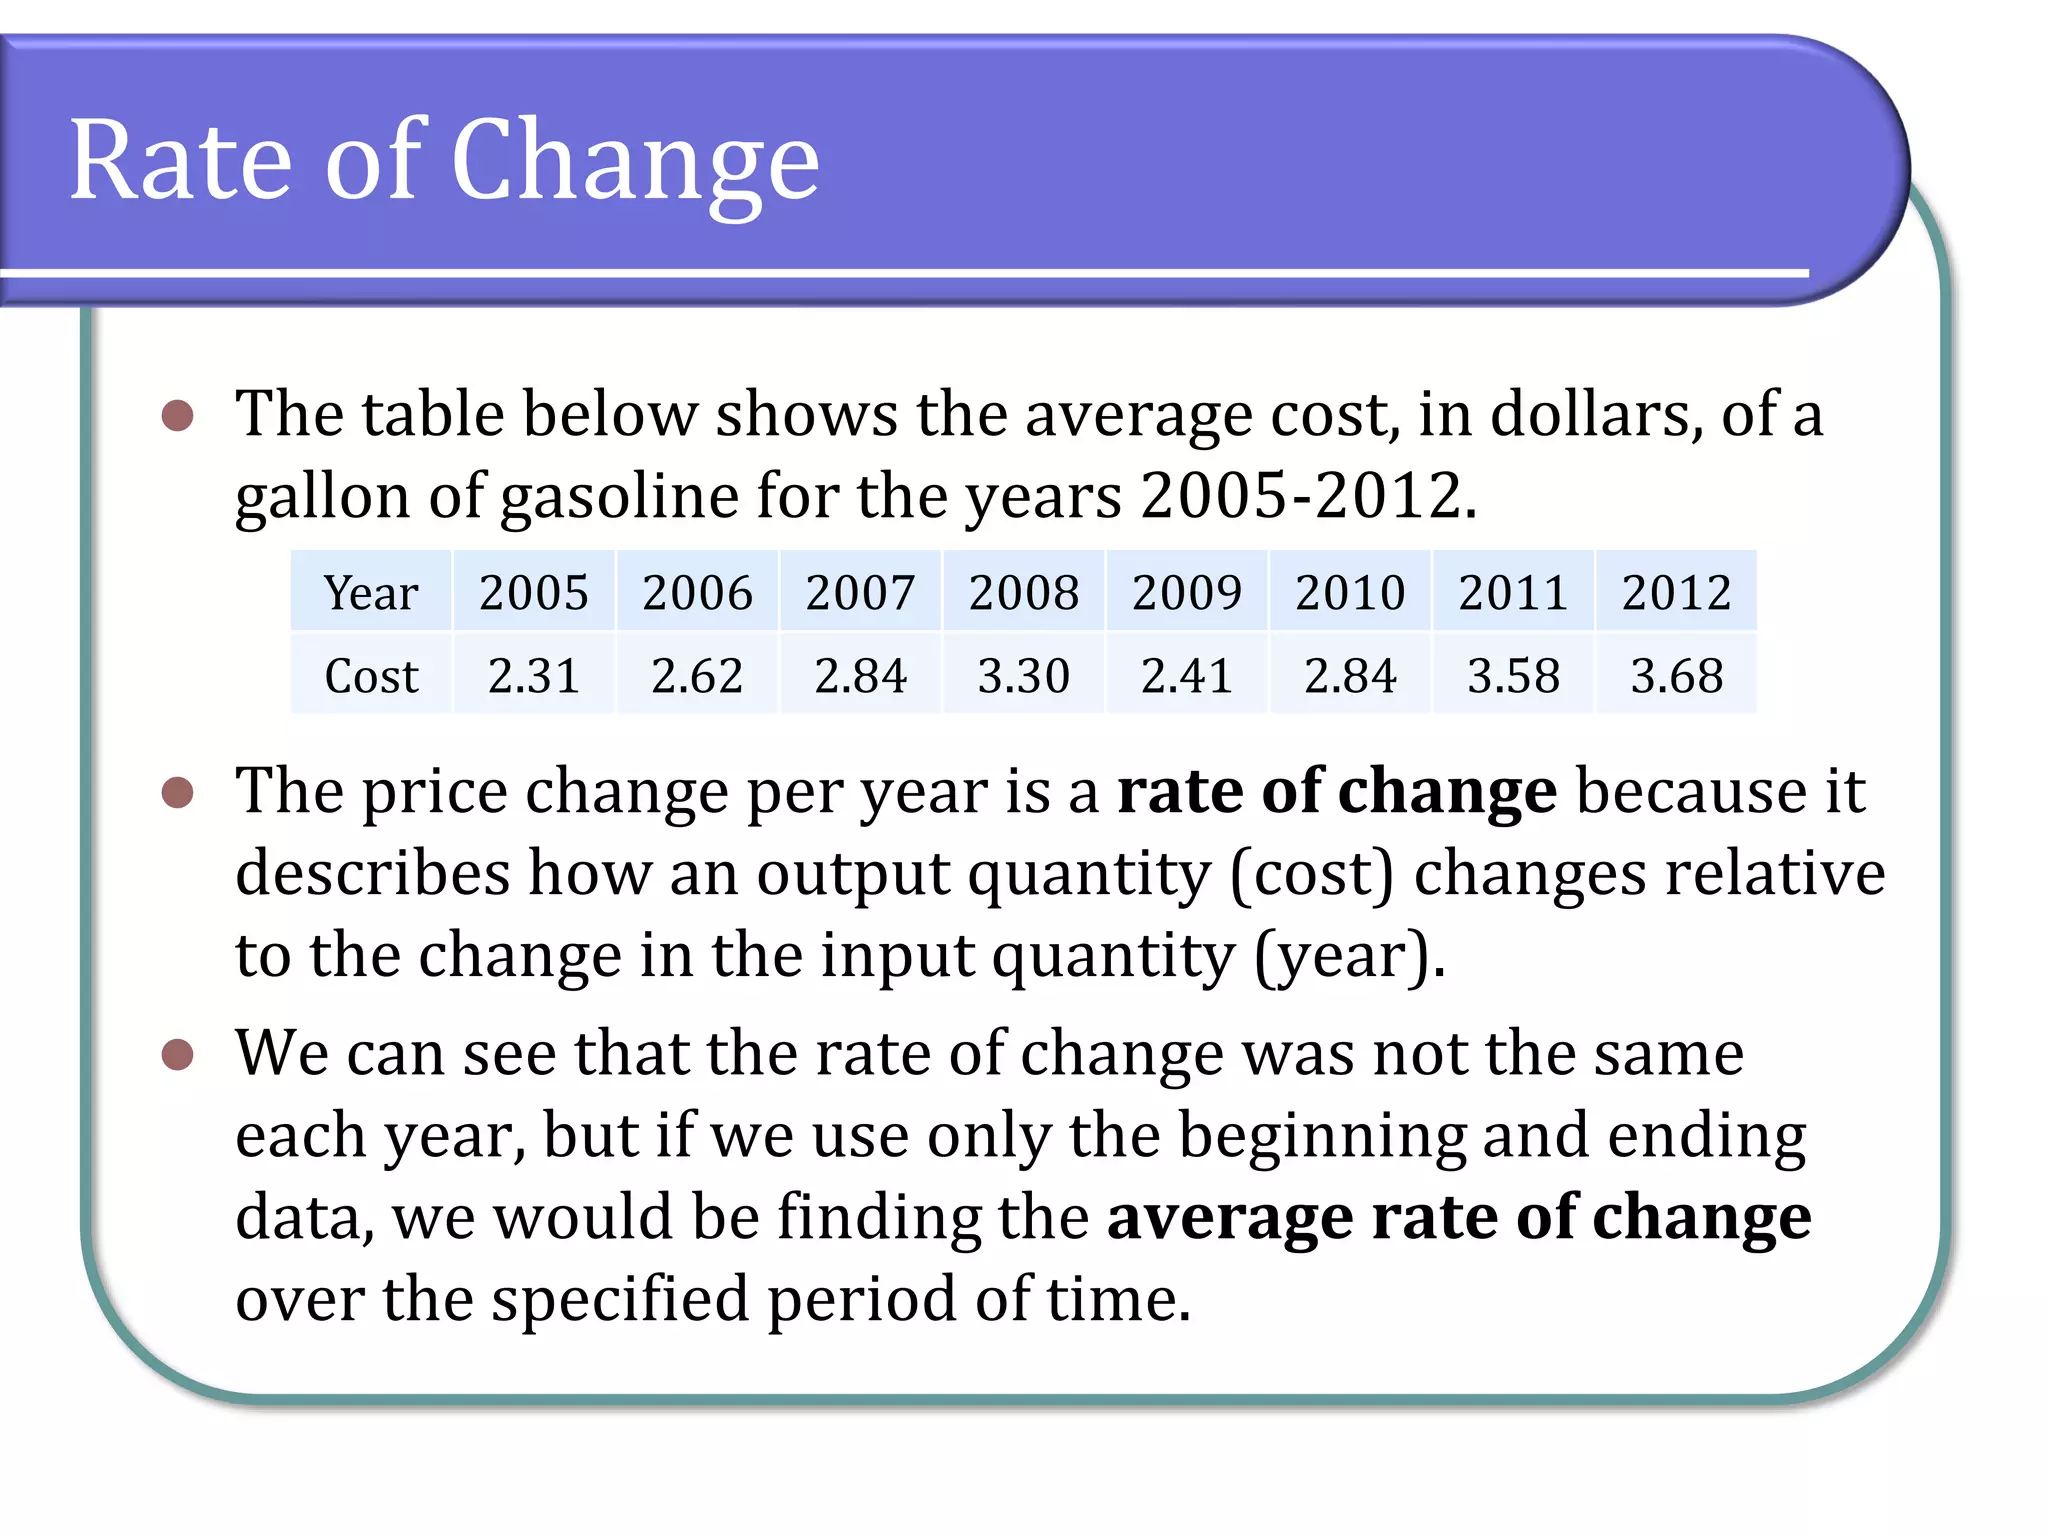
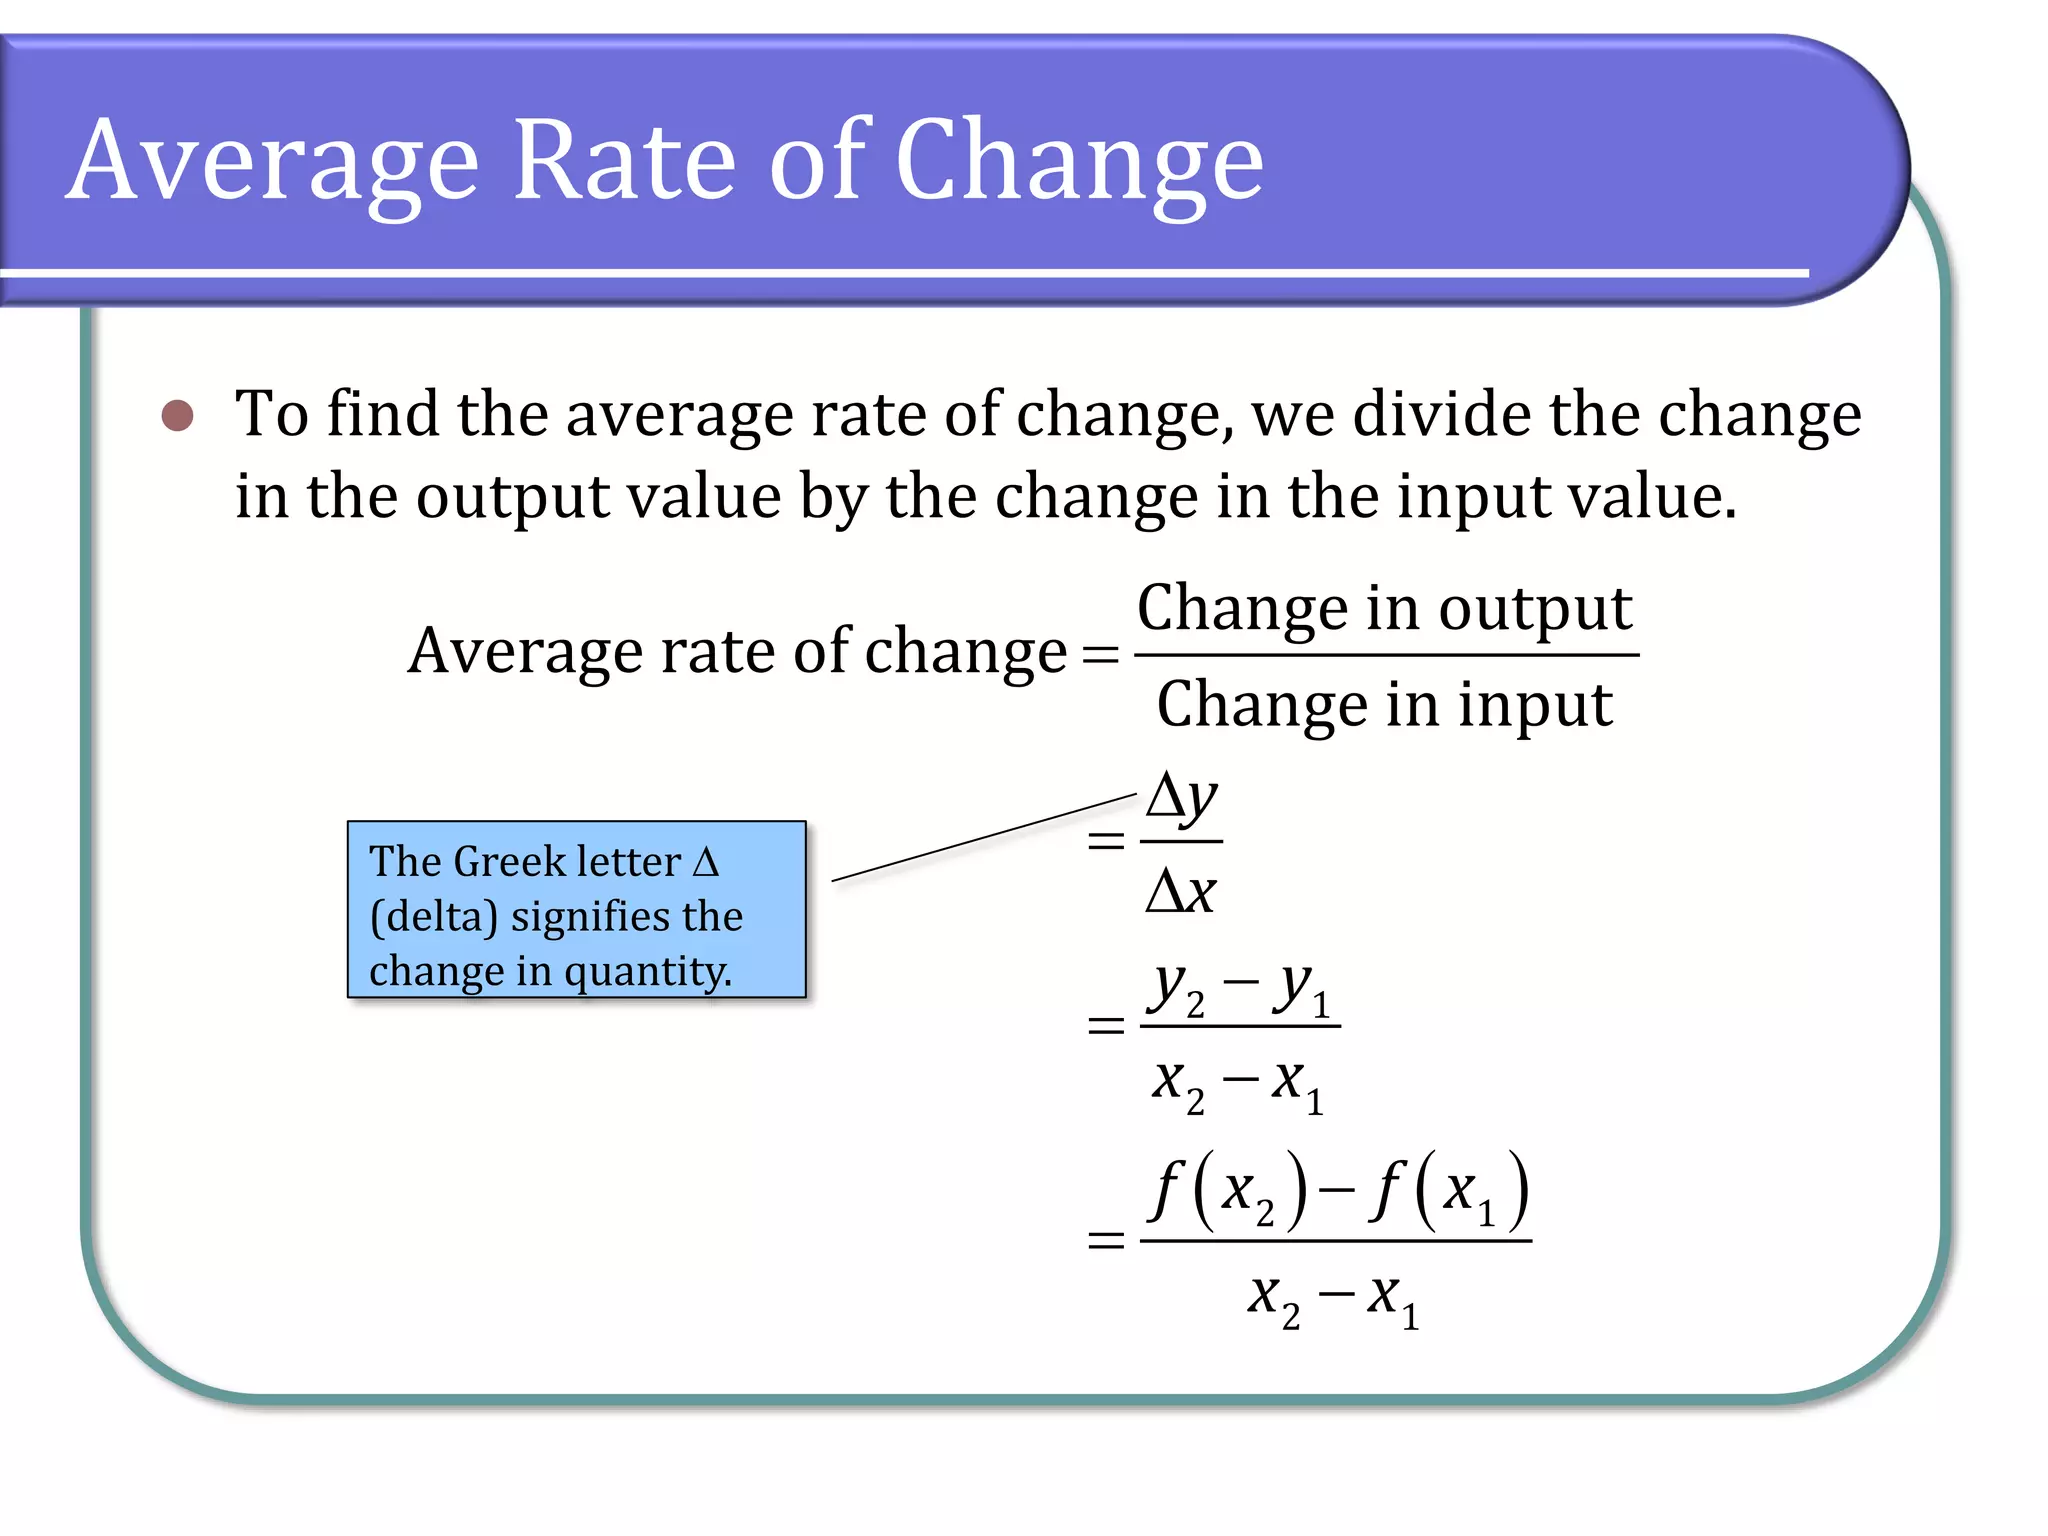
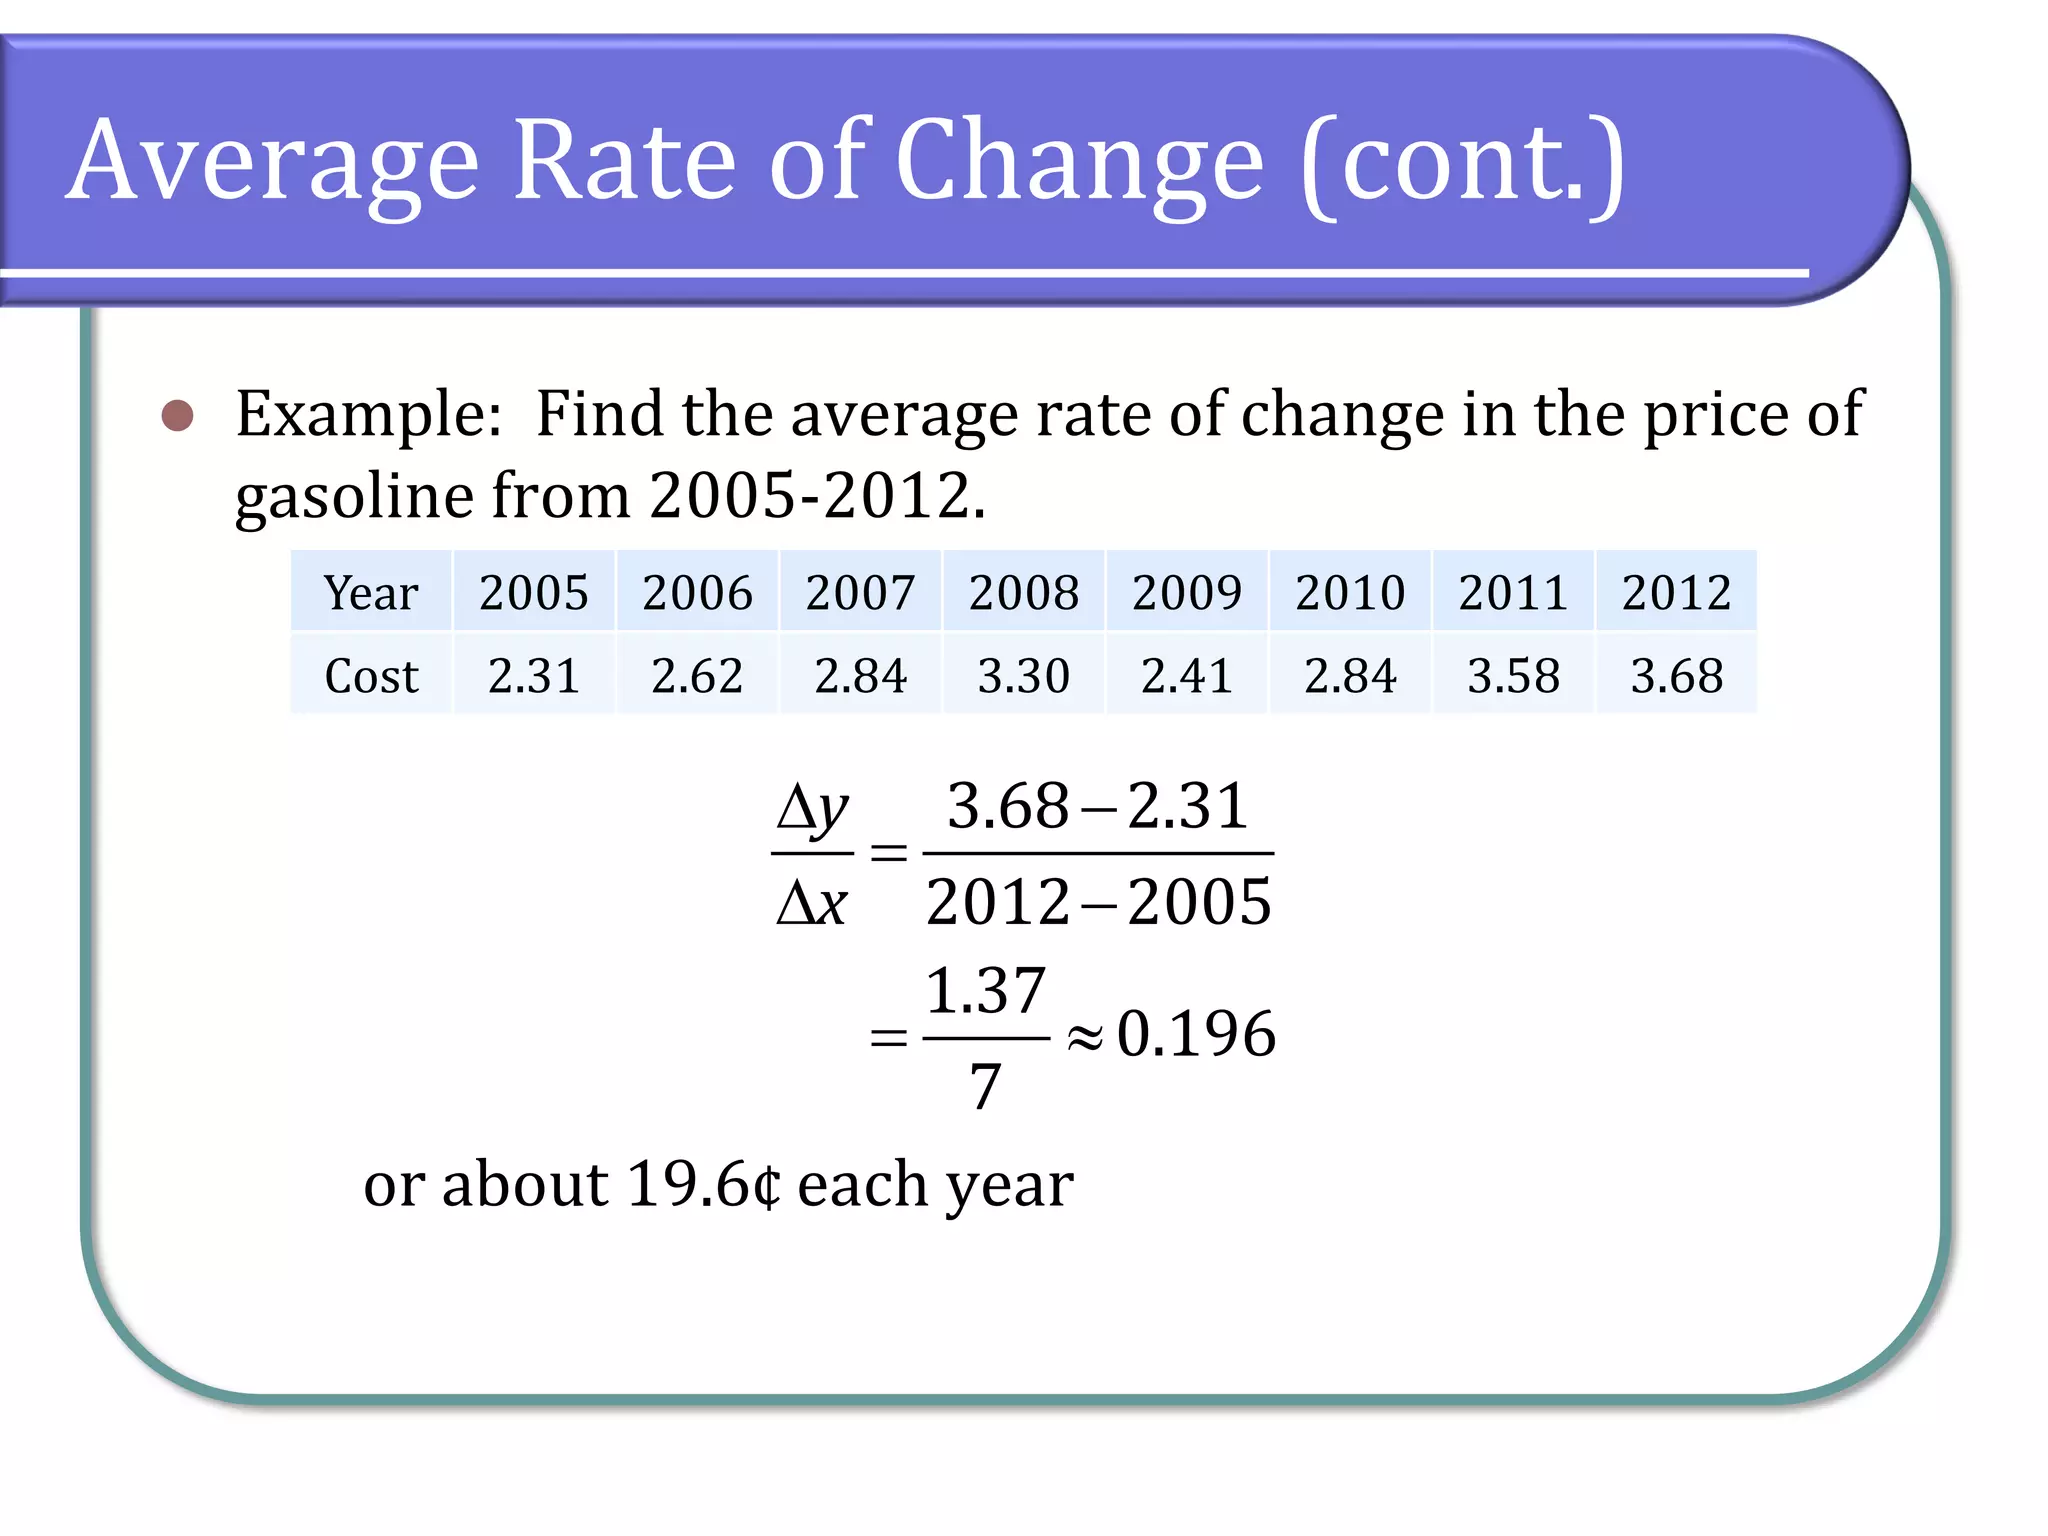
3.3 Rates of Change
Chapter 3 Functions
Concepts & Objectives
⚫ Objectives for this section are:
⚫ Find the average rate of change of a function.
⚫ Use a graph to determine where a function is
increasing, decreasing, or constant.
⚫ Use a graph to locate local maxima and local minima.
⚫ Use a graph to locate the absolute maximum and
absolute minimum.
Rate of Change
⚫ The table below shows the average cost, in dollars, of a
gallon of gasoline for the years 2005-2012.
⚫ The price change per year is a rate of change because it
describes how an output quantity (cost) changes relative
to the change in the input quantity (year).
⚫ We can see that the rate of change was not the same
each year, but if we use only the beginning and ending
data, we would be finding the average rate of change
over the specified period of time.
Year 2005 2006 2007 2008 2009 2010 2011 2012
Cost 2.31 2.62 2.84 3.30 2.41 2.84 3.58 3.68
Average Rate of Change
⚫ To find the average rate of change, we divide the change
in the output value by the change in the input value.
Change in output
Average rate of change
Change in input
=
( ) ( )
2 1
2 1
2 1
2 1
y
x
y y
x x
f x f x
x x

=

−
=
−
−
=
−
The Greek letter 
(delta) signifies the
change in quantity.
Average Rate of Change (cont.)
⚫ Example: Find the average rate of change in the price of
gasoline from 2005-2012.
or about 19.6¢ each year
Year 2005 2006 2007 2008 2009 2010 2011 2012
Cost 2.31 2.62 2.84 3.30 2.41 2.84 3.58 3.68
3.68 2.31
2012 2005
1.37
0.196
7
y
x
 −
=
 −
= 
Average Rate of Change (cont.)
From a graph:
⚫ Example: Given the function g(t), find the average rate of
change on the interval [‒1, 2].
Average Rate of Change (cont.)
From a graph:
⚫ Example: Given the function g(t), find the average rate of
change on the interval [‒1, 2].
At t = ‒1, g(t) = 4
At t = 2, g(t) = 1
Average Rate of Change (cont.)
From a graph:
⚫ Example: Given the function g(t), find the average rate of
change on the interval [‒1, 2].
At t = ‒1, g(t) = 4
At t = 2, g(t) = 1
( )
1 4 3
1
2 1 3
y
x
 − −
= = = −
 − −
Average Rate of Change (cont.)
From a function:
⚫ Example: Compute the average rate of change of the
function on the interval [2, 4].
( ) 2 1
f x x
x
= −
Average Rate of Change (cont.)
From a function:
⚫ Example: Compute the average rate of change of the
function on the interval [2, 4].
( ) 2 1
f x x
x
= −
( ) 2 1
2 2
2
1
4
2
7
2
f = −
= −
=
( ) 2 1
4 4
4
1
16
4
63
4
f = −
= −
=
Average Rate of Change (cont.)
From a function:
⚫ Example: Compute the average rate of change of the
function on the interval [2, 4].
( ) 2 1
f x x
x
= −
( ) 2 1
2 2
2
1
4
2
7
2
f = −
= −
=
( ) 2 1
4 4
4
1
16
4
63
4
f = −
= −
=
( ) ( )
4 2
4 2
63 14
4 4
2
49
8
f f
y
x
−

=
 −
−
=
=
Increasing, Decreasing, or Constant
⚫ We say that a function is increasing on an interval if the
function values increase as the input values increase
within that interval.
⚫ The average rate of change of an increasing function
is positive.
⚫ Similarly, a function is decreasing on an interval if the
function values decrease as the input values increase
over that interval.
⚫ The average rate of change of a decreasing function is
negative.
Increasing, Decreasing, or Constant
⚫ This is a graph of ( ) 3
12
f x x x
= −
Increasing
Increasing
Decreasing
Increasing, Decreasing, or Constant
⚫ This is a graph of
⚫ It is increasing on
⚫ It is decreasing on (‒2, 2)
( ) 3
12
f x x x
= −
Increasing
Increasing
Decreasing
( ) ( )
, 2 2,
− − 
Local Maxima and Minima
⚫ A value of the input where a function changes from
increasing to decreasing (as the input variable
increases) is the location of a local maximum.
⚫ If a function has more than one, we say it has local
maxima.
⚫ Similarly, a value of the input where a function changes
from decreasing to increasing as the input variable
increases is the location of a local minimum (plural
minima).
⚫ Together, local maxima and minima are called local
extrema.
Local Maxima and Minima (cont.)
⚫ The local maximum is 16,
which occurs at x = ‒2.
⚫ The local minimum is ‒16,
which occurs at x = 2.
⚫ The extrema give us the
intervals over which the
function is increasing or
decreasing.
Increasing
Increasing
Decreasing
Local Maxima and Minima (cont.)
Finding local extrema from a graph using Desmos:
⚫ Example: Graph the function and use the graph to
estimate the local extrema for the function.
( )
2
3
x
f x
x
= +
Local Maxima and Minima (cont.)
Finding local extrema from a graph using Desmos:
⚫ Example: Graph the function and use the graph to
estimate the local extrema for the function.
⚫
( )
2
3
x
f x
x
= +
When you enter the
function, Desmos will
automatically plot the
extrema (the gray dots).
Local Maxima and Minima (cont.)
Finding local extrema from a graph using Desmos:
⚫ Example: Graph the function and use the graph to
estimate the local extrema for the function.
⚫
( )
2
3
x
f x
x
= +
To find the coordi-
nates, click on the
dots. You will have to
determine whether it
is a maximum or a
minimum.
Minimum
Maximum
Absolute Maxima and Minima
⚫ There is a difference between locating the highest and
lowest points on a graph in a region around an open
interval (locally) and locating the highest and lowest
points on the graph for the entire domain.
⚫ The y-coordinates (output) at the highest and lowest
points are called the absolute maximum and absolute
minimum, respectively.
⚫ Not every graph has an absolute maximum or minimum
value.
Classwork
⚫ College Algebra 2e
⚫ 3.3: 6-14 (even); 3.2: 28-36 (even); 3.1: 60-86 (even)
⚫ 3.3 Classwork Check
⚫ Quiz 3.2

3.3 Rates of Change and Behavior of Graphs

  • 1.
    3.3 Rates ofChange Chapter 3 Functions
  • 2.
    Concepts & Objectives ⚫Objectives for this section are: ⚫ Find the average rate of change of a function. ⚫ Use a graph to determine where a function is increasing, decreasing, or constant. ⚫ Use a graph to locate local maxima and local minima. ⚫ Use a graph to locate the absolute maximum and absolute minimum.
  • 3.
    Rate of Change ⚫The table below shows the average cost, in dollars, of a gallon of gasoline for the years 2005-2012. ⚫ The price change per year is a rate of change because it describes how an output quantity (cost) changes relative to the change in the input quantity (year). ⚫ We can see that the rate of change was not the same each year, but if we use only the beginning and ending data, we would be finding the average rate of change over the specified period of time. Year 2005 2006 2007 2008 2009 2010 2011 2012 Cost 2.31 2.62 2.84 3.30 2.41 2.84 3.58 3.68
  • 4.
    Average Rate ofChange ⚫ To find the average rate of change, we divide the change in the output value by the change in the input value. Change in output Average rate of change Change in input = ( ) ( ) 2 1 2 1 2 1 2 1 y x y y x x f x f x x x  =  − = − − = − The Greek letter  (delta) signifies the change in quantity.
  • 5.
    Average Rate ofChange (cont.) ⚫ Example: Find the average rate of change in the price of gasoline from 2005-2012. or about 19.6¢ each year Year 2005 2006 2007 2008 2009 2010 2011 2012 Cost 2.31 2.62 2.84 3.30 2.41 2.84 3.58 3.68 3.68 2.31 2012 2005 1.37 0.196 7 y x  − =  − = 
  • 6.
    Average Rate ofChange (cont.) From a graph: ⚫ Example: Given the function g(t), find the average rate of change on the interval [‒1, 2].
  • 7.
    Average Rate ofChange (cont.) From a graph: ⚫ Example: Given the function g(t), find the average rate of change on the interval [‒1, 2]. At t = ‒1, g(t) = 4 At t = 2, g(t) = 1
  • 8.
    Average Rate ofChange (cont.) From a graph: ⚫ Example: Given the function g(t), find the average rate of change on the interval [‒1, 2]. At t = ‒1, g(t) = 4 At t = 2, g(t) = 1 ( ) 1 4 3 1 2 1 3 y x  − − = = = −  − −
  • 9.
    Average Rate ofChange (cont.) From a function: ⚫ Example: Compute the average rate of change of the function on the interval [2, 4]. ( ) 2 1 f x x x = −
  • 10.
    Average Rate ofChange (cont.) From a function: ⚫ Example: Compute the average rate of change of the function on the interval [2, 4]. ( ) 2 1 f x x x = − ( ) 2 1 2 2 2 1 4 2 7 2 f = − = − = ( ) 2 1 4 4 4 1 16 4 63 4 f = − = − =
  • 11.
    Average Rate ofChange (cont.) From a function: ⚫ Example: Compute the average rate of change of the function on the interval [2, 4]. ( ) 2 1 f x x x = − ( ) 2 1 2 2 2 1 4 2 7 2 f = − = − = ( ) 2 1 4 4 4 1 16 4 63 4 f = − = − = ( ) ( ) 4 2 4 2 63 14 4 4 2 49 8 f f y x −  =  − − = =
  • 12.
    Increasing, Decreasing, orConstant ⚫ We say that a function is increasing on an interval if the function values increase as the input values increase within that interval. ⚫ The average rate of change of an increasing function is positive. ⚫ Similarly, a function is decreasing on an interval if the function values decrease as the input values increase over that interval. ⚫ The average rate of change of a decreasing function is negative.
  • 13.
    Increasing, Decreasing, orConstant ⚫ This is a graph of ( ) 3 12 f x x x = − Increasing Increasing Decreasing
  • 14.
    Increasing, Decreasing, orConstant ⚫ This is a graph of ⚫ It is increasing on ⚫ It is decreasing on (‒2, 2) ( ) 3 12 f x x x = − Increasing Increasing Decreasing ( ) ( ) , 2 2, − − 
  • 15.
    Local Maxima andMinima ⚫ A value of the input where a function changes from increasing to decreasing (as the input variable increases) is the location of a local maximum. ⚫ If a function has more than one, we say it has local maxima. ⚫ Similarly, a value of the input where a function changes from decreasing to increasing as the input variable increases is the location of a local minimum (plural minima). ⚫ Together, local maxima and minima are called local extrema.
  • 16.
    Local Maxima andMinima (cont.) ⚫ The local maximum is 16, which occurs at x = ‒2. ⚫ The local minimum is ‒16, which occurs at x = 2. ⚫ The extrema give us the intervals over which the function is increasing or decreasing. Increasing Increasing Decreasing
  • 17.
    Local Maxima andMinima (cont.) Finding local extrema from a graph using Desmos: ⚫ Example: Graph the function and use the graph to estimate the local extrema for the function. ( ) 2 3 x f x x = +
  • 18.
    Local Maxima andMinima (cont.) Finding local extrema from a graph using Desmos: ⚫ Example: Graph the function and use the graph to estimate the local extrema for the function. ⚫ ( ) 2 3 x f x x = + When you enter the function, Desmos will automatically plot the extrema (the gray dots).
  • 19.
    Local Maxima andMinima (cont.) Finding local extrema from a graph using Desmos: ⚫ Example: Graph the function and use the graph to estimate the local extrema for the function. ⚫ ( ) 2 3 x f x x = + To find the coordi- nates, click on the dots. You will have to determine whether it is a maximum or a minimum. Minimum Maximum
  • 20.
    Absolute Maxima andMinima ⚫ There is a difference between locating the highest and lowest points on a graph in a region around an open interval (locally) and locating the highest and lowest points on the graph for the entire domain. ⚫ The y-coordinates (output) at the highest and lowest points are called the absolute maximum and absolute minimum, respectively. ⚫ Not every graph has an absolute maximum or minimum value.
  • 21.
    Classwork ⚫ College Algebra2e ⚫ 3.3: 6-14 (even); 3.2: 28-36 (even); 3.1: 60-86 (even) ⚫ 3.3 Classwork Check ⚫ Quiz 3.2