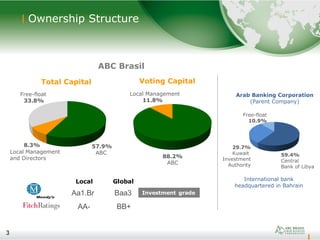
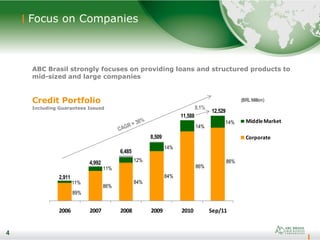
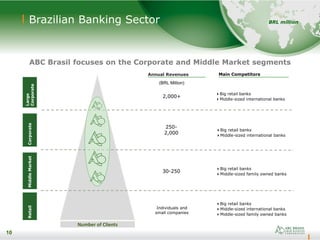
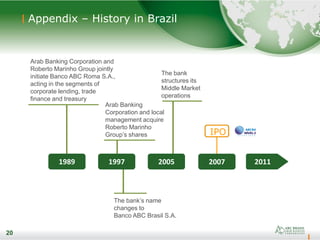
1) ABC Brasil is a subsidiary of Arab Banking Corporation focused on providing loans and structured products to mid-sized and large companies in Brazil. It has a presence in 23 cities across multiple business segments.
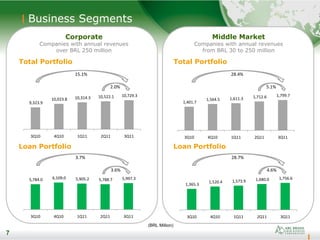
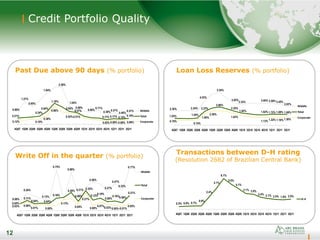
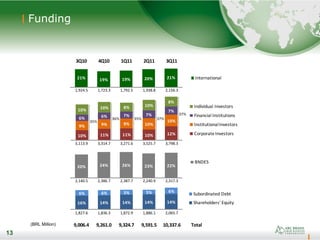
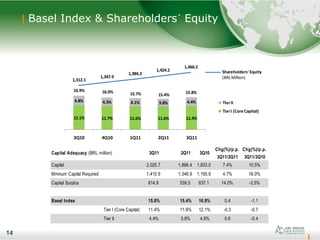
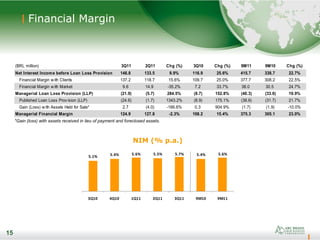
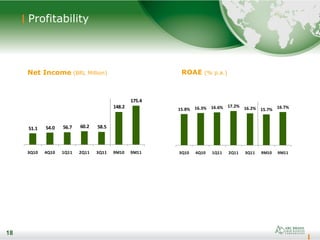
2) Financially, ABC Brasil has seen growth in its loan portfolio and net interest income. Credit quality remains strong with low past due rates. The bank maintains adequate capital and liquidity levels above regulatory minimums.
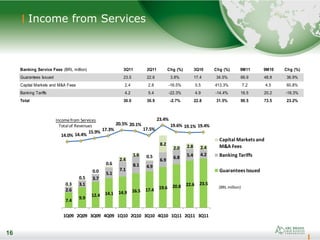
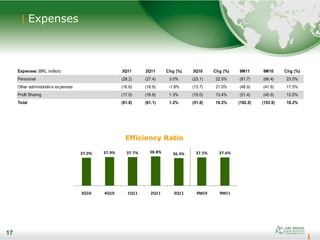
3) Income from fees, particularly guarantees issued, has increased significantly year-over-year as ABC Brasil's business volumes have expanded. Expenses are well-controlled, keeping efficiency ratios stable.