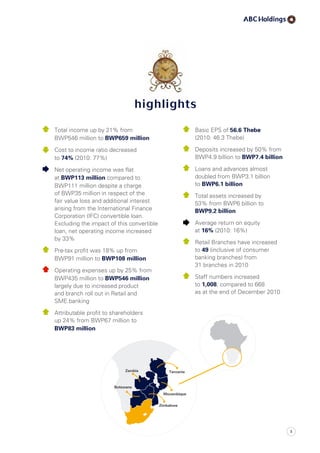
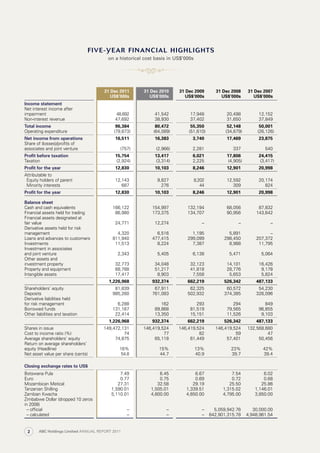
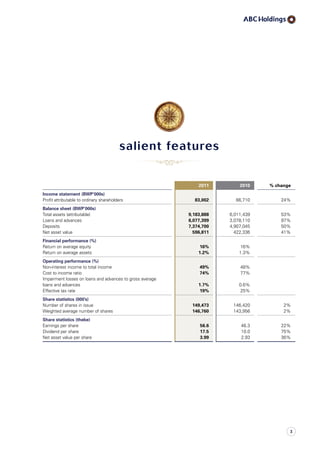
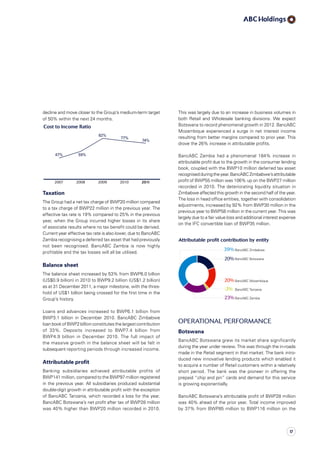
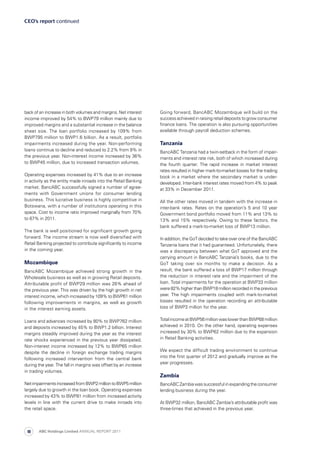
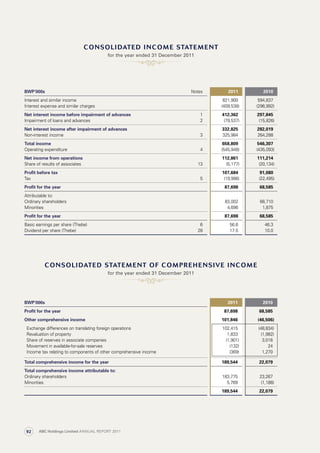
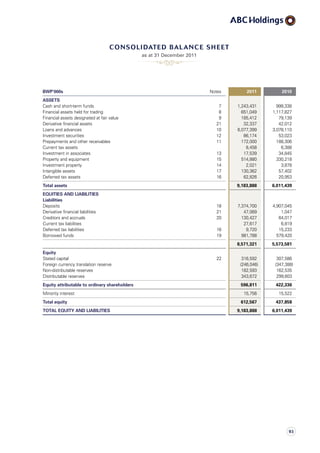
ABC Holdings Limited
	Annual Report
2011
	ABC Holdings Limited
Annual Report
ABC Holdings Limited is the parent
company of a number of banks operating
under the BancABC brand in Sub-Saharan
Africa, with operations in Botswana,
Mozambique, Tanzania, Zambia and
Zimbabwe. A group services office is
located in South Africa.
Our vision is to be Africa’s preferred
banking partner by offering world-class
financial solutions. We will realise this
by building profitable, lifelong customer
relationships through the provision
of a wide range of innovative financial
products and services – to the benefit
of all our stakeholders. The Group offers
a diverse range of services including
but not limited to the following: corporate
banking, treasury services, Retail 
SME Banking, asset management and
stock broking.
ABC Holdings Limited is registered in
Botswana. Its primary listing is on the
Botswana Stock Exchange, with a
secondary listing on the Zimbabwe
Stock Exchange.
ABOUT BancABC
CONTENTS
	ifc	 Our values
	 1	 Highlights
	 2	 Five-year financial highlights
	 3	 Salient features
	 4	 Chairman’s report
	10	 Chief Executive Officer’s report	
	24	Corporate social responsibility report
	28	 Risk and governance report
	39	Directors and Group management
	43	 Directors’ responsibility
	44	 Directors’ report
	47 	 Annual financial statements
148	 Analysis of shareholders
	ibc	 Company information
Our core values
centre on five
distinct areas.
They remain the
guiding principles
by which we
operate and form
the basis of our
corporate
personality.
OUr VALUES
Describes our
people focused,
accessible, personal
and customised approach,
anchored on the vital African
energy. In short, we are
passionate because
we believe in and love
what we do.
Is a key
value of the
Group, which is the
ability to be reliable,
ethical, credible, and
trustworthy with a great
sense of heritage. Our
cast iron ethics underpin
our unquestionable character
and business practice.
Are the
essence of our
existence. Our
world-class staff,
clients, shareholders
and other stakeholders
define our ambitions, success
and passion. Our passion for
people makes us
customer-centric.
Embodies
the key traits of
being visionary, dynamic,
energetic, challenging and agile.
In practical terms, adoption
of this core value means
devotion to driving change
by provoking new ideas
and always doing
things differently.
Entails being
uncomprimising, focused,
and confident in offering
world-class products and
services. We strive for
excellent in what we
do and are always
seeking to improve
our performance.
Total income up by 21% from
BWP546 million to BWP659 million
Cost to income ratio decreased
to 74% (2010: 77%)
Net operating income was flat
at BWP113 million compared to
BWP111 million despite a charge
of BWP35 million in respect of the
fair value loss and additional interest
arising from the International Finance
Corporation (IFC) convertible loan.
Excluding the impact of this convertible
loan, net operating income increased
by 33%
Pre-tax profit was 18% up from
BWP91 million to BWP108 million
Operating expenses up by 25% from
BWP435 million to BWP546 million
largely due to increased product
and branch roll out in Retail and
SME banking
Attributable profit to shareholders
up 24% from BWP67 million to
BWP83 million
Zambia Tanzania
Mozambique
Zimbabwe
highlights
Basic EPS of 56.6 Thebe
(2010: 46.3 Thebe)
Deposits increased by 50% from
BWP4.9 billion to BWP7.4 billion
Loans and advances almost
doubled from BWP3.1 billion
to BWP6.1 billion
Total assets increased by
53% from BWP6 billion to
BWP9.2 billion
Average return on equity
at 16% (2010: 16%)
Retail Branches have increased
to 49 (inclusive of consumer
banking branches) from
31 branches in 2010
Staff numbers increased
to 1,008, compared to 668
as at the end of December 2010
Botswana
1
five-year financial highlights
31 Dec 2011
US$’000s
31 Dec 2010
US$’000s
31 Dec 2009
US$’000s
31 Dec 2008
US$’000s
31 Dec 2007
US$’000s
Income statement
Net interest income after
impairment 48,692 41,542 17,948 20,498 12,152
Non-interest revenue 47,692 38,930 37,402 31,650 37,849
Total income 96,384 80,472 55,350 52,148 50,001
Operating expenditure (79,873) (64,089) (51,610) (34,679) (26,126)
Net income from operations 16,511 16,383 3,740 17,469 23,875
Share of (losses)/profits of
associates and joint venture (757) (2,966) 2,281 337 540
Profit before taxation 15,754 13,417 6,021 17,806 24,415
Taxation (2,924) (3,314) 2,225 (4,905) (3,417)
Profit for the year 12,830 10,103 8,246 12,901 20,998
Attributable to
  Equity holders of parent 12,143 9,827 8,202 12,592 20,174
  Minority interests 687 276 44 309 824
Profit for the year 12,830 10,103 8,246 12,901 20,998
Balance sheet
Cash and cash equivalents 166,122 154,997 132,194 68,056 87,832
Financial assets held for trading 86,980 173,375 134,707 90,956 143,642
Financial assets designated at
fair value 24,771 12,274 – – –
Derivative assets held for risk
management 4,320 6,516 1,195 5,891 –
Loans and advances to customers 811,940 477,415 299,099 298,450 207,372
Investments 11,513 8,224 7,387 8,988 11,795
Investment in associates
and joint venture 2,343 5,405 6,138 5,471 5,064
Other assets and
investment property 32,773 34,048 32,123 14,101 16,426
Property and equipment 68,788 51,217 41,818 28,776 9,178
Intangible assets 17,417 8,903 7,558 5,653 5,824
1,226,968 932,374 662,219 526,342 487,133
Shareholders’ equity 81,839 67,911 62,325 60,572 54,230
Deposits 985,260 761,083 502,932 374,385 326,096
Derivative liabilities held
for risk management 6,288 162 293 294 849
Borrowed funds 131,167 89,868 81,519 79,565 96,855
Other liabilities and taxation 22,414 13,350 15,151 11,526 9,103
1,226,968 932,374 662,219 526,342 487,133
Shares in issue 149,472,131 146,419,524 146,419,524 146,419,524 132,568,680
Cost to income ratio (%) 74 77 82 59 47
Average shareholders’ equity 74,875 65,118 61,449 57,401 50,456
Return on average shareholders’
equity (Headline) 16% 15% 13% 23% 42%
Net asset value per share (cents) 54.8 44.7 40.9 39.7 39.4
Closing exchange rates to US$
Botswana Pula 7.49 6.45 6.67 7.54 6.02
Euro 0.77 0.75 0.69 0.72 0.68
Mozambican Metical 27.31 32.58 29.19 25.50 25.86
Tanzanian Shilling 1,590.01 1,505.01 1,339.51 1,315.02 1,146.01
Zambian Kwacha 5,110.01 4,800.00 4,650.00 4,795.00 3,850.00
Zimbabwe Dollar (dropped 10 zeros
in 2008)
  – official – – – 5,059,942.76 30,000.00
  – calculated – – – 642,901,315.78 4,948,961.54
on a historical cost basis in US$’000s
five-year financial highlights
ABC Holdings Limited ANNUAL REPORT 20112
salient features
2011 2010 % change
Income statement (BWP’000s)
Profit attributable to ordinary shareholders 83,002 66,710 24%
Balance sheet (BWP’000s)
Total assets (attributable) 9,183,888 6,011,439 53%
Loans and advances 6,077,399 3,078,110 97%
Deposits 7,374,700 4,907,045 50%
Net asset value 596,811 422,336 41%
Financial performance (%)
Return on average equity 16% 16%
Return on average assets 1.2% 1.3%
Operating performance (%)
Non-interest income to total income 49% 48%
Cost to income ratio 74% 77%
Impairment losses on loans and advances to gross average
loans and advances 1.7% 0.6%
Effective tax rate 19% 25%
Share statistics (000’s)
Number of shares in issue 149,473 146,420 2%
Weighted average number of shares 146,760 143,956 2%
Share statistics (thebe)
Earnings per share 56.6 46.3 22%
Dividend per share 17.5 10.0 75%
Net asset value per share 3.99 2.93 36%
3
GloBAl AnD reGionAl eConoMiC
DeveloPMents
The V-shaped economic recovery experienced in 2010 and
early 2011 was spearheaded by China and India before
quickly spreading to other emerging and developing markets
and to a lesser extent developed economies. Any hope of
a sustained economic recovery, however, suffered a major
setback following the re-emergence of the Euro-debt crisis
which entered a perilous new phase. The adverse spill-
over effects of the Euro-debt crisis led to high risk aversion
and tight financial conditions, triggering a considerable slow-
down in economic activities in most advanced economies.
Emerging and developing economies have not been spared
from the contagion effect as witnessed by the downturn in
economic growth.
eConoMiC Growth PerforMAnCe
in ABC MArkets
Recovery from the global crisis is, however, well underway
in the Sub-Saharan Africa (SSA) with most countries now
fairly close to the mid 2000s GDP growth levels of between
5% and 6%. Average economic growth in Mozambique,
Tanzania and Zambia has been well above the regional
average. On a brighter note, Zimbabwe’s performance over
the last three (3) years has also shown that the country has
immense potential to surpass the regional average growth
rate, albeit coming off a low base. In Botswana, although
economic growth has been commendable, the country
is more prone to negative external shocks. Nonetheless,
in 2011, economic growth momentum in most regional
economies was not affected by the evolving Euro-debt
crisis. In 2012, considerable headwinds from slower growth
in global economy, lower commodity prices, heightened
uncertainty in global financial markets and monetary policy
tightening pose significant downside risks to growth
prospects.
Group underlying performance
during 2011 was strong despite
a tough business environment.
The Group continued its Retail
Banking expansion with
significant investment made in
expanding the branch network
as well as the underlying
systems to effectively serve
customers in this market
segment. Business growth was
phenomenal and this lays a
strong foundation for the future.
Retail Banking is expected to
start contributing a greater
portion of revenue and
profitability going forward,
which bodes well for the Group.
grOUP chairMan’s rePOrtgrOUP chairMan’s rePOrt
ABC Holdings Limited ANNUAL REPORT 20114
GDP Growth Trend in
ABC Markets
The Botswana economy is estimated to have grown by 6.2%
in 2011, largely due to strong performance in construction,
mining and manufacturing sectors. Botswana’s economic
growth remains inextricably linked to global developments
particularly via diamonds exports which are highly dependent
on the global economic performance.
Despite the weakening global economic prospects,
Mozambique remained resilient. The economy is estimated
to have grown by 7.2% in 2011 and it is projected to
register a stronger growth of 7.5% in 2012. An acceleration
of both megaprojects and traditional exports helped offset
the increase in the import bill for fuel products and mega­
projects investments during 2011.
Economic growth in Tanzania is estimated to have slowed
down from 7.0% in 2010 to 6.1% in 2011 largely due to the
negative impact of power shortages. The country’s power
generating capacity was affected by the less than normal
rainfall for 2011. Efforts to restore power generation are
underway but will take time to be implemented.
Zambia is one of the most stable countries in the Southern
African Development Community (SADC) and Africa as a
whole. Despite being home to a more competitive political
landscape, Zambia has enjoyed political stability for the
past two decades with no major conflict. The country has
been able to hold successful elections for the past two
decades with smooth changeover of power from one
political party to another. The Zambian economy has over the
years performed very well due to strong macroeconomic
policies, favourable external environment in some years
5
Chairman’s report continued
In Botswana, average annual inflation increased by 1.6
percentage points from 6.9% in 2010 to 8.5% in 2011.
During the year, inflation was well above the Central Bank’s
medium-term range of 3 – 6%. Higher inflation from South
Africa, the country’s major import source accounting for 70%
of total imports has also been transmitted to Botswana’s
domestic prices through increased imported inflation.
Mozambique witnessed a dramatic collapse in inflation that
stood at 16.5% in January 2011 and receded remarkably
to end the year at 5.5%. Average inflation for the year was
10.5%, which compared favourably to 12.7% in 2010. In
addition to targeting the stock of base money, and hence
money supply, the Central Bank has been using the exchange
rate as a tool to fight inflation.
East African countries suffered from similar exogenous
shocks including a drought induced spiral in food prices that
pushed headline inflation higher. However, the accelera­
tion in inflation in Tanzania came considerably later, relative
to the experience of Uganda and Kenya. In Tanzania, annual
inflation which stood at 6.4% in January was relentlessly
on the rise, surging for consecutive months to end the year
on a high of 19.8%. Average annual inflation stood at 12.7%,
which was significantly higher than 7.2% in 2010.
and extensive debt relief. Over the years spanning from
2001 to 2011, average economic growth has been 5.7%,
whichisalmostinlinewithSSAgrowthaverage.Importantly,
economic growth has been broad-based and less dependent
on mining as was the case in the past.
In Zimbabwe, the country has immensely benefited from
the use of the multicurrency system, which has brought
the much needed economic stability. Having emerged
from 10 years of uninterrupted depression, the economy is
estimated to have posted a positive growth for the third
consecutive year. Albeit coming from a low base, the
economy grew by 5.7% in 2009, 8.1% in 2010 and 9.3%
in 2011. Good economic growth has largely been under­
pinned by strong growth in agriculture, mining, and tele­
communications sectors.
Inflation Rate Developments
During 2011, inflation surged in a number of SSA countries
with East African countries experiencing precipitous
increases towards the end of the year. Elevated inflation
pressures were mainly emanating from higher food and
fuel prices, particularly in non-oil exporting countries.
ABC Holdings Limited ANNUAL REPORT 20116
7-year bond auction that was planned for end of August.
Correspondingly, for the first time since mid 2009, the
weighted interbank rate increased to double digit levels
in October and peaked at above 30% in December in
sympathy with the tight liquidity conditions.
In Zambia, the central bank significantly reduced the
utilisation of open market operations (OMOs) to drain
liquidity. Rates fell accordingly, with the overnight lending
facility rate falling to 7.5% in mid November, from a high of
18% in the third quarter of the year. Yields on Government
securities also fell in line with the increased liquidity. In
October, 91-day and 364-day yields which stood at 8.6%
and 15.3% respectively, fell by 150bps and 190bps to end
the year at 7.1% and 13.4%.
Since dollarisation, Zimbabwe’s central bank has played a
peripheral role following its loss of the lender of last resort
function. As a result, there is no benchmark policy rate
to guide the market. This notwithstanding, lending and
investment rates firmed in the last quarter of 2011 on the
back of persistent liquidity challenges and high credit
demand. During the fourth quarter of 2011, nominal
lending rates of corporate loans for banks ranged between
8% and 30%, with the majority of banks hovering around
the 20% mark. Time deposits, which constitute less than
10% of total bank deposits, attracted rates in the range of
15% to 20%. Smaller financial institutions that were hard
hit by the liquidity crunch were offering higher returns on
time deposits.
In 2011, Zambian Authorities managed to contain annual
inflation within single digit levels, ending the year at 7.2%.
Average inflation for the year stood at 8.7%, marginally
higher than 8.5% in 2010. Food inflation was relatively low,
benefiting from a record high maize harvest for the past
two seasons. Non-food price inflation surged during the
first quarter of the year largely driven by firm international
oil prices.
Zimbabwe, having suffered from the debilitating effects
of hyperinflation, enjoyed the benefits of operating under
the multicurrency system. It recorded relatively low levels
of inflation. Average annual inflation for 2011 was 3.5%
compared to 3.1% in 2010. The economy also benefited
from a significantly weaker Rand in the second half of 2011
as this dampened imported inflation.
Interest Rates Developments
Despite a relatively high inflationary environment in 2011,
a number of countries did not tighten their monetary policies.
Interest rates have not materially changed from the low
levels that prevailed during the 2008/09 global financial
crisis.
In 2010, Botswana’s Bank Rate remained unchanged at
10% until mid-December 2010 when it was lowered by 50
basis points to 9.5%. Since then, the bank rate remained
flat at 9.5% throughout 2011, mimicking South Africa’s
prime rate which was fixed at 9%. However, the real bank
rate was low in 2011, at an average of 1% compared to a
long-term average of 3.7%, suggesting some degree of
monetary accommodation.
The Bank of Mozambique (BoM) was more concerned with
economic growth as well as the risks posed by the global
financial markets to Mozambique. This contributed to the
MPC’s decision to cut the Standing Lending Facility (SLF)
rate by 50bps in August 2011 to 16%, while also loosening
themonetaryconditionsbyreducingthereserverequirement
ratio by 25bps from 9% to 8.75%. In November, BoM
further reduced the SLF by 100bps to 15%, taking advantage
of decelerating inflation.
Elsewhere in Tanzania, the overnight and T-bill rates, which
were 8.0% and 6.4% respectively at the beginning of the
year, gradually softened during the year before firming up
towards the end of the year as liquidity conditions tightened.
The tight liquidity conditions may have led to a failure of a
7
Chairman’s report continued
Exchange Rate Developments
Generally, for many economies in the region that operate
flexible exchange rate regime, adverse terms of trade often
translate to depreciation of their currencies. Likewise, the
World Bank noted that during the downturn of 2009, a third
of local currencies in the region depreciated by over 10%.
The Rand weakened considerably during the second half
of the year, largely as a result of investor concerns about
the pace of global recovery. South Africa, together with
Nigeria and Kenya, have the most liquid financial markets
and are therefore prone to global shocks. Concomitantly,
heightened uncertainty in the global financial markets in
the wake of Euro zone crisis adversely impacted on short-
term portfolio equity and investment in bonds, thereby
affecting the Rand.
To the extent that the Rand has a dominant weight in the
Pula basket of currencies, the Rand weaknesses appear
to be transmitted to the Pula. As of end of 2011, the Pula
was trading at BWP7.52/US$ compared to BWP6.44/US$
in December 2010, reflecting that the Pula depreciated
against the US$ by 16.9%. Similarly, on a year on year basis,
the Pula depreciated against the EUR (13.1%), GBP (16.5%)
and Yen (22.6%) but appreciated against the ZAR (5.5%).
In addition to targeting the stock of base money, and hence
money supply, the central bank of Mozambique has been
using the exchange rate as a tool to fight inflation. The
Metical thus appreciated considerably by 18% against
the US$, from MZN32.89/US$ in December 2010 to
MZN27.13/US$ in December 2011. The Metical was
generally stable against the Rand during the first half of
2011 before strengthening considerably from MZN4.20/ZAR
in June to MZN3.32/ZAR in December. Against this back­
ground, the relatively stronger Metical helped to dampen
imported inflation from SA.
During the first ten months of the year, the Tanzanian Shilling
was under consistent pressure against the US dollar. The
weighted average exchange rate, which stood at TZS1,470/
US$ in December 2010, progressively depreciated by nearly
15% to TZS1,688/US$ in October before reversing the trend
during the remainder of the year. The Shilling also recovered
well against the Rand during the second half of the year to
reverse its earlier losses.
The Zambian Kwacha was broadly stable during the first
half of the year, trading at an average of ZMK4,761/US$.
During the second half of the year, the Kwacha came
under pressure on the back of concerns regarding the
political landscape as well as deteriorating external factors.
As a result, the Kwacha was relatively weak, trading at
an average of ZMK4,962/US$. The Kwacha, however,
appreciated by 12.7% against the ZAR, from ZMK723/ZAR
in December 2010 to ZMK632/ZAR in December 2011.
ABC Holdings Limited ANNUAL REPORT 20118
Financial Sector Developments
Although the banking sector in most African countries was
not directly exposed to the toxic banking assets and
financial turmoil in the developed world, the spillover
effects were seen through reduced lending activity,
deterioration in the quality of loans resulting in precipitous
increase in the level of non-performing loans (NPLs),
drying up of lines of credits as well as a decline in the
level of deposits. Nevertheless, the banking sector in
many African countries appears to have weathered the
negative effects of the global financial turmoil. In an
attempt to prevent any slip-ups, most Central Banks
stepped up enforcements to ensure compliance with
regulations while, in some cases, they raised the minimum
capital requirements.
The banking sector in Botswana is regulated and supervised
by the Bank of Botswana. The sector can broadly be divided
into two main segments: the banking sector and the non-
banking financial sector. The banking sector is mainly
comprised of commercial banks while the non-banking
financial sector is mainly comprised of insurers, pension
funds, asset managers, microfinance institutions and other
credit institutions. The negative impact of the global financial
crisis was felt through a decline in both Pula and foreign
currency denominated deposits while the level of non-
performing loans edged up slightly in 2010.
However, banking sector deposits continue to increase,
having fully recovered from the indirect effects of financial
crisis. Total deposits that stood at BWP37,572 million
(US$5,632 million) in December 2009 marginally improved
to BWP41,619 million (US$6,463 million) in December
2010 and stood at BWP44,221 million (US$6,120 million
in September 2011. The share of foreign currency denomi­
nated deposits (FCAs) has however not recovered from
the levels that prevailed prior to the global recession. As
of September 2011, the share of short-dated deposits
accounted for 62% of total deposits (i.e. call, 38%; current,
17%; and savings, 7%). The savings accounts are considered
short-term since they are mostly used as transactional
accounts. The balance of 38% of total deposits is considered
time deposits, consisting of 88-day (14%), 6 months (20%)
and over 12 months (4%) deposits. As of September 2011,
total bank loans to the private sector amounted to
BWP26,053 million (US$3,606 million), having increased
by BWP4,348 million (US$311 million) from BWP21,706 million
(US$3,295 million) in September 2010.
Mozambique’s domestic banking system is dominated by
high foreign ownership and most banks are adequately
capitalised. The number of banks operating in the market
has increased from 14 in 2008 to 16 from December 2010.
The Mozambican banking system remains highly con­
centrated with the three largest banks, which are all foreign
owned, accounting for 80% of the system’s assets.
9
Chairman’s report continued
Authorities have also lowered reserve requirements for
banks to 8.5% in an attempt to allow more room for
credit creation by banks in light of the unfolding current
international crisis and uncertainty. Total bank deposits
improved from MZN114 billion (US$3,468 million) in
December 2010 to MZN120 billion (US$4,478 million) in
November 2011 largely reflecting full scale banking sector
recovery and increasing confidence. In 2011, due to a con­
tinuously strengthening Metical, businesses appear to be
relinquishing their FCAs deposits in preference to the Metical
denominated deposits. Consequently, the ratio of FCAs to
total deposits declined from 43% in September 2010 to
40% in March 2011 and further to 31% in November 2011.
Out­standing private sector credit stood at MZN96 billion
(US$3,576 million) in November 2011 compared to
MZN93 billion (US$2,626 million) in November 2010. This
represents an annual increase of MZN3 billion or a growth
rate of 3.4%. However, the concentration of loans on single
borrowers and tight liquidity conditions remain major
concerns for the banking sector.
In Tanzania, the banking sector experienced a significant
increase in NPLs largely due to the lagged impact of the
global financial crisis in some sectors as well as high
delinquency in household loans. However, the level of
NPLs has started to decline. The NPLs were 8% of total
loans at the end of September 2011, down from nearly
10% at the beginning of the year, reflecting efforts to
strengthen loan collection, follow-up and tightened under-
writing standards. Total bank deposits increased by
US$933 million from US$5,816 million in October 2010 to
US$6,750 million in October 2011. As of October 2011,
foreign currency deposits accounted for about 37% of
total deposits. Annual growth in private sector credit also
improved to 31% in October 2011 compared to 20.3%
during the same month in 2010. In nominal terms credit
to the private sector grew by US$731 million from
US$3,884 million in October 2010 to US$4,615 million
in October 2011.
ABC Holdings Limited ANNUAL REPORT 201110
The Zambian banking sector experienced a decline in deposit
levels in the last quarter of the year. In January 2011, total
bank deposits at US$3,607 million steadily increased to
their highest level of US$3,966 million in October before
retreating to US$3,786 million – possibly due to the impact
of the depreciating Kwacha during this period. Private sector
creditincreasedby29%fromK8,298 billion(US$1,683 million)
in November 2010 to K10,702 billion (US$2,100 million) in
November 2011. Household loans account for about 34%
of total loan portfolio.
InJanuary2012,theZambianMinisterofFinanceannounced
a radical change in the minimum capital requirements for
banks. By 31 December 2012, foreign owned banks are
required to have minimum tier I capital of US$100 million and
locally owned banks are required to have US$20 million as
minimum tier I capital. There are some interim mile-stones
that banks should meet in as far as minimum capital is
concerned before the final deadline of 31 December 2012.
Until recently, Zimbabwe’s banking sector recovery had
been relatively smooth, with Government projecting strong
growth rate of 24% and 23% in 2011 and 2012, respectively.
During the second half of 2011, the banking sector was
trapped in a liquidity squeeze that potentially threatened
to cause irreparable damage to some banks. The liquidity
challenges intensified during the festive season on the
backdrop of:
•	 overly high import bill compared to exports receipts –
partly triggered by a surge in second hand car imports
following a threat to ban used cars that are older than
five years;
•	 government expenditure overruns since August 2011 that
saw the fiscal surplus being depleted from US$220 million
to US$30 million by year end; and
•	 high value cash withdrawals during the festive season
This notwithstanding, Zimbabwe’s banking sector deposits
have grown in leaps and bounds on the back of increasing
confidence. Against this background, deposits held by
banks grew by over US$900 million from US$2,328 million
in December 2010 to US$3,300 million in December 2011.
Deceleration in the deposit growth during the second
half of 2011 was largely attributable to persistent liquidity
challenges during this period. Total credit advanced by
banks continued on an upward trend, increasing by 163%
from US$636 million in December 2009 to US$1 677 million
in December 2010 and by 69% to US$2,838 million in
December 2011. However, most banks deliberately reduced
lending on the back of tight liquidity conditions that prevailed
during the second half of 2011.
11
Chairman’s report continued
Outlook
The global economy is going through a difficult patch due
to the adverse impact of the worsening Euro-debt problems.
According to the World Bank and the IMF, capital inflows
to the developing countries declined by almost halfcompared
to 2010, while growth in several major developing countries
(Brazil, India, and to a lesser extent, Russia, South Africa
and Turkey) has slowed down partly in reaction to domestic
policy tightening. Elsewhere, the Euro area could enter into
a mild recession in 2012 as a result of the rise in sovereign
yields, the effects of bank deleveraging on the real economy
and the effect of fiscal consolidation.
Despite the existence of multiple shocks such as heightened
uncertainty and slowdown in the global economy, volatile
and high fuel and food prices, SSA continued its post-crisis
recovery trajectory. According to the World Bank, over a
third of countries in the region attained GDP growth rate of
at least 6%. Strong economic growth has been supported
by both domestic and external demand – supported by
higher commodity prices.
There are, however, growing fears that if the Euro-debt crisis
evolves into a major crisis, the global downturn may be
longer than it was in 2008/09. This is due to the fact that
high-income countries do not have the fiscal or monetary
space to bail out banking systems or stimulate demand.
The risks of a global downturn could severely harm SSA’s
growth prospects. As in the 2008/09 global crisis, a reduction
in global demand for the region’s exports could lead to
sharp declines in commodity prices and hence export and
government revenues.
Economic growth in the ABC markets is expected to remain
on a positive trajectory, although the downside risks of a
possible global downturn could be damaging. In Zimbabwe,
investors and businesses alike remain wary of a possible
election later on during the year. As a result, the country
will continue to find it difficult to shake off its high political
risk tag that has made it difficult for banks to access the
much needed external lines of credit.
Staff share purchase allocation
During the year, 3.1 million new shares together with
2.3 million treasury shares, were issued to staff at a discount
of 15% on the share price as at 14th March 2011. This
brings the total number of issued shares to 149,472,131
out of an authorised number of shares of 150 million.
Governance
The Board was further strengthened by the appointment
of Mr Mark M Schneiders, the Chief Development Officer
of African Development Corporation in December 2011.
I would like to welcome Mr Schneiders to the Board.
Mr Schneiders brings a wealth of international banking
Regional Economic Outlook
World Bank Outlook IMF Outlook
2011 2012 2013 2011 2012 2013
World Economy 2.7 2.5 3.1 3.8 3.3 3.9
Euro Area 1.6 (0.3) 1.1 1.6 (0.5) 0.8
Developing Asia n/a n/a n/a 7.9 7.3 7.8
Sub-Saharan Africa 4.9 5.3 5.6 4.9 5.5 5.3
experience accumulated over many years in the financial
services sector.
Rights issue
The balance sheet of the Group has significantly increased
over the last couple of years. As a result, it would not be
possible to grow any further without additional capital
being sourced. BancABC Botswana, BancABC Tanzania and
BancABC Zimbabwe are now at a stage where their capital
adequacy levels are very close to regulatory minimums.
ABC Holdings Limited ANNUAL REPORT 201112
At the same time BancABC Mozambique is no longer able
to fully support its very good clients as they have grown
faster than the bank. In 2008 the bank took a strategic
decision to expand its product offering to include Retail
Banking. This growth has been funded entirely from internally
generated funds. This line of business is now showing lots
of potential and indications are that it should make profits
in 2012. However, it is very capital, systems and people
intensive. In view thereof, the Board has recommended that
US$50 million be raised immediately by way of a rights issue
inordertoensurethattheGroupdoesnotlosethemomentum
that has been created. African Development Corporation,
a 23.2% shareholder in the Group, has agreed to underwrite
the entire issue. Further details are contained in the circular
to shareholders that will be released shortly after the
publication of this report.
As alluded to earlier in this report, the Bank of Zambia
has increased the minimum level of capital from some
US$2 million to US$100 million. The Board is currently
evaluating all the options to address this new requirement.
Shareholders will be advised of any new developments in
this regard as necessary.
DiviDenD
In line with the Group dividend policy, a final dividend of 10.5
Thebe in respect of the year ended 31 December 2011 is
being proposed by the Board. This will bring the full year
dividend to 17.5 thebe per share. The final dividend will
be paid on 4 May 2012 to shareholders on the register at
the close of business on 13 April 2012.
ACknowleDGeMents
I would like to thank my fellow directors, management and
staff for the strong results posted by the Group. This positions
the Group well for growth in future.
HJ Buttery
Group Chairman
HJ Buttery
13
The rest of the operations delivered pleasing performance
punctuatedbyincreasedrevenueanddisparatebutincreased
activity in the retail business, which continued to improve
from strength to strength. Staff numbers have swelled from
668 in December 2010 to 1,008 in December 2011 even
though a significant number are on short-term contracts.
Total assets grew from BWP6 billion in December 2010
to BWP9 billion by December 2011, total deposits from
BWP5 billion to BWP7 billion and total loans from BWP3
billion to BWP6 billion. This growth is a reflection of many
years of dedication and systematic execution by the Group
and its subsidiaries. Operations are getting close to critical
mass and I am pleased by the subsidiaries’ performance in
2011. We ended 2011 with Botswana, Mozambique, Zambia
and Zimbabwe producing increased year-on-year profits
averaging about US$5 million each. This is a giant leap from
the results these subsidiaries have been posting in the past.
The expansion the Group is undertaking has necessitated
the need to raise more capital by way of a rights issue.
Market Analysis
Some very positive developments have taken place within
the Southern African Development Community (SADC)
regionintheenergysector.Texas-basedAnadarkoPetroleum
Corporation (Anadarko) recently announced a large natural
gas find off the northern Mozambican coast in the Rovuma
Basin increasing its estimated recoverable resources from
15 to 30 trillion cubic feet of gas. Anadarko has awarded
a contract to a US based company KBR, Inc. to design a
liquefied natural gas (LNG) plant for Mozambique. Anadarko
co-owners are Mitsui of Japan (20 per cent), BPRL Ventures
and Videocon (both of India, with 10 per cent each) and
Cove Energy of Britain (8.5 per cent). The Mozambican
government is represented by Empresa Nacional de Hidro-
carbonetos which holds a 15 per cent interest in the fields.
Inaddition,ENIandAnadarkohavemadeasizeablepetroleum
discovery off Mozambique’s coast.
During 2011, the Group
performed satisfactorily
ending the year
stronger than the
2010 financial year.
This progressively
brighter picture was
spoiled by high NPLs
and market risk
in Tanzania.
grOUP ceO’s rePOrt
ABC Holdings Limited ANNUAL REPORT 201114
year. The profitability achieved is particularly pleasing when
viewed against the background of the Group’s ongoing
massive investment in the Retail Banking business, which
continued despite the mixed economic conditions that were
a dominant characteristic of the banking sector during the
reporting period. The Group balance sheet increased by 53%
from BWP6 billion to BWP9.2 billion. Loans and advances
were up almost two fold from BWP3.1 billion to BWP6.1 billion.
This was largely funded by deposits that increased by 50%
from BWP4.9 billion to BWP7.4 billion. All major lines of
business recorded significant growth during the year. The
Group now has 49 Retail branches including consumer
lending branches, up significantly from 31 branches in 2010.
Rapid expansion of retail banking operations continued, with
BWP177 million being spent on essential hardware and
software during the last 24 months. As was to be expected,
staff numbers continued to grow. By the end of the reporting
year staff numbers, including temporary and contract workers,
stood at 1,008, compared to 668 at the end of December
2010. Whilst the Retail Banking business is still recording
losses, excluding Zimbabwe, where it is already profitable,
we are happy with the progress made to date in Botswana
and Zambia.
OVERVIEW
On the other hand, Tanzania is predicted to become an
important gas producer by the end of the decade. Significant
natural gas discoveries have also been made off the coast
of Tanzania. The country is expected to receive FDI in excess
of US$7 billion from Ophir Energy and its partner British Gas.
Combined with Angola, these finds in Mozambique and
Tanzania will introduce a new dimension in the oil and
gas sector and put the SADC on the global energy map.
The upstream and downstream effects will feed into our
businesses in these key markets and position us for
accelerated growth in the coming years.
The Botswana Democratic Party celebrates its 50th year
anniversary in 2012. This democratic milestone is coming
soon after the ANC of South Africa celebrated 100 years
in 2012. This is a positive development in the interests
of democracy.
In Zambia, the election of President Michael Sata introduced
a new dimension to politics in that country. The transition was
peaceful. The recent victory of the Zambian national team
at the continental soccer tournament AFCON was a great
unifying event that lifted the spirits of all Zambians and
extends to the whole SADC region.
The Zimbabwean political landscape is still governed by the
Government of National Unity between ZANU-PF and the two
MDCpoliticalparties.Theenactmentofthenewconstitution,
whose review is currently in process, should pave way for
elections. However, the timing for the enactment of the new
constitution and the eventual elections is currently unknown.
FINANCIAL REVIEW
The Group posted a strong set of results for the period with
all the banking subsidiaries, with the exception of Tanzania,
reportingexcellentresults.AttributableprofitatBWP83million,
is 24% higher than the BWP67 million achieved in the previous
15
Net interest income
Net interest income of BWP412 million was 38% ahead of
the BWP298 million achieved in 2010. All entities recorded
an increase in net interest income on the back of significant
growth in balance sheet sizes. Net interest margin declined
slightly from 6.6% to 6.3%. However, this is expected to
increase in the coming periods as the Retail Banking loan
book grows. As at 31 December 2011, the Retail Banking
loan book constituted 20% of the total loan book compared
to 8% in 2010.
Impairment losses on loans and advances
Net impairments of BWP80 million were about five times
up on the BWP16 million prior year net charge. The
increase was partly due to portfolio impairments that
increased in line with the growth in the loan book, doubling
from BWP3.1 billion to BWP6.1 billion. The credit loss ratio
deteriorated from 0.6% in 2010 to 1.7% at the end of
2011. It should be noted, however, that the quality of the
book continues to improve with gross non-performing
loans down from 8.3% to 6.7%. Net non-performing
loans also reduced markedly and are now down to 3.3%
from 4.2% in the previous year. The largest contributor to
the impairment charges were BancABC Tanzania and
BancABC Zimbabwe, which had net impairments of
BWP33 million and BWP32 million respectively.
Fifty percent (50%) of the impairment in Tanzania is in respect
of a loan which was guaranteed by the Government of
Tanzania (GoT). Unfortunately, a lower balance was signed off
owing to the protracted time it took to conclude this issue.
Consequently, a decision was taken to write-off interest that
accrued to December 2012. In addition, a lower negotiated
interest rate was applied when the GoT took over the
loan and therefore gave rise to a loss on derecognition of the
old loan and recognition of the new loan to the GoT. The
increase in BancABC Zimbabwe impairments was due to a
combination of portfolio impairments and down-grading of a
few loans granted to a number of small and medium sized
companies. The liquidity situation in Zimbabwe had an
adverse impact on the cash flows of the bank’s small to
medium-sized customers, which has affected their ability to
service their loans as they fall due.
Non-interest income
Non-interest income of BWP326 million was ahead of the
prior year by 23%. This income is net of BWP27 million
relating to the fair value loss on the IFC loan conversion
option. This loss is largely as a result of the significant
increase in the Company’s share price but does not have
any impact on the cashflows of the business. This amount
will be transferred to equity on conversion or reversed
to income if IFC does not convert the loan to equity by
13 May 2013. Excluding this amount, non-interest income
increased by 34%. BancABC Zimbabwe performed strongly
when compared to prior year as fees, commissions and
trading income improved. Following the introduction of
Retail Banking and the increased market penetration
achieved through additional outlets created during the
year, all subsidiaries with the exception of BancABC Tanzania
saw an increase in business volumes, reflected in higher
transaction and trading income. Money market interest
rates moved up significantly, between September 2011
and year-end, in Tanzania. For example, the inter-bank rates
moved from around 4% at the beginning of 2011 and peaked
at 33% by year-end. As a result, the Group had to book
huge mark-to-market losses on its trading book. Owing to
the above, BancABC Tanzania’s non-interest income was
lower than the previous year.
Operating expenditure
Operating expenses at BWP546 million were 25% ahead
of the BWP435 million recorded in 2010. Expansion of the
Retail Banking products and the increasing retail branch
footprint resulted in higher costs across the network. These
costs are expected to increase further in 2012, but stabilise
thereafter as the business achieves critical mass. Notwith­
standing the above, the cost to income ratio reduced from
77% to 74%. The cost to income ratio is expected to continue
on a downward trend as revenue is expected to increase
more rapidly than costs. The cost to income ratio should
CEO’s report continued
ABC Holdings Limited ANNUAL REPORT 201116
This was largely due to an increase in business volumes in
both Retail and Wholesale banking divisions. We expect
Botswana to record phenomenal growth in 2012. BancABC
Mozambique experienced a surge in net interest income
resulting from better margins compared to prior year. This
drove the 26% increase in attributable profits.
BancABC Zambia had a phenomenal 184% increase in
attributable profit due to the growth in the consumer lending
book, coupled with the BWP10 million deferred tax asset
recognisedduringtheyear.BancABCZimbabwe’sattributable
profit of BWP55 million was 106% up on the BWP27 million
recorded in 2010. The deteriorating liquidity situation in
Zimbabwe affected this growth in the second half of the year.
The loss in head office entities, together with con­solidation
adjustments, increased by 92% from BWP30 million in the
previous year to BWP58 million in the current year. This was
largely due to a fair value loss and additional interest expense
on the IFC convertible loan of BWP35 million.
Operational performance
Botswana
BancABC Botswana grew its market share significantly
during the year under review. This was through the in-roads
made in the Retail segment in that market. The bank intro­
duced new innovative lending products which enabled it
to acquire a number of Retail customers within a relatively
short period. The bank was the pioneer in offering the
prepaid “chip and pin” cards and demand for this service
is growing exponentially.
BancABC Botswana’s attributable profit of BWP28 million
was 40% ahead of the prior year. Total income improved
by 37% from BWP85 million to BWP116 million on the
decline and move closer to the Group’s medium-term target
of 50% within the next 24 months.
Taxation
The Group had a net tax charge of BWP20 million compared
to a tax charge of BWP22 million in the previous year. The
effective tax rate is 19% compared to 25% in the previous
year, when the Group incurred higher losses in its share
of associate results where no tax benefit could be derived.
Current year effective tax rate is also lower, due to BancABC
Zambia recognising a deferred tax asset that had previously
not been recognised. BancABC Zambia is now highly
profitable and the tax losses will all be utilised.
Balance sheet
The balance sheet increased by 53% from BWP6.0 billion
(US$0.9 billion) in 2010 to BWP9.2 billion (US$1.2 billion)
as at 31 December 2011, a major milestone, with the thres­
hold of US$1 billion being crossed for the first time in the
Group’s history.
Loans and advances increased to BWP6.1 billion from
BWP3.1 billion in December 2010. BancABC Zimbabwe
loanbookofBWP2billionconstitutesthelargestcontribution
of 33%. Deposits increased to BWP7.4 billion from
BWP4.9 billion in December 2010. The full impact of
the massive growth in the balance sheet will be felt in
subsequent reporting periods through increased income.
Attributable profit
Banking subsidiaries achieved attributable profits of
BWP141 million, compared to the BWP97 million registered
in the previous year. All subsidiaries produced substantial
double-digit growth in attributable profit with the exception
of BancABC Tanzania, which recorded a loss for the year.
BancABC Botswana’s net profit after tax of BWP28 million
was 40% higher than BWP20 million recorded in 2010.
17
Going forward, BancABC Mozambique will build on the
success achieved in raising retail deposits to grow consumer
finance loans. The operation is also pursuing opportunities
available through payroll deduction schemes.
Tanzania
BancABC Tanzania had a twin-setback in the form of impair­
ments and interest rate risk, both of which increased during
the fourth quarter. The rapid increase in market interest
rates resulted in higher mark-to-market losses for the trading
book in a market where the secondary market is under-
developed. Inter-bank interest rates moved from 4% to peak
at 33% in December 2011.
All the other rates moved in tandem with the increase in
inter-bank rates. Rates on the operation’s 5 and 10 year
Government bond portfolio moved from 11% and 13% to
13% and 15% respectively. Owing to these factors, the
bank suffered a mark-to-market loss of BWP13 million.
In addition, the GoT decided to take over one of the BancABC
Tanzania loans that it had guaranteed. Unfortunately, there
was a discrepancy between what GoT approved and the
carrying amount in BancABC Tanzania’s books, due to the
GoT taking over six months to make a decision. As a
result, the bank suffered a loss of BWP17 million through
the reduction in interest rate and the impairment of the
loan. Total impairments for the operation at BWP33 million
were82%higherthanBWP18 millionrecordedintheprevious
year. The high impairments coupled with mark-to-market
losses resulted in the operation recording an attributable
loss of BWP3 million for the year.
TotalincomeatBWP56millionwaslowerthanBWP68 million
achieved in 2010. On the other hand, operating expenses
increased by 30% to BWP62 million due to the expansion
in Retail Banking activities.
We expect the difficult trading environment to continue
into the first quarter of 2012 and gradually improve as the
year progresses.
Zambia
BancABCZambiawassuccessfulinexpandingtheconsumer
lending business during the year.
At BWP32 million, BancABC Zambia’s attributable profit was
three-times that achieved in the previous year.
back of an increase in both volumes and margins. Net interest
income improved by 54% to BWP79 million mainly due to
improved margins and a substantial increase in the balance
sheet size. The loan portfolio increased by 109% from
BWP795 million to BWP1.6 billion. As a result, portfolio
impairments increased during the year. Non-performing
loans continue to decline and reduced to 2.2% from 9% in
the previous year. Non-interest income increased by 36%
to BWP45 million, due to increased transaction volumes.
Operating expenses increased by 41% due to an increase
in activity as the entity made inroads into the Retail Banking
market. BancABC successfully signed a number of agree-
ments with Government unions for consumer lending
business. This lucrative business is highly competitive in
Botswana, with a number of institutions operating in this
space. Cost to income ratio improved marginally from 70%
to 67% in 2011.
The bank is well positioned for significant growth going
forward. The income stream is now well diversified with
Retail Banking projected to contribute significantly to income
in the coming year.
Mozambique
BancABC Mozambique achieved strong growth in the
Whole­sale business as well as in growing Retail deposits.
Attributable profit of BWP29 million was 26% ahead of
the previous year. This was driven by the high growth in net
interest income, which increased by 109% to BWP61 million
following improvements in margins, as well as growth
in the interest earning assets.
Loans and advances increased by 80% to BWP762 million
and deposits increased by 45% to BWP1.2 billion. Interest
margins steadily improved during the year as the interest
rate shocks experienced in the previous year dissipated.
Non-interest income increased by 12% to BWP65 million
despite the decline in foreign exchange trading margins
following increased intervention from the central bank
during the year. The fall in margins was offset by an increase
in trading volumes.
NetimpairmentsincreasedfromBWP2milliontoBWP5 million
largely due to growth in the loan book. Operating expenses
increased by 43% to BWP81 million from increased activity
levels in line with the current drive to make inroads into
the retail space.
CEO’s report continued
ABC Holdings Limited ANNUAL REPORT 201118
of Retail customers has enabled
the bank to build critical mass
and compete at the same level as
the more established commercial
banks.
BancABC Zimbabwe’s attributable profit
of BWP55 million was 106% higher than
that recorded in the prior year. The increase
in attributable profit was due to the strong business
growth during the year, which gave rise to higher net
interest and non-interest income which increased by
137% and 51% to BWP136 million and BWP129 million
respectively.
Loans and advances increased by 132% to BWP2 billion
and deposits increased by 88% to BWP2 billion. Growth
in loans and advances had an adverse impact on impair-
ments, which increased from BWP2 million in 2010 to
BWP32 million in the period under review. While gross 
non-performing loans remained low at 5.87%, the impair­
ments emanated from an increased loan book and a deteriora­
tion of the quality of loans in the SME sector. Operating
expenses increased by 39% to BWP149 million due to the
increase in the number of branches as a result of the Retail
Banking roll out. The liquidity situation in Zimbabwe
deteriorated in the second half of the year. This is expected
to continue in the foreseeable future as there is no interbank
market and lender of last resort. This situation is further
exacerbated by the fact that imports currently significantly
exceed exports in a currency that the central bank does
not print. The bank has therefore deliberately undertaken
to improve liquidity at the expense of profitability. As a
result, while the business is projected to register significant
growth, profitability will not grow by the same magnitude.
Business Segments
Treasury
The division had an excellent year with wholesale deposits
increasing by 42% from BWP4.75 billion to BWP6.76 billion.
At US$985 million, the total deposits were just shy of a
major milestone of US$1 billion. Indications are that this
should be attained earlier in the first quarter of 2012. All
subsidiaries had substantial growth in customer deposits
which helped fund the growth in the balance sheet which
increased by 53%.
Growth in profits emanated from
the significant increase registered
in the consumer banking segment
where business underwritten in­
creased substantially leading to
an increase in revenues. In addition,
BWP10 million was recognised as a
deferred tax asset as the business is now
on a solid footing. This tax asset will be fully
utilised within the next 18 months.
Loans and advances in the consumer lending division
increased by 242% from BWP92 million to BWP314 million.
Whilst the bank gained some traction in its wholesale
banking activities during the fourth quarter, the results
from this segment are still regarded as unsatisfactory.
Both wholesale loans and deposits are still way below
the optimal levels required to ensure sustainable revenues.
The Wholesale Banking Division saw loans and advances
grow by 87% to BWP263 million, while deposits increased
by 116%, as market confidence in the bank continued
to improve.
Total income increased by 10% from BWP92 million to
BWP101 million on the back of a 63% increase in non-
interest income as fees from consumer lending increased
significantly during the year. Operating expenses remained
largely unchanged despite the increase in business
activity. This was largely due to realisation of the full
benefits of the merger of the two businesses (the bank
and the microfinance entity) that was embarked on in
2009/2010.
The subsidiary is on a strong footing for growth in 2012
and beyond. Transaction volumes in the wholesale division
are showing signs of improvement, but the majority of the
growth in business volumes in the near future will be from
the consumer lending division. The bank has embarked
on an aggressive cross-selling exercise, as most of the
consumer lending customers are currently using a single
product and there are major opportunities to mine the
relationships and increase product offerings and utilisation
by a growing customer base.
Zimbabwe
BancABC Zimbabwe continued the growth pattern
experienced in the recent past and has become one of
the leading banks in that market. The continued acquisition
19
and advances is largely on the back of consumer loans from
our corporate clients and government employees.
The rollout of additional products helped increase the
division’s total income, with total revenue up five-fold
from BWP27 million in prior year to BWP160 million in the
current year. Operating expenses were BWP174 million
(2010: BWP105 million) and it is evident that though the
division is still loss-making, it is closer to breaking even
and it is expected to be profitable during 2012. A number
of products were initiated during the year prime among
which were VISA prepaid, VISA debit and VISA credit
cards. Internet banking is currently being tested and is
expected to be rolled out throughout the entire platform by
end of the first half of 2012.
Human Capital
The Group’s staff compliment continued to increase with
the number of staff increasing from 668 in 2010 to 1,008
in 2011.
During the year, the division continued with its Leadership
Development Programme in partnership with University
of Pretoria’s Gordon Institute of Business Science (GIBS).
This was a three-year programme whose objective was to
raise the leadership capacity of the Group’s managers at
all levels. The programme was a success and it came to
an end in 2011. Related to the GIBS programme is the
Executive Coaching programme with Landelhani. This is an
on-going programme which was put in place for the bank’s
senior managers with a view to broadening their leadership
capability. The programme will continue in 2012.
The Group also runs an on-going Mentorship Programme
for its managers to complement the abovementioned
pro­grammes. Overall the output of all these initiatives
has been enthusiastic support from the participants and
enhanced leadership skills across the whole Group. This
will remain a major thrust of human investment in the
Group for the future.
Money market and foreign exchange trading income also
increased with the latter growing by 9% from BWP106 million
to BWP116 million and the former by 8% to BWP48 million.
Trading activities remained high during the year leading
to growth in income. However, during the fourth quarter,
Tanzania suffered higher volatility in money market interest
rates which resulted in mark-to-market losses that wiped out
trading gains the entity had achieved earlier during the year.
Zimbabwe experienced serious liquidity challenges in the
fourth quarter. This situation is expected to improve in the
first quarter of 2012 with the opening of tobacco auction
floors and increased activity by the diamond traders. Liquidity
management has become a major focus area for the Group.
On the trading front, treasury will focus on customer flows
rather than proprietary trading.
Corporate banking and structured finance
The division’s loan book grew by 63% from BWP3 billion to
BWP4.9 billion on the back of increased market penetration
across the footprint. This had a positive impact on interest
income from loans and advances which increased by 48%
to BWP666 million and on arrangement fees which increased
by 29% to BWP79 million.
Despite higher impairments on a large corporate client in
Tanzania, the quality of the loan book continued to improve
with gross non-performing loans (NPLs) declining to
7.4% from 8.6% and net NPLs to 3.6% from 4.6% in the
previous year. The largest contributor to the division’s loan
assets was Zimbabwe, which contributed 33% followed
closely by Botswana at 27%.
Given the tight liquidity conditions in Zambia and Zimbabwe,
the division is increasingly focusing on non-funded trans­
actions and has made significant progress particularly in
Zambia where this business now accounts for 50% of the
corporate banking business.
Retail and SME banking
The retail banking division achieved phenomenal growth
during the year, albeit from a low base. It continued rolling
out products across the Group’s footprint and these have
been well received. The number of branches and consumer
lending outlets increased from 31 to 49 as at 31 December
2011.
Customer deposits almost quadrupled from BWP153 million
in 2010 to BWP610 million in 2011. Loans and advances
increased eleven-fold from BWP109 million in 2010 to
BWP1.2 billion in the current year. The increase in loans
CEO’s report continued
ABC Holdings Limited ANNUAL REPORT 201120
expansion,mostlyontheRetailbankingfront.Thedepartment
was bolstered with additional staff who have brought
much needed skills internally to service internal and external
customers more efficiently and effectively. The core banking
software for the Group was successfully upgraded during
the year and this puts the Group in a better position to be
able to seamlessly interface the core system with other
support systems that are utilised within the Group.
Over the last couple of years, we have had challenges in
IT due to the fact that we have been building multiple
plat­forms within the division. Consequently the major area
of focus in the first half of 2012 would be to stabilise
the core banking system and improve connectivity by
ensuring that wherever possible we use fibre optic networks
as opposed to the current scenario where VSAT is still
dominant.
The Group’s Banking Operations department supports
various revenue-generating departments. The department
continuously looks for new and better ways of servicing
the customer and at the same time reduce the error rate
to negligible figures. The department also ensures that
all processes are relevant, documented and up-to-date.
During the year, reviews of various processes were done
with a view to improving transaction handling capability
and where possible to automate these processes. Straight-
through processing will also be implemented in the back
office area to ensure that the error rate is reduced and also
improve on our speed of processing transactions.
The Group continued its ever popular Graduate Management
Development Programme with the recruitment of 28 new
graduates for 2012. These are specially selected graduates
who are taken through an accelerated programme on various
facets of banking to enable them to join at a relatively senior
levelwithintheGroupassoonastheycompletethe18months
programme.
The Balanced Scorecard (BSC) is the Group’s chosen
strategic management and performance monitoring tool.
In 2011 the Group was able to cascade it down to the
individual level. All employees regardless of rank now have
their individual BSC scorecard and are now monitored and
rewardedbasedontheattainmentoftheirKeyPerformance
Indicators (KPIs). This has helped bring focus in the business
and ensures that employees concentrate on activities that
will bring the most value to the Group.
Going forward, the human capital division will continue to
entrench strategic human capital management practices,
improve overall employee productivity, drive people costs
down and drive a robust talent management system that
includes succession planning. The overall objective is to
attract, develop and retain highly skilled employees within
the Group.
Other supporting divisions
The Group operates a centralised Information Technology
(IT) function which is the key enabler to the business.
The focus of IT during the year was to support business
21
ceO’s report continued
Outlook
The world economic environment will remain challenging
as we do not believe we have seen the last of the Euro
zone debt crisis. Liquidity will in all likelihood continue to be
a challenge and hence it is critical that liquidity management
remains a key area of focus in 2012. Notwithstanding the
above, we believe Africa is the next big economic frontier
and there are huge opportunities in the markets in which we
operate. Business growth in both retail and wholesale
banking has been phenomenal and this lays a strong founda-
tion for the future. Retail banking is expected to start
contributing a greater portion of revenue and profitability
going forward. We are reasonably optimistic that the Group
is well positioned to deliver strong results in 2012 and
beyond.
Acknowledgements
I would like to extend my sincere appreciation to the Board
for its guidance and support, and management together
with all BancABC staff for their support and commitment to
The Big Push effort to achieve our BHAG by 2015. The
2011 instalment is a big investment in our quest to achieve
our goal of being the preferred banking partner in Africa.
After a few years of investing in the Retail expansion, staff
are beginning to reap the rewards of their efforts and
determination in ensuring that our strategy will be achieved.
Douglas T Munatsi
Group Chief Executive Officer
Group Finance is responsible for financial management and
reporting, regulatory reporting, budgeting and Group tax.
A new management information system is in the process
of being deployed, which will help in both the quality and
timeous reporting of all key information.
Group Risk manages all risks that the Group is exposed
to from all its activities. The department has various
committees that identify and manage various types of risks.
The key committees are the Asset and Liability Management
Committee and the Operational Risk Committee. The Legal
and Compliance department is also charged with the day-
to-day management of legal and compliance risks. To this
end, the department developed standardised documents
for wholesale and retail banking. It strengthened structures
in the subsidiaries and established a centralised filing
system for all legal documentation. In addition, the Legal
and Compliance department advised management and the
Board of Directors on various matters including corporate
policiesinlinewiththenewcorporategovernancerecommen-
dations made in the King III Report on corporate governance.
The Group Legal Counsel, who heads this department,
also provides legal services to the Group as required or in
conjunction with external attorneys.
Group Credit monitors the loan portfolio of the Group and
ensures that the Group is not exposed to undue risk from new
business that is underwritten. In addition, it also monitors
existing customers who may be facing financial challenges
that impact on their ability to meet their commitments.
Group Internal Audit plays a key role in maintaining and
improving the internal control environment within the Group.
The Group Head of Internal Audit reports directly to the Risk
and Audit Committee.
ABC Holdings Limited ANNUAL REPORT 201122
The key components of the ESRP are:
•	 	an	assessment	of	potential	and	current	environmental	
and social risks and impact arising out of the proposal;
and
•	 	the	commitment	and	capacity	of	the	borrower	to	manage	
this impact.
Against this background, the procedure ensures that projects
financed by the Group are environmentally and socially sound
and sustainable and that any potential environmental and
social risks are identified, evaluated and where necessary,
mitigated. In line with its policy, the Group will not finance
any business activity that cannot reasonably be expected
to meet the required environmental and social standards
up front.
Projects financed by the Group shall, at the minimum, comply
with the national and/or local legislation and guidelines for
environmental and social assessment and management.
The Bank further conforms to the African Development
Bank’s Environmental and Social Assessment Procedures
(2001).
Management ensures, through training and coaching, that
there is an appropriate internal capacity to handle environ-
mental and social issues. This is supplemented by external
expertise, as the need arises. All the Bank’s employees in
the Operations department are provided with a copy of the
ESRP.
The Group may finance projects for which no specific environ-
mental or social guidelines exist. In such cases, general
environmental and social considerations pertaining to
emissions, liquid effluents, hazardous materials and wastes,
solid wastes, ambient noise, occupational health and safety,
life and fire safety and other hazards are borne in mind during
the appraisal.
BancABC recognises, that sustainable development is
dependent upon a positive interaction between economic
growth, social upliftment and environmental protection.
As a responsible corporate citizen, the Group has a policy
framework that is designed to ensure that all projects
undertaken adhere to social and environmental regulations
of the relevant local, national and international laws and
standards.
This policy framework commits the Group to:
•	 provide	in-house	environmental	education	and	support;
•	 	recognise	the	environmental	burden	caused	by	consump-
tion of resources and release of waste from our own
business activities and aim to protect the environment
through resource recycling as well as efficient use of
energy and resources;
•	 	support	business	activities	that	contribute	to	the	protection	
and improvement of the environment;
•	 	monitor	the	effects	of	our	activities	on	the	environment	
and work towards continuous improvement and pollution
prevention;
•	 	comply	with	all	applicable	laws	and	regulations	related	
to environmental protection and other requirements to
which BancABC Group companies are subject to and
subscribe to; and
•	 	provide	financing	to	projects	with	minimal	adverse	impact	
on the environment while ensuring that those having
potentially major adverse environmental and social impact
are accompanied by adequate mitigation measures.
In order to ensure compliance with the last of these commit-
ments, BancABC’s credit risk assessment seeks to ensure
that the social and environmental effects of its financial
support are assessed and monitored. This Environmental
and Social Review Appraisal Procedure (ESRP) enables
the integration of social and environmental safeguards in
projects, to ensure that the potential risks associated with
these issues are appropriately identified and mitigated.
sOcial anD envirOnMental POlicy
23
Botswana
In Botswana, BancABC Botswana assisted a disabled
wheelchair-bound artist, Ms Apeksha Bijoor to hold her first
public art exhibition at the Maharaja Conference Centre
during October 2011. The bank, the main sponsor of the
event, contributed BWP50,000 towards the event. The art
exhibition was a major success. However, it is with a great
sense of sadness that we report that Ms Bijoor passed away
on 17th January 2012, only a few months after this event.
In December 2011, BancABC Botswana donated 65 wheel-
chairs to His Excellency, The President of the Republic of
Botswana, Lieutenant General Seretse Khama Ian Khama
at the Tlokweng Main Kgotla. On the same day, bank staff
spent the day at the “I Am Special Educational Society” in
Tlokweng together with staff from the President’s Office to
paint the centre and work on the vegetable garden. The bank
contributed BWP200,000 towards these two initiatives.
As an emerging Pan-African financial
institution, BancABC recognises that it
has a responsibility to uplift and play an
active role in the communities in which it
operates by supporting two pillars it has
identified for action, namely:
• Women and Children – by assisting
with the economic upliftment of these
groups, presently the most vulnerable
groups on the African continent.
• Arts and Culture – vibrant arts and
culture are a vital expression of Africa’s
identity and as such, deserve to be
nurtured and celebrated.
We strive to invest in sustainable projects
and, through the involvement of our staff,
actively demonstrate our goodwill and
commitment to enhancing the lives of the
disadvantaged through involvement in
community-based initiatives.
cOrPOrate sOcial
resPOnsiBility
rePOrt
ABC Holdings Limited ANNUAL REPORT 201124
Mozambique
In 2011 a corporate social investment (CSI) committee
was created in Mozambique to identify and contribute
to worthwhile causes, while managing them and
seeing them through to completion. Of the proposals
and requests received in 2011, it was decided to
sponsor the creation of a small library/reading room
at a school for special needs children at one of the
two existing schools for such children in Mozambique.
The classroom selected for the transformation into
a library was painted and refurbished. A computer, a
TV, toys and an array of children’s books were also
purchased for the facility.
25
Corporate Social Responsibility report continued
BancABC Tanzania also donated school
items worth TZS2.5 million to children whose
families were affected by the floods in the
city of Dar es Salaam. The items included
shoes, school uniforms, pens, exercise books,
school bags, compasses and socks.
We will continue to monitor the ongoing
needs of communities and respond where
we can.
Zambia
BancABC Zambia staff identified St. Martin’s orphanage
as a worthy initiative during 2011. The home cares for 29
abandoned children, as well as children of parents who do
not have the capacity to take care of their children due to
a variety of causes. Staff members in our Kitwe Office
contributed money from their thirteenth cheques, a donation
that was matched by management. The contributions were
used to buy an assortment of groceries and shoes for the
orphans.
Tanzania
During 2011, BancABC Tanzania supported
various initiatives, clearly demonstrating its
commitment to Tanzania and its people.
On 4 March 2011, an accidental bomb blast
left hundreds of people in Gongo la Mboto
homeless. To assist with immediate relief
efforts, BancABC Tanzania donated 200
mosquito nets to help victims of the blast.
BancABC Tanzania, participated as a co-
sponsor of the Diplomatic Spouses Group
(DSG) in its main Annual Charity fundraising
bazaar. BancABC was the only bank to
support this event.
ABC Holdings Limited ANNUAL REPORT 201126
BancABC Zambia is also committed to Our Lady’s Hospice
in Kalingalinga, Lusaka. The hospice provides day care, home-
based care and hospital facilities to people suffering from
HIV/AIDS. It also gives support in providing Anti-Retro Viral
treatment to some patients. BancABC Zambia supports the
hospice by providing a monthly donation to assist the lab to
buy necessary supplies.
During the year, BancABC Zambia also supported the Zambia
Judo Association by sponsoring the tracksuits used at
all international events, and the Zambia Cycling Union by
sponsoring their cycling event to support healthy living in
Zambia.
Zimbabwe
BancABC Zimbabwe has invested heavily
in the Harare International Festival of The
Arts (HIFA). The partnership with HIFA
began in 2000 with BancABC sponsoring
the opening day. Since then, HIFA has
become one of the largest festivals of its
type in Africa, attracting international artists
and tourists, and promoting local arts and
culture.
Other CSR initiatives that the bank was
involved in included:
•	 Assisting a 26-year old woman with her
medical costs. Her treatment is currently
on-going and the bank continues to meet
most of the medical expenses.
•	 Assisting the Mutemwa Leprosy and
Care Centre with the restoration of its
electricitysupplyafteritwasdisconnected
due to its inability to meet these costs. A
monthly stipend continues to be made to
cover these costs.
•	 Paid the overdue school fees for the
Fountain of Harare Shelter for Destitutes,
a voluntary organisation that assists
destitute women, orphans and vulnerable
children. It trains women in sewing skills
and pays school fees and buys uniforms
for the children.
•	 Paid a once-off amount to cover the travel
expenses and learning materials for a deaf
woman who had been accepted for tertiary
education at the prestigious National
Institute for the Deaf in Cape Town.
•	 Adopting the Entembeni Old People’s
Home for a year, donating a generator
and providing a monthly donation to cover
the purchase of groceries and fuel.
27
accordance with established risk management policies and
procedures, most of which are discussed in the Financial
Risk Management section.
The Group’s primary risks are outlined below:
Market risk
The Group may be adversely impacted by global markets
and economic conditions that can lead to fluctuations in
interestandexchangerates,aswellasequityandcommodity
prices. It may also be adversely impacted by significant
holdings of financial assets, or significant loans or commit­
ments to extend loans.
Risk management
The directorate and management of ABC Holdings recognise
that effective risk management is fundamental to the sus-
tain­ability of its business. A strong risk management culture
within the Group ensures an appropriate balance between
the diverse risks and rewards inherent in any transaction and
underpins sound decision making. Accordingly, a compre­hen­
sive risk management process is in place to evaluate, monitor
and manage the principal risks the Group assumes in con-­
duc­ting its activities. In the course of conducting its business,
the Group is exposed to various risks inherent in providing
financial services. Some of these risks are managed in
“Group Risk Management continually seeks to enhance
its risk management techniques and provide assurance
that risks are appropriately identified, monitored and controlled.”
risk and governance report
ABC Holdings Limited ANNUAL REPORT 201128
mentactivitiesacrosstheGrouptoensurethatriskparameters
are properly set and adhered to across all risk categories and
in all Group companies. It also ensures that all risk exposures
can be measured and monitored across the Group. Managing
risk effectively is one of the key drivers of the Group’s con­
tinuous investment in technology. Group Risk Management
continually seeks new ways to enhance its risk management
techniques. It also updates the Group Risk Management
Framework on a regular basis to reflect new policies adopted
by the Board of Directors. Group Risk Management regularly
reports to the Executive Committee and the Risk and Audit
Committee, to provide the Board with assurance that risks
are being appropriately identified, managed and controlled.
Group Risk Management is headed by an executive manager
who reports to the Group Chief Executive Officer (CEO).
The Group’s Approach to Risk Management
The Group’s approach to risk management involves a number
of fundamental elements that drive its processes across the
Group. The procedure and methodology is described in Group’s
Enterprise-wide Risk Management Framework. The Group’s
risk appetite sets out the level of risk that the Group is willing
to take in pursuit of its business objectives. This risk appetite
is calibrated against the Group’s broad financial targets in­
cluding profitability and impairment targets, dividend coverage
and capital levels. The Group’s risk methodologies include
systems that enable the Group to measure, aggregate and
report risk for internal and regulatory purposes. As anexample,
the Group’s credit grading models produce internal ratings
through internally-derived estimates of default probabilities.
This is discussed further under the Credit Risk Management
section below. These measurements are used by manage-
ment in an extensive range of activities, from credit grading,
pricing and approval to portfolio management, economic capital
allocation and capital adequacy processes.
Credit risk
The Group may be adversely impacted by an increase in its
credit exposure related to trading, lending and other business
activities. Potential credit related losses can result from an
individual, counterparty or issuer being unable or unwilling to
honour their contractual obligations.
Liquidity risk
The financial condition of the Group may be adversely
impacted by an inability to borrow funds or sell assets to
meet its obligations.
Operational risk
The Group may incur losses due to the failure of its people,
internal processes or systems, or as a result of external
events.
Legal risk
Legal proceedings against the Group or insufficient legal
protection could adversely affect its operating results for a
particular period and impact its credit ratings.
Regulatory and legislative risks
Many of the Group’s businesses are highly regulated and are
subject to, and could be adversely impacted by, regulatory
and legislative initiatives.
Role of Group Risk Management
Group Risk Management is responsible for maintaining a
culture of risk awareness throughout the Group. While each
business unit is primarily responsible for managing its own
risks, Group Risk Management independently monitors,
manages and reports on all risks facing the Group, as man­
dated by the Board of Directors. It coordinates risk manage­
29
The Board has approved the Group risk management frame­
work which applies to all Group companies and deals with
enterprise-wide risk and governance protocol. Risk manage­
ment in the Group is underpinned by governance structures
as well as risk ownership, identification and evaluation.
Ownership and management of risks begin in the business
units of each subsidiary, which identifies and evaluates risks
particular to their function. Group Risk Management reviews
actions taken by business units to mitigate identified risks.
Group Risk Management Objectives
The Group Risk Management function, as mandated by the
Board of Directors is to:
Approach to Risk Management
The Board recognises that it is ultimately responsible and
accountable to shareholders for:
•	 the process of risk management and the systems of
internal control;
•	 identifying, evaluating and managing the significant risks
faced by the Group;
•	 ensuring that effective internal control systems are in
place to mitigate significant risks faced;
•	 ensuring that a documented and tested process is in
place to allow the Group to continue its critical business
in the event of a severe incident impacting its activities;
and
•	 reviewing the efficacy of the internal control system.
Risk and governance report continued
Operational Risk
• Technology
• Operational
•  Compliance 	
• Legal
•  Regulatory 	
• Reputational
Credit
• Credit
Group Internal AuditALCO
•  Interest rate 	
• Liquidity
•  Market 	
• Currency
•  Capital adequacy
BOARD OF DIRECTORS
Ultimately responsible for risk management
Group ALCO Group ORCOManagement Credit
Committee
Specialised committees
of the Board
Responsible for enterprise-wide
risk management across the Group
Group Executive Committee
Responsible for overseeing
day-to-day risk management
across the Group
Audit and Risk
Management
Committee
Board
Credit
Committee
Loans
Review
Committee
ABC Holdings Limited ANNUAL REPORT 201130
•	 Assets and Liability Committee (ALCO) – responsible
for interest rate, market, liquidity, counterparty, currency
and capital adequacy risk; and
•	 Operational Risk Committee (ORCO) – responsible for
technology, compliance, legal, human resources, reputa­
tional, operational and regulatory risk.
Reporting
Each subsidiary or business unit produces risk reports which,
along with the detailed risk information provided by Group
Risk Management, is discussed by the Board. The risk reports
present a balanced assessment of significant risks and the
effectiveness of risk management procedures, and manage­
ment actions in mitigating those risks.
Capital and Liquidity Risk
Management
ALCO reviews the capital status of the Group on a monthly
basis. It also considers the activities of the treasury desk,
which operates in terms of an approved treasury manage­
ment policy and in line with approved limits.
ALCO reports to the Risk and Audit Committee in terms of
the Group Risk Management Framework. Capital adequacy
•	 Coordinate risk management activities across the organi­
sation, by ultimately becoming the custodian of BancABC’s
risk management culture.
•	 Analyse, monitor and manage all aspects of exposures
across risk classes.
•	 Ensure risk parameters and limits are set, approved and
implemented and ensure that such risk parameters and
limits are consistently adhered to.
•	 Facilitate various risk management committees as part
of the Group’s risk management process.
Group Risk Management Framework
The Group Risk Management Framework documents the
risk management policies followed by the Group. These
policies ensure that risks are consistently managed through­
out the Group through a set of internal controls. The policies
also ensure that risk awareness filters down through every
level of the Group, and that every employee understands
their responsibility in managing risk. The following sub-
commit­tees,comprisingexecutivesandseniormanagement,
are responsible for dealing with the risks facing the Group in
a structured manner:
•	 Management Credit Committee (CREDCO) – responsible
for credit risk;
LIQUIDITY RISK MANAGEMENT STRUCTURE
Short-term liquidity risk management
Liquidity risk management committee
•  Managing intra-day liquidity
•  Managing short-term cash flows
•  Managing interbank and repo levels
Contingency liquidity risk management
•  Establish and manage contingency funding plan
•  Convene liquidity crisis management committee
•  Assess regular liquidity stress testing and scenario analyses
ALCO
•  Managing long-term cash flows
•  Identify and manage mismatches
•  Establish liquidity risk appetite
Long-term liquidity risk management
31
Liquidity risk is broadly managed by ALCO in terms of the
Group risk management framework. A liquidity risk com­
mittee meets on a weekly basis to access and manage the
overall liquidity of the Group. The Group approaches liquidity
cautiously and conservatively by managing the liquidity profile
with a preference for long-term, fixed rate funding. As such,
the Group is exposed to funding liquidity risk.
ALCO reviews a stress mismatch report monthly, which
simulates stress scenarios based on the current asset and
liability structure of the Group for the reporting month. The
report also considers the available sources of stress funding
to address any potential strain on the cash flows of the Group.
In addition, the Group has a documented contingency funding
plan (CFP) that specifies measures that must be monitored
to identify indications of liquidity stress early. The plan provides
management with a set of possible actions to address poten­
tial liquidity threats. The CFP operates in conjunction with the
finance and treasury management policy and the assets and
liabilities management (ALM) policy to ensure a coordinated
approach to liquidity management.
As part of its monthly meetings, ALCO considers the Group’s
sensitivity to interest rate movements and reviews the results
of management’s analysis of the impact of interest rate
move­ments. ALCO also receives information on yield curve
developments and money market interest rates, as well as
analysis of the potential economic impact on interest rates
and interest rate re-pricing. The Group strives to match asset
and liability re-pricing positions as far as possible.
There has been a refinement of the capital management
framework, incorporating all the best practices in risk manage­
ment since the financial crisis happened. Implementation of
the international accord on revised risk-based capital rules
known as “Basel II” continues to progress. Our Capital
manage­ment framework is for the most part guided by
Basel II. In theory, Basel II attempts to accomplish this
by setting up risk and capital management requirements
designed to ensure that a bank has adequate capital for the
risk the bank exposes itself to through its lending and invest­
ment practices. Generally speaking, these rules mean that
the greater risk to which the bank is exposed, the greater the
amount of capital the bank needs to hold to safeguard its
solvency and overall economic stability.
and the use of regulatory capital are reported periodically to
the central banks of the Group’s operating countries, in line
with respective regulatory requirements. ALCO comprises
broadly representative executive and senior managers in­clud­
­ing the Group CEO, Chief Operating Officer, Chief Financial
Officer, Chief Risk Officer, Group Head of Corporate Banking,
Group Head of Treasury, Group Head of Retail Banking and
Country Managing directors.
Liquidity is of critical importance to financial institutions as
has been recently reminded by the recent failures of global
financial institutions, in large partly due to insufficient liquidity.
Our markets present larger challenges primarily due to an
under-developed secondary securities market and illiquid
government securities. As such, the bank has in place a
com­prehensive liquidity and funding policy to address both
firm-specific and market-wide liquidity events. Our primary
objective is to be able to fund the bank and to enable our
core businesses to continue to operate and meet their
obligations under adverse circumstances.
We have established liquidity guidelines that are intended to
ensure that we have sufficient asset-based liquidity to with­
stand the potential impact of deposit attrition or diminished
liquidity in the funding markets. Our guidelines include main­
taining an adequate liquidity reserve to cover our potential
funding requirements and diversified funding sources to avoid
over-dependence on volatile, less reliable funding markets.
We seek to manage liquidity risk according to the following
principles;
•	 Excess liquidity – We seek to maintain excess liquidity to
meet a broad and comprehensive range of potential cash
outflows and collateral needs in a stressed environment.
•	 Asset-Liability Management – Through ALCO, we assess
anticipated holding periods for our assets and their poten­
tial illiquidity in a stressed environment. We manage
maturity mismatches and level of funding diversification
across markets, products and counter-parties and seek
to maintain liabilities of appropriate tenor relative to our
asset base.
•	 Contingency Funding Plan – We seek to maintain a con­
tingency funding plan to provide a framework for analysing
and responding to a liquidity crisis situation or periods of
market stress. The framework sets the plan of action to
fund normal business activity in emergency and stress
situations.
Risk and governance report continued
ABC Holdings Limited ANNUAL REPORT 201132
BancABC rating scale
BancABC
defaults rates
BancABC
retail score
Standard 
Poor’s ratings Grade quality
A+ 0.10% 246 – 255 AAA – AA
Investment
Grade
A 0.25% 236 – 245 AA+
A- 0.33% 226 – 235 AA
B+ 0.40% 216 – 225 AA-
B 0.50% 201 – 215 A+
B- 0.66% 191 – 200 A
C+ 0.80% 181 – 190 A-
C 0.96% 166 – 180 BBB+
C- 1.30% 156 – 165 BBB
D+ 1.80% 146 – 155 BBB-
D 2.65% 136 – 145 BB+
Sub-investment
Grade
D- 3.80% 126 – 135 BB
E+ 7.85% 116 – 125 BB-
E 12.90% 106 – 115 B+
E- 16.88% 96 – 105 B
F+ 26.00% 86 – 95 B-
F 38.67% 76 – 85 CCC+
F- 45.00% 61 – 75 CCC
G Default 0 – 60 CCC- Default
Credit Risk Management
Independent credit risk committees in each of the Group’s operating countries are responsible for managing, measuring and
mitigating credit risk. Credit risk management is overseen by the Group Credit Committee (CREDCO), a management committee
that reports to the Board Credit Committee. There is a high level of executive involvement in the credit decision making team. The
Group CREDCO includes the Chief Executive Officer, Chief Operating Officer, Chief Financial Officer, Chief Risk Officer, Chief
Credit Officer and the Managing Director of BancABC Zimbabwe.
The Group’s policy is that all sanctioning members of the CREDCO have voting powers. At Group CREDCO level, all decisions to
enter a transaction are based on unanimous consent.
The CREDCO formally meets on a weekly basis to consider the activities and operations of the credit division, to consider and
debate results from new business, arrears and provisioning analyses, as well as to consider regulatory compliance and to set and
amend credit policy where appropriate.
Approach to Measuring Credit Risk
The Group’s approach to measuring credit risk aims to align with international best practice and is, in all substantial aspects, aligned
with the standard approach and methodology employed by international financial institutions. Credit risk is broken down into the
common risk components of probability of default (PD), Exposure at Default (EAD) and Loss Given Default (LGD), modelled at a
client, facility and portfolio level. These risk components are used in the calculation of a number of aggregate risk measures such
as Expected Loss (EL). The models used by the Group are aimed to be compliant with Basel II and regulatory requirements.
BancABC default probability table below shows the mapping of the corporate rating to retail credit scoring to align credit risk
appetite assessment and tolerance across consumer and corporate businesses.
33
general impairments raised. Any situations in which general
impairments are insufficient to cover total EL in totality have
a direct bearing on the Group’s capital requirement to ensure
that these potential losses can be absorbed.
Operational Risk Management
Operational risk is defined as the risk of loss resulting from
inadequate or failed internal processes, people and systems
or from external events. Such operational risks may include
exposure to theft and fraud, improper business practices,
client suitability and servicing risks, unauthorised trans­actions,
product complexity and pricing risk or from improper recording,
evaluating or accounting of transactions. The Group could
suffer financial loss, disruption to its business, liability to
clients, regulatory intervention or reputational damage from
such events, which could affect its business and financial
condition.
Managing operational risk requires timely and reliable as well
as a strong control culture. We seek to manage our operational
risk through:
•	 active participation of all business units in identifying and
mitigating key operational risks across the Group;
•	 the training and development of the banks employees;
•	 independent control and support functions that monitor
operational risk periodically; and
•	 a network of systems and tools throughout the bank to
facilitate the collection of data used to analyse and assess
our operational risk exposure.
Operational risk is managed by ORCO in terms of the Group’s
Operational Risk Framework (ORF), a subset of the Group
Risk Management Framework. ORCO comprises executive
and senior managers including the Chief Operating Officer,
Chief Risk Officer, Chief Information Officer, Group Head of
Retail Banking, Group Head of Market and Operational Risk,
Group Head of Banking Operations, Group Chief Legal Counsel
and Group Head of Human Capital.
Our operational risk framework is in part designed to comply
with operational risk measurement and assessment rules
under Basel II. The Group’s operational risk management
processes focus primarily on risk assessment, loss data col­lec­
tion and the tracking of key risk indicators. The results of these
processes are used to raise awareness of operational risk
man­agement and to enhance the internal control environ­
ment, with the ultimate aim of reducing losses.
Risk and governance report continued
BancABC default probabilities for each rating buckets are
much more conservative, i.e., for the same rating BancABC
implies a much higher likelihood of defaults than the cor­re­
sponding Standard  Pour’s. The definition of default and the
use of PD is standard as prescribed by the Basel II framework
and regulation.
Probability of Default (PD)
The PD measures the likelihood of a client defaulting on its
obligations within the next twelve months and is a primary
component of the internal risk rating calculated for all clients.
Exposure at Default (EAD)
In general EAD can be defined as an estimation of the extent
to which a bank may be exposed to a counterparty in the
event of a counterparty’s default within a one-year period.
The Group calculates EAD estimates for each facility through
models developed and based on internal and external default
data as well as credit experts’ experience with particular
products or client groups. EAD estimates incorporate both
on- and off-balance sheet exposures resulting in a capital
requirement that incorporates existing exposures, as well as
exposures that are contingent on a counterparty’s use of an
available facility.
Loss Given Default (LGD)
The third major risk component measures the loss expected
on a particular facility in the event of default and thus recog­
nises any credit risk mitigants employed by the bank, such
ascollateral,thirdpartyguarantees,creditderivativeprotection
or other credit hedges. LGD estimates are calculated through
internally developed models, as well as a broad base of expert
judgment from credit representatives and the results are
primarily driven by the type and amount of collateral held.
Expected Loss and Capital requirements
The three components, PD, EAD and LGD, are building blocks
used in a variety of measures of risk across the entire port­
folio. EL is the measurement of loss, which enables the
application of consistent credit risk measurement across all
retail and wholesale credit exposures. LGD, EAD and PD
estimates are also used in a range of business applications,
including pricing, customer and portfolio strategy and perfor­
mance measurement. EL estimates can be compared directly
to portfolio impairment figures within the regulatory capital
calculation to ensure that the organisation’s estimates of EL
from doing business are sufficiently covered by the level of
ABC Holdings Limited ANNUAL REPORT 201134
made substantial commitment through development of tools
and systems to establish stress testing capabilities as a core
business process.
Compliance Risk Management
Compliance risk is the risk of non-compliance with all relevant
regulatory statutes, central bank supervisory requirements
and industry codes of practice. The compliance function
is an integral part of the overall Group Risk Management
function. A decentralised compliance function has been
im­ple­mented within business units and subsidiaries, and
compliance officers have been appointed in each operating
entity.
Compliance risk is effectively managed through developing
and implementing compliance processes, developing effective
policies and procedures affecting the respective regulatory
frameworks, and providing advice and training on the con­
stantly changing regulatory environment. A key role of com­
pliance officers in the Group is to develop and maintain sound
working relationships with its various regulators in the Group’s
operating countries.
Legal risk management
The Group Chief Legal Counsel is responsible for ensuring
that legal risk is adequately managed. This is achieved through
Legal and compliance risks are dealt with by ORCO, with the
Group Chief Legal Counsel being a member of ORCO.
Stress Testing
As a part of our core risk management practices, we conduct
enterprise-wide stress tests on a periodic basis to better
understand earnings, capital and liquidity sensitivities to
certain economic and business scenarios, including economic
and market conditions that are more severe than anticipated.
These enterprise-wide stress tests provide an under-standing
of the potential impacts from our risk profile to earnings,
capital and liquidity, and serve as a key component of our
capital management practices. Scenarios are selected by
senior management. Impacts to each line of business from
each scenario are then determined and analysed, primarily
leveraging the models and processes utilised in everyday
management routines.
Impacts are assessed along with potential mitigating actions
that may be taken. Analysis from such stress scenarios is
compiled for and reviewed through our weekly Liquidity Risk
Management Committee, Asset Liability Market Risk Com-
mit­­tee, Executive Management Committee and the Board’s
Risk and Audit Committee, and serves to inform and be
incorporated, along with other core business processes, into
decision-making by management and the Board. We have
35
Risk and governance report continued
Board of Directors
The Board currently comprises nine directors, including four
independent non-executive directors, two non-executive
directors and three executive directors. This balanced repre­
sen­tation ensures that no one individual or small group can
dominate decision making. The depth of experience and
diversity of the Board ensures that robust and forthright
debate on all issues of material importance to the Group can
take place. Profiles of directors appear on pages 40 to 41 of
this report.
The roles of Chairman and CEO are separate and no indivi­
dualhasunfetteredcontroloverdecisionmaking.TheChairman
is a non-executive director appointed by the Board.
The Board is responsible to shareholders for setting the
strategic direction of the Group, monitoring operational perfor­
mance and management, risk management processes and
policies, compliance and setting authority levels, as well as
selecting new directors. The Board is also responsible for
the integrity and quality of communication with stakeholders,
including employees, regulators and shareholders.
The Board has adopted a risk management framework
and has delegated responsibility for risk to the Risk and
Audit Committee. This committee reviews risk management
processes in the Group and ensures that Board policies and
decisions on risk are properly implemented. The committee
assessestheadequacyandeffectivenessofriskmanagement
structures in the Group and reports to the Board on all risk
related governance issues.
All directors have direct access to information on the Group’s
affairs, as well as the advice and services of the Group Chief
Legal Counsel. A formal Board charter has been adopted
which sets out the roles, responsibilities and procedures of
the Board.
Individual country operations have their own boards, with
external representation and function as per the requirements
of their respective jurisdictions.
The Board meets at least four times annually. Additional
telephonic meetings are also conducted during the year. The
CEO and senior executives are available to brief directors
when required.
standard approved legal documentation wherever possible.
However, specialised external legal advisers are used when
required for non-standard transactions. The Group Chief Legal
Counsel ensures that only approved legal advisers provide
legal opinions or draw up specialised agreements for the
Group.
Group Internal Audit
The primary function of internal audit is to give objective
assurancetotheBoardthatadequatemanagementprocesses
are in place to identify and monitor risks, and that effective
internal controls are in place to manage those risks. Group
Internal Audit independently audits and evaluates the effective­
ness of the Group’s risk management, internal controls and
governance processes.
Internal audit operates under terms of reference approved
by the Risk and Audit Committee. The terms of reference
define the role and objectives, authority and responsibility of
the audit function. The Group’s reporting structures ensure
that the Group Internal Auditor has unrestricted access
to the Chairman of the Risk and Audit Committee and the
Group CEO.
At the outset of each financial year, Group Internal Audit
carries out a risk assessment for all business units and
subsidiaries. A comprehensive audit plan for the year that
identifies specific areas of focus is then derived from this
assessment. The audit plan is reviewed regularly and any
changes must be approved by the Risk and Audit Committee.
The areas of focus are confirmed with executive manage­
mentbeforebeingsubmittedtotheRiskandAuditCommittee
for approval.
Corporate governance
The Group is committed to the principles of openness,
integrity and accountability. In February 2003, the Board
endorsed the adoption of the second King Report on
Corporate Governance (King II). Since 2010 the board has
incorporated some of the principles of King III and specifically
has adopted a combined assurance model of reporting by
the internal auditors, the risk officers and external auditors
to its audit committee in order to promote a coordinated
approach to all assurance reporting on the risk areas of the
business.
ABC Holdings Limited ANNUAL REPORT 201136
Risk and Audit Committee
The Risk and Audit Committee is chaired by Mr N Kudenga
who is an independent non-executive director. The committee
adopted the terms of reference for both the Risk Committee
and Audit Committee as detailed in the King Reports on
Corporate Governance. In particular, it assists the Board in
the discharge of its duties relating to financial reporting to all
stakeholders,compliance,riskmanagementandtheeffective­
ness of accounting and management information systems.
Meetings are held regularly throughout the year and are
attended by external and internal auditors, as well as senior
executive managers. The committee met four times in 2011.
Issues addressed included reviewing accounting policies,
implementing Basel II, disposing of certain Group assets,
capital raising initiatives, the internal audit ratings policy, IT
connectivity issues, business continuity planning, financial
reporting, operational risks, capital adequacy and compliance,
among others.
The committee considered whether the Company and the
Group are going concerns, recommending that the Board
endorse a statement to this effect and that the financial
statements prepared on this basis be approved.
Loans Review Committee
The Loans Review Committee comprises two non-executive
directors and is chaired by Mrs D Khama. In accordance with
its terms of reference, the committee’s principal function
is to review and report to the Board on the Group’s loan
port­folio at least quarterly. The committee places specific
emphasis on ensuring conformity of the loan portfolio and
lending function to a sound documented lending policy. It
also periodically reviews the maximum loan authority limits
for each Group lending authority as well as write-offs within
the Group. The committee is further tasked with the quarterly
review of the adequacy of provisions made with respect
to loans and makes recommendations to the Board in this
regard.
The committee met four times in 2011 and issues addressed
included the review of Group and country credit policies and
guidelines to ensure that these meet best international banking
practice, as well as the delinquent loan recovery strategy and
adequacy of Group provisions.
Four Board meetings were conducted during the year.
Directors’ attendance of these meetings was as follows:
Director March June Aug Dec
Buttery P P P P
Khama P P P P
Kudenga P P P P
Munatsi P P P P
Wasmus P P P P
Ipe P P * *
Shyam-Sunder P P P P
Moyo P P P P
Dzanya P P P P
Schneiders n/a n/a n/a P
P: Present
A: Absent
*: Resigned
Board committees
The Board is assisted in discharging its responsibilities by a
number of sub-committees. Sub-committees are accountable
to the Board, with minutes of sub-committee meetings circu­
lated and reported on at the following Board meeting. Senior
executives are invited to attend meetings as appropriate.
Board committees may make use of external professional
advisers when necessary to discharge specific tasks.
Executive Committee
The Executive Committee (EXCO) assists the CEO in man­
aging the Group and implementing strategy, policies and
procedures, subject to the Board’s limitations on delegation
to the CEO. The CEO’s authority in managing the Group is
unrestricted. EXCO assists the CEO in managing the Group
and setting the overall direction of the business of the Group,
and acts as a medium for communication and coordination
between business units and Group companies, and the Board.
EXCO meetings are conducted monthly.
The following divisional and functional heads comprise EXCO:
CEO (Chairman), Chief Operating Officer, Chief Financial
Officer, Chief Risk Officer and the Managing Director of
BancABC Zimbabwe.
EXCO also considers non-remuneration aspects of human
resources management such as succession planning and
skills development.
37
Health and safety policy
The Group seeks to ensure that it engages in activities which
do not jeopardise the health and safety of its employees,
taking into account the industrial sectors concerned. The
Group encourages the businesses it supports to adopt
appropriate health and safety measures and to comply,
withinareasonableperiod,withlocallegislativerequirements
concerning occupational health and safety.
Environmental policy
The Group’s directorate and management recognise that
sustainable development depends on a positive balance
between economic development and environmental pro­
tection. The Group believes that conserving the global
environment is the responsibility of every individual, and as a
good corporate citizen it strives to fulfil its responsibility to
society by working towards realising a sustainable environ­
ment. Accordingly, the Group will endeavour to pursue best
practice in environmental management and will put in place
guidelines and procedures to ensure that projects are under­
taken in accordance with the relevant local, national and
international standards with regard to environmental and
social regulations.
Risk and governance report continued
Credit Committee
The committee was established in 2010. It is chaired by
Mr Buttery and has a mandate to approve loans above the
internal management limit of US$7 million. The committee
meets when required to approve loans.
Remuneration Committee
The Remuneration Committee is chaired by Mr H Buttery, a
non-executive director and Chairman of the Board. The CEO
attends committee meetings by invitation, but does not
participate in any discussions on his own remuneration. The
committee is responsible for the senior executive remune­
ration policy. It fixes the remuneration packages of individual
directors within agreed terms of reference, to avoid potential
conflicts of interest.
The Remuneration Committee is also responsible for setting
the remuneration policy of the Group. It aims to ensure that
the financial rewards offered by the Group to employees are
sufficient to attract people of the calibre required for effective
running of the Group and to produce the required returns to
its shareholders. The committee reviews the profit sharing
scheme annually, which is based on achieving a specified
return on equity for the period. The committee met four
times during the year under review.
Nominations Committee
The Nominations Committee comprises two non-executive
directors and is responsible for making recommendations to
the Board on all new board appointments. A formal process
is in place in terms of which the skills needed are identified
and those individuals who might best assist the Board in
their endeavours are recruited.
Dealing on stock exchanges
As part of its commitment to conducting business in a pro­
fessional and ethical manner at all times, the Group follows
strict guidelines with respect to dealing of its shares on
stock exchanges by employees and directors. A policy is in
place prohibiting directors and employees in dealing in the
Group’s shares when they are in possession of price sensitive
information, which may generally not be available to the
public. Dealing in ABCH shares is further restricted during
defined periods, generally six weeks prior to the publication
of the interim and final results.
ABC Holdings Limited ANNUAL REPORT 201138
ABC Holdings Limited
Board of Directors
*Non-executive
**Independent non-executive
•	 Howard J Buttery**
•	 Doreen Khama**
•	 Ngoni Kudenga**
•	 Mark Schneiders*
•	 Johannes Wasmus**
•	 Lakshmi Shyam-Sunder*
•	 Douglas T Munatsi
•	 Bekithemba Moyo
•	 Francis Dzanya
Chairman
Group Chief Executive Officer
Remuneration Committee •	 Howard J Buttery
•	 Ngoni Kudenga
Chairman
Loans Review Committee •	 Doreen Khama
•	 Lakshmi Shyam-Sunder
Chairperson
Credit Committee •	 Howard J Buttery
•	 Johannes Wasmus
•	 Douglas T Munatsi
Chairman
Nominations Committee •	 Howard J Buttery
•	 Ngoni Kudenga
Chairman
Risk and Audit Committee •	 Ngoni Kudenga
•	 Johannes Wasmus
•	 Lakshmi Shyam-Sunder
Chairman
Executive Committee •	 Douglas T Munatsi
•	 Francis Dzanya
•	 Beki Moyo
•	 Hashmon Matemera
•	 Dr Blessing Mudavanhu
Chairman
Group Management •	 Nagarajan Santhanam
•	 Bruce Jonker
•	 Cornelius Munyurwa
•	 Leah Banda
•	 Andrea Prazakova
•	 Johan Testa
•	 Melanie Vogt
•	 Paul Westraadt
•	 Andre Willemse
•	 Wallace Siakachoma
•	 Dana Botha
Chief Information Officer
Group Internal Auditor
Group Head Banking Operations
Group Head Marketing
Group Head Retail Banking
Group Head Treasury
Chief Legal Officer and
Secretary to the Board
Chief Credit Officer
Group Head Human Capital
Group Finance Executive
Group Head of Corporate Banking
directors and group management
39
1
	 Howard J Buttery
(South African)
Board Chairman
Non-Executive Director
Howard Buttery was born in South Africa in 1946. He has
served as a director since 2003 and on the Remuneration
and Nominations Committee. Howard was appointed
non-executiveChairmanofABCHoldingsLimited(BancABC)
in June 2010.
He recently retired from the position of Executive Chairman
of Bell Equipment Ltd, a listed South African company.
His current focus is on developing a strategic alliance of
three international companies: John Deer (United States),
Liebher (Germany) and Hitachi (Japan).
Howard has extensive knowledge of business across the
African continent offering key in-sight to the organisation.
He holds a certificate in theory of accounting from the
University of Natal.
4
	 Doreen Khama
(Motswana)
Board Member
Non-Executive Director
Doreen Khama was born in Botswana in 1949. Doreen has
been a director since 2007 and a member of our Loans
Review Committee. She is founder and senior partner of
the law firm Doreen Khama Attorneys, a reputable legal
firm in operation for over 20 years. She is also the Honorary
Consul for Austria in Botswana.
Doreen is active in business initiatives in Africa and inter­
nationally, and has earned a high standing of professional
prominence through her international affiliations.
She serves as a director and board member for several
organisations across various industries, including Botswana
Savings Bank, Lengao Holdings and PEP Holdings.
Doreen holds a Bachelor’s Degree in Law from the Uni­ver­
sity of Botswana, Lesotho and Swaziland.
3
	 Dr Lakshmi Shyam-Sunder
(American) 	
Board Member
Non-Executive Director
Lakshmi Shyam-Sunder was born in America in 1956.
Lakshmi is CFO and Director, Finance and Risk Multilateral
Investment Guarantee Agency at the World Bank Group.
She has wide-ranging financial experience, which includes
a period on the Finance Faculty of the MIT Sloan School
of Management in the USA and at the Tuck School of
Business Administration, Dartmouth College.
She joined the IFC in 1994 and prior to being appointed
a Director held a number of positions within the institution
working in treasury and portfolio management before being
named Director of Risk Management and Financial Policy
for IFC.
Lakshmi holds a Ph.D in Finance from the MIT Sloan School
of Management and an MBA from the Indian Institute of
Management, Ahmedabad, India.
2
	 Douglas T Munatsi
(Zimbabwean)
Group Chief Executive Officer
Board Member
Douglas “Doug” Munatsi was born in Zimbabwe in 1962.
He has been the CEO of BancABC since its formation in
2000 and was Managing Director of its predecessors, First
Merchant Bank and Heritage Investment Bank (Heritage).
Doug founded Heritage in 1995. He later successfully
negotiated Heritage’s merger with First Merchant Bank
Ltd, then controlled by Anglo American Corporation.
Prior to setting up Heritage, he was an executive with the
International Finance Corporation (IFC), the private sector
arm of the World Bank.
Doug holds a Bachelor of Business Studies degree from
the University of Zimbabwe, a Master of Business Admini­
stration (Finance) from the American University, Washington
DC and completed the Harvard Business School’s Advanced
Management Programme.
Directors and Group management continued
ABC Holdings Limited ANNUAL REPORT 201140
6
	Johannes Wasmus
(Dutch)
Board Member
Non-Executive Director
Hans Wasmus was born in Holland in 1941. Hans has been
a director since 2003, and has served as Chairman of the
Loans Review Committee. He currently is a member of the
Risk and Audit Committee.
Hans previously served as Chief Financial Officer and
Regional Manager for Africa at FMO, a Netherlands-
based development finance institution.
He holds a Diploma in Accountancy from the Netherlands
Institute for Chartered Accountants and a Diploma in
Economics.
8
Francis Dzanya
(Zimbabwean) 	
Group Chief Operating Officer
Board Member
Francis Dzanya was born in Zimbabwe in 1960. Mr Dzanya
has been Chief Operating Officer since April 2008 and
Chief Banking Officer before that. He has also been a
member of the Executive Committee since 2006.
Francis joined Heritage at its formation in 1995 having
spent over ten years with other banking institutions in the
region.
Francis holds a Bachelor of Arts (Honours) degree in Banking,
Insurance and Finance from Sheffield Hallam University in
the United Kingdom (UK) and a Higher National Diploma in
Banking and Finance from John Moores University, also in
the UK and is an Associate of the Chartered Institute of
Bankers, UK.
9
	Beki Moyo
(Zimbabwean)
Group Chief Financial Officer
Board Member
Beki Moyo was born in Zimbabwe in 1967.
Mr Moyo has been the Chief Financial
Officer since 2005. In the course of his
banking career spanning over fifteen years,
Beki has held various senior positions
within ABC Holdings.
Beki trained and qualified as a Chartered
Accountant with Deloitte and Touché and
quickly rose to Audit Manager. He then
joined the banking world in 1994 as Chief
Accountant at Stanbic Zimbabwe.
He holds a Bachelor of Accountancy
(Honours) degree from the University of
Zimbabwe, a Master of Business Admini­
stration degree in Banking and Finance
from Manchester University and com­ple­
tedtheHarvardBusinessSchool’sAdvanced
Management Programme.
7
	Mark M Schneiders
(Dutch)
Board Member
Mark Schneiders was born in The Nether­
lands in 1956. Mark has more than 27 years
of banking sector experience in various
wholesale and private banks within Africa
and around the globe serving as an entre­
preneurial finance professional. He has held
various positions that include Managing
Director with ING Financial Institutions in
Amsterdam.
Mark has extensive experience with com­
pany mergers, building new markets and
setting up retail banking businesses in a
variety of countries including Switzerland,
TheNetherlands,Spain,Curaçao,Argentina,
Venezuela, Hong Kong and USA. He was
appointed to the Board on 9th December
2011.
Mark holds a Bachelor’s and Master’s degree
in law from the University of Leiden, The
Netherlands, and completed the Advanced
Management Program at Harvard Business
School and various banking management
programs at INSEAD (Cedep).
5
	 Ngoni Kudenga
(Zimbabwean) 	
Board Member
Non-Executive Director
Ngoni Kudenga was born in Zimbabwe
in 1952. Mr Kudenga has been a director
since 2000, chairman of the Risk and Audit
Committee since 2000, a member of the
Remuneration and Nominations Commit­
tees since 2007.
He is currently the Managing Partner of
BDO Zimbabwe (Chartered Accountants)
and serves on the boards of listed com­pa­
nies Bindura Nickel Corporation and Hippo
Valley Estates, Anglo American Corporation
Zimbabwe and several other private com­
panies.
Ngoni is past president of the Institute
of Chartered Accountants in Zimbabwe
and a fellow of the Chartered Institute of
Management Accountants in the United
Kingdom.
He holds a Bachelor of Accountancy degree
from the University of Zimbabwe.
41
executive management committee
2
Dr Blessing Mudavanhu
(Zimbabwean)
Group Chief Risk Officer
Blessing Mudavanhu was born in Zimbabwe
in 1971. Dr Mudavanhu was appointed
Group Risk Officer in February 2009.
Blessing spent many years working on Wall
Street in New York, where most recently he
was a director in Global Risk Management
at Bank of America Merrill Lynch.
He has published many research papers
in the Journal of Investment Manage-
ment and in many mathematics journals.
He is also listed in the Who’s Who in
America and is a recipient of the Fulbright
Scholarship.
He holds a Bachelor of Science (Honours)
degree in Mathematics from the University
of Zimbabwe, a Master of Science degree
and a Doctorate in Mathematics from the
University of Washington as well as a
Master of Science in Financial Engineering
from the Hass School of Business, University
of California at Berkeley.
Directors and Group management continued
1
	 Hashmon Matemera
(Zimbabwean)
Managing Director
BancABC Zimbabwe
Hashmon Matemera was born in Zim­babwe
in 1964. Hashmon has been a member of
the Executive Committee since 2006. He
was the Group Head of Whole­sale Banking
from 2007 before becoming Managing
Director of BancABC Zim­babwe in 2011.
Mr Matemera has over 17 years banking
experience in merchant and commercial
banking and as a central banker. He has held
several positions including Executive Director
of Banking Services at BancABC Zimbabwe
and Group Head of Treasury and Structured
Finance. Hashmon spent ten years at the
Reserve Bank of Zim­babwe, mostly in the
Supervision and Surveillance Division.
Hashmon holds a Bachelor of Science
(Honours) degree in Economics as well as a
Master of Science in Economics both from
the University of Zimbabwe.
3
	 Douglas T Munatsi
(Zimbabwean)
Group Chief Executive Officer
4
	Beki Moyo
(Zimbabwean)
Group Chief Financial Officer
5
Francis Dzanya
(Zimbabwean)
Group Chief Operating Officer
ABC Holdings Limited ANNUAL REPORT 201142
ResponsiBility foR the annual
finanCial statements
The directors are responsible for the preparation, integrity
and objectivity of the financial statements that fairly present
the state of the affairs of the Group at the end of the financial
year and the net income and cash flow for the year, and
other information contained in this annual report.
To enable the directors to meet these responsibilities:
•	 	the	Board	and	management	set	standards	and	manage	­
ment implements systems of internal control and
accounting and information systems aimed at providing
reasonable assurance that assets are safeguarded and
the risk of error, fraud or loss is reduced in a cost effective
manner	–	these	controls,	contained	in	established	policies	
and procedures, include the proper delegation of responsi­
bilities and authorities, effective accounting procedures
and adequate segregation of duties;
•	 	the	Group’s	internal	audit	function,	which	operates	inde­
pendently from operational management and has un­
restricted access to the Group Audit and Risk Committee,
appraises, evaluates and, when necessary, recommends
improvements in the systems of internal control and
accounting practices, based on audit plans that take
cognisance of the relative degrees of risk of each function
and internal control, accounting policies, reporting and
disclosure; and
•	 	the	Group	Audit	and	Risk	Committee	plays	an	integral	
role in matters relating to financial and internal control,
accounting policies, reporting and disclosure.
The annual financial statements have been prepared in
accordance with the provisions of the Botswana Companies
Act, the Botswana Stock Exchange Regulations and Inter­
national Financial Reporting Standards relating to companies
and banks. The directors have no reason to believe that the
Group or any subsidiary company within the Group will not
be going concerns in the year ahead, based on the forecasts
and available cash resource. These financial statements have
accordingly been prepared on that basis.
It is the responsibility of the independent auditors to report
on financial statements. Their report to the members of the
Company is set out on page 48 of this annual report.
appRoval of the annual
finanCial statements
The directors’ report and the annual financial statements,
which appear on pages 49 to 147, were approved by the
Board of directors on 22 March 2012 and are signed by:
H Buttery D T Munatsi
Chairman Group Chief Executive Officer
27 March 2012
directors’ responsiBiLitY
H Buttery D T Munatsi
43
Nature of business
ABC Holdings Limited is listed on the Botswana and Zimbabwe
Stock exchanges and is the holding company of the African
Banking Corporation group of companies (trading under the
brand name BancABC) which comprise diverse financial
services activities in the areas of corporate banking, treasury
services, Retail and SME Banking, asset management, and
stockbroking among other banking services. African Banking
Corporation aims to deliver world-class financial solutions to
the Sub-Saharan African region.
Authorised share capital
There was no change in the authorised or issued share capital
of the Company during the year.
Group results
The Group posted a strong set of results for the period with
all the banking subsidiaries, with the exception of Tanzania,
reporting excellent results. Attributable profit at BWP83 million,
is 24% higher than the BWP67 million achieved in the previous
year. The profitability achieved was despite the Group’s on­
going massive investment in the Retail Banking business,
which continued in the midst of mixed economic conditions
that were a dominant characteristic of the banking sector
during the reporting period. The Group balance sheet increased
by 53% from BWP6 billion to BWP9.2 billion. Loans and
advances were up almost two fold from BWP3.1 billion to
BWP6.1 billion. This was largely funded by deposits that
increased by 50% from BWP4.9 billion to BWP7.4 billion. All
major lines of business recorded significant growth during
the year. The Group now has 49 Retail branches including
con­sumer lending branches, up significantly from 31 retail
branches in 2010. Rapid expansion of retail banking operations
continued, with BWP177 million being spent on essential
hardware and software during the last 24 months. As was to
be expected, staff numbers continued to grow. By the end
of the reporting year staff numbers, including temporary and
contract workers, stood at 1,008, compared to 668 at the
end of December 2010.
The financial statements have been prepared in accordance
with International Financial Reporting Standards and the
accounting policies of the Group, which are considered by
the directors to be appropriate. Accounting policies have
been applied in a manner consistent with that in the previous
financial year and details of significant accounting policies
can be found on pages 49 to 63.
Subsidiary and associated
companies
Details of the Group’s subsidiaries are set out in note 15 of
the separate Company financial statements. Details of the
Groupassociatecompaniesareinnote13oftheconsolidated
Group financial statements.
Acquisitions and disposals
There were no acquisitions or disposals of subsidiaries during
the year.
Directors’ interests in the
shares of ABC Holdings Limited
The following table depicts the interests of directors in the
shares of ABC Holdings Limited:
Number of shares
Director 2011 2010
D T Munatsi 23,223,154 21,438,619
N Kudenga 366,814 365,947
F M Dzanya 3,094,774 2,765,583
B Moyo 7,119,958 7,099,957
Total 33,804,700 31,670,106
Directors’ interests in
transactions
In terms of ABC Holdings Limited policy, Directors are
requiredtofurnishdetailsonanannualbasisoftheirrespective
personal interests in business concerns which are recorded
inaspecificregister.AnyinterestsbyDirectorsintransactions
between the Company and third parties were disclosed to
committees that were responsible for approval prior to such
approval being granted and interested parties are required
to recuse themselves from any approval process. Details of
lending exposures are provided in note 25 on related party
transactions.
Directors Emoluments
Directors’ emoluments in respect of the Group’s directors
(Executive and Non-Executive) are shown in note 4 to the
financial statements. The earnings and perquisites of the
Group Chief Executive Officer and executive management
are approved by the Remuneration Committee of the Board.
directors’ report
ABC Holdings Limited ANNUAL REPORT 201144
Directors and Secretaries
Full details of the directorate are shown on pages 40 and 41.
Details of the secretary are given on page 39. Brief CVs of
directors eligible and available for re-election at the Annual
General Meeting are included in the Notice to Shareholders.
Dividends
The Directors have declared a final dividend of BWP0.105
(10.5 Thebe) per share in respect of the year ended
31 December 2011. This brings the full year dividend to
17.5 Thebe. The dividend will be paid on 4th May 2012 to
shareholders registered in the books of the Company at the
close of business on Friday, 13th April 2012.
Insurance
ABC Holdings Limited and its subsidiaries are insured against
banking risks, asset losses, professional indemnity and
directors’ and officers’ claims at a level of cover, which is
considered to be adequate by the directors.
events after the reporting date
There were no significant events after the reporting date.
45
BancABC Botswana head officeBancABC Zimbabwe head office
ABC Holdings Limited ANNUAL REPORT 201146
ANNUAL FINANCIAL
STATEMENTS
	48	 Independent auditor’s report
	49	 Significant accounting policies
	64	 Financial risk management
	91	 Consolidated Group financial statements
	115	 Company separate financial statements
47
for the year ended 31 December 2011
FIvE-yEAr FINANCIAL hIghLIghTS
Chairman’s report continued
PricewaterhouseCoopers, Plot 50371, Fairground Office Park, Gaborone, P O Box 294, Gaborone, Botswana
T: (267) 395 2011, F: (267) 397 3901, www.pwc.com/bw
Senior Partner: B D Phirie
Partners: R Binedell, R P De Silva, A S Edirisinghe, N B Soni
Associates: M Lalithkumar, M Ramdas, S Sinha, S K K Wijesena.
INDEPENDENT AUDITOR’S REPORT TO THE MEMBERS OF ABC HOLDINGS
LIMITED
Report on the financial statements
We have audited the accompanying consolidated annual financial statements and annual financial
statements of ABC Holdings Limited, which comprise the consolidated and separate balance sheets as
at 31 December 2011, and the consolidated and separate income statements, the consolidated and
separate statements of comprehensive income, changes in equity and cash flows for the year then
ended, and a summary of significant accounting policies and other explanatory information, as set
out on pages 49 to 147.
Directors’ Responsibility for the Financial Statements
The company’s directors are responsible for the preparation and fair presentation of these financial
statements in accordance with International Financial Reporting Standards, and for such internal
control as the directors determine is necessary to enable the preparation of financial statements that
are free from material misstatements, whether due to fraud or error.
Auditor’s Responsibility
Our responsibility is to express an opinion on these financial statements based on our audit. We
conducted our audit in accordance with International Standards on Auditing. Those standards
require that we comply with ethical requirements and plan and perform the audit to obtain
reasonable assurance about whether the financial statements are free from material misstatement.
An audit involves performing procedures to obtain audit evidence about the amounts and disclosures
in the financial statements. The procedures selected depend on the auditor’s judgement, including
the assessment of the risks of material misstatement of the financial statements, whether due to fraud
or error. In making those risk assessments, the auditor considers internal control relevant to the
entity’s preparation and fair presentation of the financial statements in order to design audit
procedures that are appropriate in the circumstances, but not for the purpose of expressing an
opinion on the effectiveness of the entity’s internal control. An audit also includes evaluating the
appropriateness of accounting policies used and the reasonableness of accounting estimates made by
management, as well as evaluating the overall presentation of the financial statements.
We believe that the audit evidence we have obtained is sufficient and appropriate to provide a basis
for our audit opinion.
Opinion
In our opinion, the financial statements give a true and fair view of, the consolidated and separate
financial position of ABC Holdings Limited as at 31 December 2011, and its consolidated and separate
financial performance and its consolidated and separate cash flows for the year then ended in
accordance with International Financial Reporting Standards.
PricewaterhouseCoopers 27 March 2012
Certified Auditors Gaborone
Practicing member: Rudi Binedell (20040091.18)
ABC Holdings Limited ANNUAL REPORT 201148
Reporting entity
ABC Holdings Limited (the “Company”) is domiciled in
Botswana. The consolidated financial statements of the
Company for the year ended 31 December 2011 include
the Company and its subsidiaries (together referred to as
the “Group”) and the Group’s interest in associates and its
jointly controlled entities.
Statement of compliance
The consolidated financial statements have been prepared
in accordance with International Financial Reporting Standards
(IFRS) as issued by the International Accounting Standards
Board. In preparing these financial statements, the Group
adopted the following interpretations effective in 2011, that
are relevant to the Group:
•	 Amendment to IAS 24, ‘Related Party Disclosures’, pro­
vides partial relief from the requirement for government
related entities to disclose details of all transactions with
the government and other government-related entities. It
also clarifies and simplifies the definition of a related party.
The adoption of the standard has no impact to the Group
in the current year.
•	 IFRIC 19, ‘Extinguishing Financial Liabilities with Equity
Instruments’ clarifies the accounting when an entity re-
ne­gotiates the terms of its debt with the result that the
liability is extinguished through the debtor issuing its
own equity instruments to the creditor. A gain or loss is
recognised in the profit and loss account based on the fair
value of the equity instruments compared to the carrying
amount of the debt. The adoption of the standard has no
impact to the Group in the current year.
•	 Improvements to IFRSs, This is a collection of amend­
ments to IFRSs. These amendments are the result of
conclusions the IASB reached on proposals made in its
annual improvements project. The annual improvements
project provides a vehicle for making non-urgent but
necessary amendments to IFRSs. Some amendments
involve consequential amendments to other IFRSs.
Group has chosen not to early adopt the following standards
and interpretations that were issued but not yet effective
for accounting periods beginning on 1 January 2011:
•	 Amendment to IFRS 7, ‘Financial Instruments:
Disclosures’ – Transfer of financial assets (effective
from 1 July 2011)
•	 Amendment to IFRS 7, ‘Financial Instruments:
Disclosure’ (effective from 1 January 2013)
•	 Amendment to IAS 12, ‘Income taxes’ on deferred tax
(effective from 1 January 2012)
•	 Amendments to IAS 1, ‘Presentation of Financial
Statements’, on presentation of items of OCI (effective
from 1 July 2012)
•	 Amendments to IAS 19, ‘Employee benefits’ (effective
from 1 January 2013)
•	 IFRS 9, ‘Financial Instruments’ (effective from
1 January 2013)
•	 Amendments to IFRS 9, ‘Financial Instruments’
(effective from 1 January 2013)
•	 IFRS 10, ‘Consolidated financial statements’ (effective
from 1 January 2013)
•	 IFRS 11, ‘Joint arrangements’ (effective from
1 January 2013)
•	 IFRS 12, ‘Disclosures of interests in other entities’
(effective from 1 January 2013)
•	 IFRS 13, ‘Fair value measurement’ (effective from
1 January 2013)
•	 IAS 27 (revised 2011), ‘Separate financial statements’
(effective from 1 January 2013)
•	 IAS 28 (revised 2011), ‘Associates and joint ventures’
(effective from 1 January 2013)
•	 Amendments to IAS 32, ‘Financial Instruments:
Presentation’ (effective from 1 January 2014)
The Group is yet to assess the full impact of the above
standards and interpretations.
Basis of preparation
The Group presents accounts in accordance with IFRS. The
consolidated financial statements are prepared in accordance
with the going concern principle under the historical cost
basis as modified by the revaluation of financial instruments
classified as available-for-sale, financial assets and liabilities
held “at fair value through profit or loss”, land and buildings
and investment properties.
The consolidated financial statements comprise the con­
solidated income statement and statement of compre­
hensive income shown as two statements, the balance
sheet, the statement of changes in equity, the cash flow
statement and the notes. The Group classifies its expenses
for the year ended 31 December 2011
significant accounting policies
49
Significant accounting policies continued
•	 Impairment of loans and advances
	 The Group reviews its loan portfolios to assess impair-
ment at least on a monthly basis. In determining whether
an impairment loss should be recorded in the income
statement, the Group makes judgements as to whether
there is any observable data indicating that there is a
measurable decrease in the estimated future cash flows
from a portfolio of loans before the decrease can be iden­
tified with an individual loan in that portfolio. This evidence
may include observable data indicating that there has been
an adverse change in the payment status of borrowers
in a group, or national or local economic conditions that
correlate with defaults on assets in the Group. Manage-
ment uses estimates based on historical loss experience
for assets with credit risk characteristics and objective
evidence of impairment similar to those in the portfolio
when scheduling its future cash flows. The methodology
and assumptions used for estimating both the amount and
timing of future cash flows are reviewed monthly to reduce
any differences between loss estimates and actual loss
experience.
•	 Fair value of derivatives
	The fair value of financial instruments that are not quoted
in active markets is determined by using valuation tech­
niques. Where valuation techniques (for example, models)
are used to determine fair values, they are validated and
periodically reviewed by qualified personnel independent
of the area that created them. All models are certified
before they are used, and models are calibrated to ensure
that outputs reflect actual data and comparative market
prices. To the extent practical, models use only observable
data; however, areas such as credit risk (both own and
counterparty), volatilities and correlations require manage­
ment to make estimates. Changes in assumptions about
these factors could affect reported fair value of financial
instruments.
•	 Held-to-maturity investments
	 The Group follows the IAS 39 guidance on classifying
non-derivative financial assets with fixed or determinable
payments and fixed maturity, as held-to-maturity. This
classification requires significant judgement. In making
this judgement, the Group evaluates its intention and
ability to hold such investments to maturity. If the Group
fails to keep these investments to maturity other than
by the nature of expense method, and presents its cash
flows using the indirect method.
The preparation of consolidated financial statements in con­
formity with IFRS requires management to make judgements,
estimates and assumptions that affect the application of
policies and reported amounts of assets and liabilities, income
and expenses. These estimates and associated assumptions
are based on historical experience and various other factors
that are believed to be reasonable under the circumstances,
the results of which form the basis for making the judgements
about carrying values of assets and liabilities that are not
readily apparent from other sources. Actual results may differ
from these estimates.
The estimates and underlying assumptions are reviewed
on an ongoing basis. Revisions to accounting estimates are
recognised in the period in which the estimate is revised if
the revision affects only that period, or in the period of the
revision and future periods if the revision affects both current
and future periods. Judgements made by management in
the application of IFRS that have a significant effect on the
financial statements and estimates with a significant risk of
material adjustment in the next year are discussed below:
•	 Fair value of financial instruments
	Many of the Group’s financial instruments are measured
at fair value on the balance sheet and it is usually possible
to determine their fair values within a reasonable range
of estimates. Fair value estimates are made at a specific
point in time, based on market conditions and information
about the financial instrument. These estimates are sub­
jective in nature and involve uncertainties and matters of
judgement, (e.g. interest rates, volatility and estimated
cash flows) and therefore cannot be determined with
precision.
•	 Deferred tax assets
	 The recognition of deferred tax assets is based on profit
forecasts made by management of the particular Group
Company where the asset has arisen. These forecasts
are based on the Group’s re-capitalisation plans of the
subsidiary and market conditions prevailing in the economy
in which the Company operates.
ABC Holdings Limited ANNUAL REPORT 201150
Basis of consolidation
Subsidiaries
Subsidiaries are those enterprises controlled by the Company.
Control is defined as the power to govern the financial and
operating policies of the entity so as to obtain benefits from
its activities. The existence and effect of potential voting
rights that are currently exercisable or convertible are con­
sidered when assessing whether the Group controls another
entity. Subsidiaries are fully consolidated from the date
that control commences until the date that control ceases.
Accounting policies of subsidiaries conform to the policies
adopted by the Group for its banking and investment manage­
ment activities. Investments in subsidiaries are accounted
for at cost less impairment losses in the Company accounts.
The carrying amounts of these investments are reviewed
annually and written down for impairment where considered
necessary.
Associates
Associates are those enterprises in which the Group has
significant influence, but not control, generally accompanying
a shareholding of between 20% and 50% of the voting
rights over the financial and operating policies. The con­
solidated financial statements include the Group’s share of
the total gains and losses of associates on an equityaccounted
basis, from the date significant influence commences until
the date that significant influence ceases. The Group’s share
of its associates’ post-acquisition profits or losses is recognised
in the income statement; its share of post-acquisition move­
ments in reserves is recognised in reserves. The cumulative
post-acquisition movements are adjusted against the carrying
amount of the investment. Goodwill arising on acquisition is
included in the carrying amount of the investment. Investments
in associates and joint ventures are accounted for at cost
less impairment losses in the Company’s separate financial
statements.
Jointly controlled entities
Jointly controlled entities are those enterprises over whose
activities the Group has joint control established by contractual
agreement. The consolidated financial statements include
the Group’s share of the total gains or losses of the entity on
an equity accounted basis from the date that joint control
commences, until the date joint control ceases.
for the specific circumstances – for example, selling an
insignificant amount close to maturity – it will be required
to reclassify the entire category as available-for-sale. The
investments would therefore be measured at fair value,
not amortised cost.
•	 Income taxes
	 The Group is subject to income taxes in numerous juris­
dictions. Significant estimates are required in determining
the worldwide provision for income taxes. There are many
transactions and calculations for which the ultimate tax
determination is uncertain during the ordinary course of
business. The Group recognises liabilities for anticipated
tax audit issues based on estimates of whether additional
taxes will be due. Where the final tax outcome of these
matters is different from the amounts that were initially
recorded, such differences will impact the income tax
and deferred tax provisions in the period in which such
determination is made.
•	 Goodwill impairment
	The Group assesses goodwill for impairment on an annual
basis based on value in use calculations. Significant esti­
mates and judgements are applied in projecting the future
pre-tax cash flows, the appropriate growth and discount
rates. The assumptions applied in testing goodwill for
impair­ments at year end are discussed in note 17.
•	 Impairment of associates
	The Group determines at each reporting date whether
there is any objective evidence that the investment in
the associate is impaired. If this is the case, the Group
calculates the amount of impairment as the difference
between the recoverable amount of the associate and its
carrying value and recognises the amount in the income
statement.
Functional and presentation
currency
The financial statements are presented in Botswana Pula
(BWP), which is the Company’s functional currency and the
Group’s presentation currency. Except as indicated, financial
information presented in BWP has been rounded off to the
nearest thousand.
51
irrespective of the extent of any minority interest. Goodwill
is carried at cost less accumulated impairment losses.
Goodwill is allocated to cash generating units and is not
amortised but is tested annually for impairment. Impairment
losses are recognised in the income statement. The excess
of the fair value of the Group’s share of the identifiable net
assets acquired over the cost of the acquisition is recorded
immediately in the income statement.
Business combinations
The acquisition method of accounting is used to account
for the acquisition of subsidiaries by the Group. The cost of
an acquisition is measured as the sum of the fair value of
the assets given, equity instruments issued and liabilities
incurred or assumed at the acquisition date. Transaction
costs for any business combinations prior to 1 January 2010
are capitalised as part of the cost of an acquisition. Trans­
action costs on or after 1 January 2010 are recognised within
profit and loss as and when they are incurred. Identifiable
assets acquired and liabilities and contingent liabilities
assumed in a business combination are measured initially at
their fair values at the acquisition date, irrespective of the
extent of any non-controlling interest. The excess of the cost
of an acqui­sition over the Group’s share of the fair value of
identifiable net assets acquired is recorded as goodwill and
accounted for in terms of accounting policy, Intangible assets.
The Group elects to measure non-controlling interests on the
acquisition date at either fair value or at the non-controlling
interest’s proportionate share of the subsidiary’s identifiable
net assets. If the cost of the acquisition is less than the
fair value of the net assets of the subsidiary acquired, the
difference is recognised directly in profit or loss.
Transactions with non-controlling interests
Transactions, including partial disposals, with minority non-
controlling interests shareholders that do not result in the
gain or loss of control, are accounted for as transactions
with equity holders of the Group. For purchases of additional
interests from non-controlling interests, the excess of the
purchase consideration over the Group’s proportionate share
of the subsidiary’s additional net asset value of the subsidiary
acquired is accounted for directly in equity. For disposals
to non-controlling shareholders, the profit or losses on the
partial disposal of the Group’s interest in a subsidiary to non-
controlling interests is also accounted for directly in equity.
All acquisition-related costs are expensed.
Special purpose entities
Special purpose entities (SPEs) are entities that are created
to accomplish a narrow and well-defined objective. An SPE
is consolidated if, based on an evaluation of the substance
of its relationship with the Group and the SPE’s risks and
rewards, the Group concludes that it controls the SPE.
The assessment of whether the Group has control over
an SPE is carried out at inception and normally no further
reassessment of control is carried out in the absence of
changes in the structure or terms of the SPE, or additional
transactions between the Group and the SPE. Day-to-day
changes in market conditions normally do not lead to a
reassessment of control. However, sometimes changes in
market conditions may alter the substance of the relationship
between the Group and the SPE and in such instances the
Group determines whether the change warrants a reassess­
ment of control based on the specific facts and circum­
stances. Where the Group’s voluntary actions, such as lending
amounts in excess of existing liquidity facilities or extending
terms beyond those established originally, change the relation­
­ship between the Group and an SPE, the Group performs a
reassessment of control over the SPE.
Transactions eliminated on consolidation
Intra-group balances and transactions, and any unrealised
gains arising from intra-group transactions, are eliminated in
preparing the consolidated financial statements. Unrealised
gains arising from transactions with associates and jointly
controlled entities are eliminated to the extent of the Group’s
interest in the enterprise. Unrealised gains arising from trans­
actions with associates and joint ventures are eliminated
against the investment in the associate. Unrealised losses
are eliminated in the same way as unrealised gains, but only
to the extent that there is no evidence of impairment.
Goodwill
All business combinations are accounted for by applying the
purchase method. Goodwill is any excess of the cost of an
acquisition over the Group’s interest in the fair value of the
identifiable assets and liabilities acquired. The cost of an
acquisition is measured as the fair value of the assets given,
equity instruments issued and liabilities incurred or assumed
at the date of exchange, plus costs directly attributable to
the acquisition. Identifiable assets acquired and liabilities and
contingent liabilities assumed in a business combination are
measured initially at their fair values at the acquisition date,
Significant accounting policies continued
ABC Holdings Limited ANNUAL REPORT 201152
in the fair value of monetary securities denominated in foreign
currency classified as available-for-sale are analysed between
translationdifferencesresultingfromchangesintheamortised
cost of the security and other changes in the carrying amount
of the security. Translation differences related to changes in
the amortised cost are recognised in the income statement,
and other changes in the carrying amount are recognised
in equity.
Recognition of assets and liabilities
Assets are recognised when the Group irrevocably gains
control of a resource from which future economic benefits
are expected to flow to the Group. Liabilities are recognised
when the Group has a legal or constructive obligation as a
result of past events and a reliable estimate of the amount of
the obligation, or outflow of resources from the Group can
be made. If there is a possible obligation or outflow of
resources from the Group or where a reliable estimate is not
available, a contingent liability is disclosed.
Derecognition of assets and liabilities
An asset is derecognised when the Group loses control over
the contractual rights that comprise the asset. A liability is
derecognised when it is extinguished.
Cash and cash equivalents
Cash and cash equivalents comprise cash balances on hand;
cash deposited with banks and short-term highly liquid invest­
mentswithmaturitiesofthreemonthsorlesswhenpurchased.
For cash flow purposes cash and cash equivalents include
bank overdrafts.
Financial assets
Initial recognition
The Group classifies its financial assets in the following cate­
gories: financial assets at fair value through profit or loss;
loans and receivables; held-to-maturity investments; and
available-for-sale financial assets. Management determines
the classification of its investments at initial recognition.
Regular-way purchases and sales of financial assets at fair
value through profit or loss, held-to-maturity and available-
for-sale are recognised on trade date; the date on which the
Group commits to purchase or sell the asset. Financial assets
are initially recognised at fair value plus transaction costs for
all financial assets not carried at fair value through profit or
loss. Financial assets carried at fair value through profit and
Common control transactions
Entities are under common control when the combining
entities or businesses are ultimately controlled by the same
party or parties both before and after the combination and
where control is not transitory. The acquirer in a business
combination under common control does not restate any
assets and liabilities to their fair values. Instead, the acquirer
incorporates the assets and liabilities at their pre-combination
carrying amounts without fair value uplift. No goodwill is
recorded. Any difference between the cost of investment
and the carrying value of the net assets is recorded in equity,
which could impact on distributable profits, depending on
local legislation. This applies whether the consideration
was for shares or cash. The acquirer’s financial statements
include the acquired entity’s results from the date of the
business combination.
Foreign entities
The assets and liabilities of foreign operations are translated
to the Group’s presentation currency, Botswana Pula, from
their respective measurement currencies at foreign exchange
rates ruling at the balance sheet date. The revenues and
expenses of foreign operations are translated to Botswana
Pula at the average exchange rate for the year. Foreign
exchange differences arising on translation are recognised
as foreign currency translation reserve in equity. When a
foreign operation is disposed of, or partially disposed of, such
exchange differences are recognised in the income statement
as part of the gain or loss on sale.
Foreign currency transactions
Foreign currency transactions are translated at the foreign
exchange rates ruling at the date of the transaction. Monetary
assets and liabilities denominated in foreign currencies at
the balance sheet date are translated at the foreign exchange
rate ruling at that date. Foreign exchange gains and losses
that relate to borrowings and cash and cash equivalents are
presented in the income statement within finance income
or cost. All other foreign exchange gains are presented within
the income statements within “other net (losses)/gains”.
Differences arising on translation are recognised in the income
statement and shown under other income, except when
deferred in equity as qualifying cash flow hedges and qualifying
net investment hedges. Non-monetary assets and liabilities
denominated in foreign currencies that are measured at fair
value are translated to the functional currency at the exchange
rate at the date that the fair value was determined. Changes
53
Loans and receivables
Loans and receivables are non-derivative financial assets
with fixed or determinable payments that are not quoted in
an active market, other than:
•	 those that the entity intends to sell immediately or in the
short-term, which are classified as held for trading, and
those that the entity upon initial recognition designates as
at fair value through profit or loss;
•	 those that the entity upon initial recognition designates
as available-for-sale; or
•	 those for which the holder may not recover substantially
all of its initial investment, other than because of credit
deterioration.
Loans and advances are accounted for on an amortised cost
basis using the effective interest rate. Origination transaction
costs and origination fees received that are integral to the
effective rate are capitalised to the value of the loan and
amortised through interest income as part of the effective
interest rate. The majority of the Group’s advances are
included in the loans and receivables category. They are
statednetofallowancesforspecificandportfolioimpairment.
Included in loans and advances are finance lease receivables.
Finance lease receivables are those leases where the Group
transfers substantially all the risk and reward incidental to
ownership of an asset. Finance lease charges are recognised
in income using the effective interest rate method.
Held-to-maturity investments
Held-to-maturity investments are non-derivative financial
assets with fixed or determinable payments and fixed
maturities that the Group’s management has the positive
intention and ability to hold to maturity. If the Group were to
sell other than an insignificant amount of held-to maturity
assets, the entire category would be reclassified as available-
for-sale. Held-to-maturity fixed interest instruments, held in
investment portfolios, are stated at cost, less any impairment
losses.
Available-for-sale financial assets
Available-for-sale investments are those intended to be held
for an indefinite period of time, which may be sold in
response to needs for liquidity or changes in interest rates,
exchange rates or equity prices or financial assets that are
not designated as another category of financial assets.
Available-for-sale quoted investments are valued at market
loss are initially recognised at fair value, and transaction costs
are expensed in the income statement.
Financial assets at fair value through profit
or loss
This category has two subcategories: financial assets held
for trading, and those designated at fair value through profit
or loss at inception. A financial asset is classified as held for
trading if it is acquired or incurred principally for the purpose
of selling or repurchasing in the near term or if it is part of a
portfolio of identified financial instruments that are managed
together and for which there is evidence of a recent actual
pattern of short-term profit taking. Derivatives are also cate­
gorised as held for trading, unless they are designated as
hedging instruments. Financial assets and financial liabilities
are designated at fair value through profit or loss when:
•	 doing so significantly reduces measurement inconsis-
tencies that would arise if the related derivatives were
treated as held for trading and the underlying financial
instruments were carried at amortised cost for loans
and advances to customers or banks and debt securities
in issue;
•	 certain investments, such as equity investments, are
managed and evaluated on a fair value basis in accordance
with a documented risk management or investment
strategy and reported to key management personnel on
that basis are designated at fair value through profit or
loss; or
•	 financial instruments, such as debt securities held, con­
taining one or more embedded derivatives that could
significantly modify the cash flows, are designated at fair
value through profit or loss.
The fair value designation, once made, is irrevocable. Sub­
sequent to initial recognition, the fair values are re-measured
at each reporting date. Gains and losses arising from changes
therein are recognised in interest income for all dated financial
assets and in other revenue within non-interest revenue
for all undated financial assets. Financial assets at fair value
through profit or loss are measured at initial recognition and
subsequently at fair value based on quoted market price
using the bid/offer mid rate at the balance sheet date. If
there is no quoted market price in an active market, the
instru­ments are measured using valuation models. All
changes in fair value are recognised in the income statement.
Significant accounting policies continued
ABC Holdings Limited ANNUAL REPORT 201154
market transactions in the same instrument, without modifi­
cation or repackaging, or based on discounted cash flow
models and option pricing valuation techniques whose
variables include only data from observable markets. When
such valuation models, with only observable market data as
input, indicate that the fair value differs from the transaction
price, this initial difference, commonly referred to as day
one profit or loss, is recognised in the income statement
immediately. If non-observable market data is used as part of
the input to the valuation models, any resulting difference
between the transaction price and the model value is
deferred. The timing of recognition of deferred day one profit
or loss is determined individually. It is either amortised over
the life of the transaction, deferred until the instrument’s fair
value can be determined using market observable inputs, or
realised through settlement. The deferral and unwind method
is based on the nature of the instrument and availability of
market observable inputs. Subsequent to initial recognition,
the fair values of financial assets and liabilities are based on
quoted market prices or dealer price quotations for financial
instruments traded in active markets.
A financial instrument is regarded as quoted in an active
market if quoted prices are readily and regularly available
from an exchange, dealer, broker, industry group, pricing
service or regulatory agency, and those prices represent
actual and regularly occurring market transactions on an
arm’s length basis. If the above criteria are not met, the
market is regarded as being inactive. Indications that a market
is inactive are when there is a wide bid offer spread or
significant increase in the bid offer spread or there are few
recent transactions.
If the market for a financial asset is not active or the instru­
ment is an unlisted instrument, the fair value is determined
by using applicable valuation techniques. These include the
use of recent arm’s length transactions, discounted cash
flow analyses, pricing models and valuation techniques
commonly used by market participants. Where discounted
cash flow analyses are used, estimated future cash flows
are based on management’s best estimates and the discount
rate is a market related rate at the balance sheet date for
a financial asset with similar terms and conditions. Where
pricing models are used, inputs are based on observable
market indicators at the balance sheet date and profits or
losses are only recognised to the extent that they relate to
changes in factors that market participants will consider in
setting a price.
value using the bid/offer mid rate. Unlisted equity invest­
ments and instruments for which there is no quoted market
price are measured using valuation models. Where the
valuation models may not produce reliable measurement,
the unquoted investments are stated at cost. Available-for-
sale investments are marked to market and any gains or
losses arising from the revaluation of investments are shown
in shareholders’ equity as available for-sale reserves. On
realisation of the investment, the available-for-sale reserves
are transferred to the income statement. Interest income,
calculated using the effective interest method, is recognised
in the income statement. Dividends received on available-
for-sale instruments are recognised in the income statement
when the Group’s right to receive payment has been esta­
blished. Foreign exchange gains or losses on available-for-
sale debt investments are recognised in the income statement.
Reclassification of financial assets
The Group may choose to reclassify a non-derivative financial
asset held for trading out of the held for trading category if
the financial asset is no longer held for the purpose of selling
it in the near term. Financial assets other than loans and
receivables are permitted to be reclassified out of the held
for trading category only in rare circumstances arising from a
single event that is unusual and highly unlikely to recur in the
near term. In addition, the Group may choose to reclassify
financial assets that would meet the definition of loans and
receivables out of the held for trading or available-for-sale
categories if the Group has the intention and ability to hold
these financial assets for the foreseeable future or until
maturity at the date of reclassification. Reclassifications are
made at fair value as of the reclassification date. Fair value
becomes the new cost or amortised cost as applicable, and
no reversals of fair value gains or losses recorded before
reclassification date are subsequently made. Effective interest
rates for financial assets reclassified to loans and receivables
and held-to-maturity categories are determined at the reclas­
sification date. Further increases in estimates of cash flows
adjust effective interest rates prospectively. On reclas­sification
of a financial asset out of the “at fair value through profit or
loss” category, all embedded derivatives are re-assessed and,
if necessary, accounted for separately.
Fair value
The best evidence of the fair value of a financial instrument
on initial recognition is the transaction price, i.e. the fair value
of the consideration given or received, unless the fair value
is evidenced by comparison with other observable current
55
The amount of the loss is measured as the difference between
theasset’scarryingamountandthepresentvalueofestimated
future cash flows (excluding future credit losses that have
not been incurred) discounted at the financial asset’s original
effective interest rate. The carrying amount of the asset is
reduced through the use of an allowance account and the
amount of the loss is recognised in the income statement. If
a loan or held-to-maturity investment has a variable interest
rate, the discount rate for measuring any impairment loss
is the current effective interest rate determined under the
contract. As a practical expedient, the Group may measure
impairment on the basis of an instrument’s fair value using
an observable market price.
The calculation of the present value of the estimated future
cash flows of a collateralised financial asset reflects the cash
flows that may result from foreclosure less costs for obtaining
andsellingthecollateral,whether or not foreclosureisprobable.
For the purposes of a collective evaluation of impairment,
financial assets are grouped on the basis of similar credit risk
characteristics (i.e. on the basis of the Group’s grading process
that considers asset type, industry, geographical location,
collateral type, past due status and other relevant factors).
Those characteristics are relevant to the estimation of future
cash flows for groups of such assets by being indicative of
the debtors’ ability to pay all amounts due according to the
contractual terms of the assets being evaluated.
Future cash flows in a group of financial assets that are
collectively evaluated for impairment are estimated on the
basis of the contractual cash flows of the assets in the Group
and historical loss experience for assets with credit risk
characteristics similar to those in the Group. Historical loss
experience is adjusted on the basis of current observable
data to reflect the effects of current conditions that did not
affect the period on which the historical loss experience
is based and to remove the effects of conditions in the
historical period that do not currently exist.
Estimates of changes in future cash flows for groups of
assets should reflect and be directionally consistent with
changes in related observable data from period to period (for
example, changes in unemployment rates, property prices,
payment status, or other factors indicative of changes in the
probability of losses in the Group and their magnitude). The
methodology and assumptions used for estimating future
cash flows are reviewed regularly by the Group to reduce
any differences between loss estimates and actual loss
experience. When a loan is uncollectible, it is written off
In cases where the fair value of unlisted equity instruments
cannot be determined reliably, the instruments are carried at
cost less impairment. The fair value for loans and advances
as well as liabilities to banks and customers are determined
using a present value model on the basis of contractually
agreed cash flows, taking into account credit quality, liquidity
and costs.
Impairment of financial assets
a) Assets carried at amortised cost
The Group assesses at each balance sheet date whether
there is objective evidence that a financial asset or group of
financial assets is impaired. A financial asset or a group of
financial assets is impaired and impairment losses are
incurred only if there is objective evidence of impairment as
a result of one or more events that occurred after the initial
recognition of the asset (a “loss event”) and that loss event
(or events) has an impact on the estimated future cash flows
of the financial asset or group of financial assets that can
be reliably estimated. The criteria that the Group uses to
determine that there is objective evidence of an impairment
loss include:
•	 delinquency in contractual payments of principal or interest;
•	 cash flow difficulties experienced by the borrower (for
example, equity ratio, net income percentage of sales);
•	 breach of loan covenants or conditions;
•	 initiation of bankruptcy proceedings;
•	 deterioration of the borrower’s competitive position;
•	 deterioration in the value of collateral; and
•	 downgrading below investment grade level.
The Group first assesses whether objective evidence of impair­
­ment exists individually for financial assets that are individually
significant, and individually or collectively for financial assets
that are not individually significant. If the Group determines
that no objective evidence of impairment exists for an indivi­
dually assessed financial asset, whether significant or not, it
includes the asset in a group of financial assets with similar
credit risk characteristics and collectively assesses them for
impairment. Assets that are individually assessed for impair­
ment and for which an impairment loss is or continues to be
recognised are not included in a collective assessment of
impairment.
Significant accounting policies continued
ABC Holdings Limited ANNUAL REPORT 201156
Derivative financial instruments
and hedging activities
A derivative is a financial instrument whose value changes
in response to an underlying variable, that requires little or
no initial investment and that is settled at a future date.
Derivatives are initially recognised at fair value on the date
on which a derivative contract is entered into and are sub­
sequently re-measured at their fair value.
Fair values are obtained from quoted market prices in active
markets, including recent market transactions, and valuation
techniques, including discounted cash flow models and options
pricing models, as appropriate. Where fair value is determined
using valuation techniques whose variables include non-
observable market data, the difference between the fair value
and the transaction price (“the day one profit or loss”) is not
recognised in the statement of financial position. These
differences are however kept track of for disclosure purposes.
However, where observable market factors that market parti­
ci­pants would consider in setting a price subsequently become
available, the balance of the deferred day one profit or loss is
released to profit or loss.
All derivatives are carried as assets when fair value is positive
and as liabilities when fair value is negative. Certain derivatives
embedded in other financial instruments, are treated as sepa­
rate derivatives when their economic characteristics and risks
are not closely related to those of the host contract and the
host contract is not carried at fair value through profit or loss.
These embedded derivatives are measured at fair value with
changes in fair value recognised in the income statement
unless the Group chooses to designate the hybrid contracts
at fair value through profit or loss. The method of recognising
the resulting fair value gain or loss depends on whether the
derivative is designated as a hedging instrument, and if so,
the nature of the item being hedged. The Group designates
certain derivatives as either:
a)	hedges of the fair value of recognised assets or liabilities
or firm commitments (fair value hedge);
b)	hedges of highly probable future cash flows attributable
to a recognised asset or liability, or a forecasted transaction
(cash flow hedge);
c)	hedges of a net investment in a foreign operation (net
investment hedge); or
d)	derivatives that do not qualify for hedge accounting.
against the related provision for loan impairment. Such loans
are written off after all the necessary procedures have been
completed and the amount of the loss has been determined.
If, in a subsequent period, the amount of the impairment
loss decreases and the decrease can be related objectively
to an event occurring after the impairment was recognised
(such as an improvement in the debtor’s credit rating), the
previously recognised impairment loss is reversed by adjusting
the allowance account. The amount of the reversal is recog­
nised in the income statement in impairment charge for credit
losses. Subsequent to impairment, the effects of discounting
unwind over time as interest income.
b) Assets classified as available-for-sale
The Group assesses at each balance sheet date whether
there is objective evidence that a financial asset or a group of
financial assets is impaired. In the case of equity investments
classified as available-for-sale, a significant or prolonged decline
in the fair value of the security below its cost is considered
in determining whether the assets are impaired. If any such
evidence exists for available-for-sale financial assets, the
cumulative loss – measured as the difference between the
acquisition cost and the current fair value, less any impair­
ment loss on that financial asset previously recognised in the
income statement – is removed from equity and recognised
in the income statement. Impairment losses recognised in
the income statement on equity instruments are not reversed
through the income statement. If, in a subsequent period,
the fair value of a debt instrument classified as available-for-
sale increases and the increase can be objectively related to
an event occurring after the impairment loss was recognised
in profit or loss, the impairment loss is reversed through the
income statement.
c) Renegotiated loans
Loans that are either subject to collective impairment assess­
ment or individually significant and whose terms have been
renegotiated are no longer considered to be past due but are
treated as new loans.
Offsetting financial
instruments
Financial assets and liabilities are offset and the net amount
reported in the balance sheet when there is a legally enforce­
able right to offset the recognised amounts and there is an
intention to settle on a net basis, or realise the asset and settle
the liability simultaneously.
57
to occur, the cumulative gain or loss that was reported in
equity is immediately transferred to the income statement.
c) Net investment hedge
Hedgesofnetinvestmentsinforeignoperationsareaccounted
for similarly to cash flow hedges. Any gain or loss on the
hedging instrument relating to the effective portion of the
hedge is recognised in equity; the gain or loss relating to the
ineffective portion is recognised immediately in the income
statement. Gains and losses accumulated in equity are
included in the income statement when the foreign operation
is disposed of.
d) Derivatives that do not qualify for hedge
accounting
Certain derivative instruments do not qualify for hedge accoun­
ting. Changes in the fair value of any derivative instrument
that does not qualify for hedge accounting are recognised
immediately in the income statement under net trading
income. However, the gains and losses arising from changes
in the fair value of derivatives that are managed in conjunction
with designated financial assets or financial liabilities are
included in “net income from financial instruments desig­
nated at fair value”.
Financial guarantees
Financial guarantee contracts are contracts that require the
issuer to make specified payments to reimburse the holder
for a loss it incurs because a specified debtor fails to make
payments when due, in accordance with the terms of a debt
instrument. Such financial guarantees are given to banks,
financial institutions and other bodies on behalf of customers
to secure loans, overdrafts and other banking facilities.
Financial guarantees are initially recognised in the financial
statements at fair value on the date the guarantee was given.
Subsequent to initial recognition, the Group liabilities under
such guarantees are measured at the higher of the initial
measurement, less amortisation calculated to recognise in
the income statement the fee income earned on a straight-
line basis over the life of the guarantee and the best estimate
of the expenditure required to settle any financial obligation
arising at the balance sheet date. These estimates are
determined based on experience of similar transactions and
history of past losses, supplemented by the judgement of
management. Any increase in the liability relating to guaran­
tees is taken to the income statement under other operating
expenses.
Hedge accounting is used for derivatives designated in this
way provided certain criteria are met. The Group documents
atinceptionofthetransaction,therelationshipbetweenhedged
items and hedging instruments, as well as its risk management
objective and strategy for undertaking various hedge trans­
actions. The Group also documents its assessment, both
at hedge inception and on an ongoing basis, of whether the
derivatives that are used in hedging transactions are highly
effective in offsetting changes in fair values or cash flows of
hedged items.
a) Fair value hedge
Changes in the fair value of derivatives that are designated
and qualify as fair value hedges are recorded in the income
statement, together with any changes in the fair value of the
hedged asset or liability that are attributable to the hedged
risk. Effective changes in fair value of interest rate swaps
and related hedged items are reflected in “net interest
income – net gains/losses on hedging instruments”. Effective
changes in fair value of currency futures are reflected in “net
trading income – foreign exchange – transaction gains less
losses”. Any ineffectiveness is recorded in “net trading
income”. If the hedge no longer meets the criteria for hedge
accounting, the adjustment to the carrying amount of a hedged
item for which the effective interest method is used is
amortised to the income statement over the period to maturity.
The adjustment to the carrying amount of a hedged equity
security remains in retained earnings until the disposal of the
equity security.
b) Cash flow hedge
The effective portion of changes in the fair value of deri­
vatives that are designated and qualify as cash flow hedges
are recognised in equity. The gain or loss relating to the
ineffective portion is recognised immediately in the income
statement – “net trading income – transaction gains less
losses”. Amounts accumulated in equity are recycled to the
income statement in the periods when the hedged item
affects profit or loss. The gain or loss relating to the effective
portion of currency swaps and options are recorded in “net
trading income – foreign exchange – transaction gains less
losses”. When a hedging instrument expires or is sold,
or when a hedge no longer meets the criteria for hedge
accounting, any cumulative gain or loss existing in equity
at that time remains in equity and is recognised when the
forecast transaction is ultimately recognised in the income
statement. When a forecast transaction is no longer expected
Significant accounting policies continued
ABC Holdings Limited ANNUAL REPORT 201158
in the financial statements and are classified and measured
in accordance with the accounting policy on financial instru­
ments. Securities borrowed are not recognised in the financial
statements unless these are sold to third parties. In these
cases, the obligation to return the securities borrowed is
recorded at fair value as a trading liability. Income and expenses
arising from the securities borrowing and lending business
are recognised on an accrual basis over the period of the
transactions.
Property and equipment
Land and buildings are shown at fair value based on annual
valuations by external independent valuers under hyper­infla­
tionary economies, otherwise at least once every three years.
All other items of property and equipment are stated at cost
less accumulated depreciation and impairment losses. Where
parts of an item of property and equipment have different
useful lives, they are accounted for as separate items of
propertyandequipment.Surplusesanddeficitsarisingthereon
are transferred to the property revaluation reserve in equity.
The revaluation surplus or deficit is reversed when the asset
is disposed of. Owner-occupied properties are held for use
in the supply of services or for administrative purposes.
Depreciation is charged to the income statement on a straight-
line basis over the estimated useful life of the property and
equipment. Land is not depreciated. The estimated useful
lives are as follows:
•	 Buildings 40 – 50 years
•	 Bank premises and renovations 20 years
•	 Computer equipment 3 – 5 years
•	 Office equipment 3 – 5 years
•	 Furniture and fittings 5 – 10 years
•	 Vehicles 4 – 5 years
The assets’ residual values, depreciation methods and useful
lives are reviewed, and adjusted if appropriate, at each balance
sheet date. Subsequent costs are included in the asset’s
carrying amount or are recognised as a separate asset, as
appropriate only when it is probable that future economic
benefits associated with the item will flow to the Group. The
cost of day-to-day servicing of property and equipment are
recognised in the income statement as incurred.
Derecognition of financial
instruments
Financial assets are derecognised when the contractual
rights to receive cash flows from the financial assets have
expired, or where the Group has transferred its contractual
rights to receive cash flows on the financial asset such that
it has transferred substantially all the risks and rewards of
ownership of the financial asset. Any interest in transferred
financial assets that is created or retained by the Group is
recognised as a separate asset or liability. Financial liabilities
are derecognised when they are extinguished, that is when
the obligation is discharged, cancelled or expires. The Group
enters into transactions whereby it transfers assets recog­
nised on its balance sheet, but retains either all risks and
rewards of the transferred assets or a portion of them. If all
or substantially all risks and rewards are retained, then the
transferred assets are not derecognised from the balance
sheet. Transfers of assets with retention of all or substantially
all risks and rewards include securities lending and repurchase
agreements. When assets are sold to a third party with a
concurrent total rate of return swap on the transferred assets,
the transaction is accounted for as a secured financing trans­
action similar to repurchase transactions. In transactions
where the Group neither retains nor transfers substantially
all the risks and rewards of ownership of a financial asset, it
derecognises the asset if control over the asset is lost. The
rights and obligations retained in the transfer are recognised
separately as assets and liabilities as appropriate. In transfers
where control over the asset is retained, the Group continues
to recognise the asset to the extent of its continuing involve­
ment, determined by the extent to which it is exposed to
changes in the value of the transferred asset.
Repurchase agreements
Securities sold subject to linked repurchase agreements
(repos) are reclassified in the financial statements as pledged
assets when the transferee has the right by contract or
custom to sell or re-pledge the collateral. The liability to the
counterparty is included under deposit and current accounts.
Securities purchased under agreements to resell (reverse
repos) are recorded as loans granted under resale agree­
ments and included under loans and advances to other banks
or customers as appropriate. The difference between the
sale and repurchase price is treated as interest and amortised
over the life of the repurchase agreement using the effective
interest method. Securities lent to counterparties are retained
59
separately identifiable cash flows (cash generating units).
Non-financial assets other than goodwill that suffered an
impairment are reviewed for possible reversal of the impair­
ment at each reporting date.
Financial liabilities
Financial liabilities include deposits and other borrowed funds.
Deposits and other borrowed funds are initially measured at
fair value plus transaction costs and subsequently measured
at their amortised cost, using the effective interest method.
TheGroupderecognisesa financialliabilitywhenitscontractual
obligations are discharged or cancelled or expire.
Derivative financial instruments are dealt with in terms of
specific policy specified above.
Provisions and contingent
liabilities
Provisions are recognised when the Group has a present
legal or constructive obligation as a result of past events
and it is probable that an outflow of resources embodying
economic benefits will be required to settle the obligation
and a reliable estimate of the amount of the obligation can
be made. Provisions are determined by discounting the
expected future cash flows using a pre-tax discount rate that
reflects current market assessments of the time value of
money and, where appropriate, the risks specific to the
liability. A provision for restructuring is recognised when the
Group has approved a detailed formal plan, and the restruc­
turing either has commenced or has been announced publicly.
Future operating costs or losses are not provided for.
A provision for onerous contracts is recognised when the
expected benefits to be derived by the Group from a contract
are lower than the unavoidable cost of meeting its obligations
under the contract. The provision is measured at the present
value of the lower of the expected cost of terminating the
contract and the expected net cost of continuing with the
contract. Before a provision is established, the Group recog­
nises any impairment loss on the assets associated with that
contract. Contingent liabilities, which include certain guaran­
tees other than financial guarantees, and letters of credit
pledged as collateral security, are possible obligations that
arise from past events whose existence will be confirmed
only by the occurrence, or non-occurrence, of one or more
uncertain future events not wholly within the Group’s control.
Contingent liabilities are not recognised in the financial
Investment property
Investment properties are properties which are held by the
Group either to earn rental income or for capital appreciation
or for both. Investment property is stated at fair value
determined annually by an independent registered valuer
under hyper-inflationary economies, otherwise at least once
every three years. Fair value is based on open market value
and any gain or loss arising is recognised in the income
statement. Fair value adjustments on investment properties
are included in the income statement as investment gains or
losses in the period in which these gains or losses arise and
are adjusted for any double counting arising from the recog­
nition of lease income on the straight-line basis compared to
the accrual basis normally assumed in the fair value deter­
mination. The deemed cost for any reclassification between
investment properties and owner occupied properties is its
fair value, at the date of reclassification.
Other intangible assets
Software
Software acquired by the Group is stated at cost less accu­
mulated amortisation and accumulated impairment losses.
Subsequent expenditure on computer software is capitalised
onlywhenitincreasesthefutureeconomicbenefitsembodied
in the specific asset to which it relates. Amortisation is
recog­nised in the income statement on a straight-line basis
over the estimated useful life of the software, from the date
that it is available for use. The estimated useful life is three
to five years. Amortisation methods, useful lives and residual
values are reviewed at each financial year end and adjusted,
if necessary. There have been no changes in the estimated
useful lives from those applied in the previous financial year.
Impairment of non-financial
assets
Assets that have an indefinite useful life are not subject to
amortisation and are tested annually for impairment. Assets
that are subject to amortisation are reviewed for impairment
whenever events or changes in circumstances indicate that
the carrying amount may not be recoverable. An impairment
loss is recognised for the amount by which the asset’s carrying
amount exceeds its recoverable amount. The recover­able
amount is the higher of an asset’s fair value less costs to sell
and value in use. For the purposes of assessing impairment,
assets are grouped at the lowest levels for which there are
Significant accounting policies continued
ABC Holdings Limited ANNUAL REPORT 201160
Operating income
Income such as revenue derived from service fees, net
interest income, commissions, net surplus arising from
trading activities and other income are included in operating
income.
Interest
Interest income and interest expense are recognised in the
income statement for all interest-bearing financial instruments
on an accruals basis using the effective yield method except
for those classified as held for trading based on the original
settlement amount. The effective interest method is a method
of calculating the amortised cost of a financial asset or a
financial liability and of allocating the interest income or
interest expense over the relevant period. The effective
interest rate is the rate that exactly discounts estimated
future cash payments or receipts through the expected life
of the financial instrument or, when appropriate, a shorter
period to the net carrying amount of the financial asset or
financial liability. When calculating the effective interest rate,
the Group estimates cash flows considering all contractual
terms of the financial instrument (for example, prepayment
options) but does not consider future credit losses. The calcu­
lation includes all fees and points paid or received between
parties to the contract that are an integral part of the effective
interest rate, transaction costs and all other premiums or
discounts. Once a financial asset or a group of similar financial
assets has been written down as a result of an impairment
loss, interest income is recognised using the rate of interest
used to discount the future cash flows for the purpose of
measuring the impairment loss. Interest earned on accounts,
which have been in arrears for three months or more is
credited to an interest in suspense account. This interest is
only recognised in the income statement when the account
is no longer in arrears.
Fee and commission income
Fee and commission income arises from services provided
by the Group, including cash management, project and struc­
tured trade finance transactions. Fee and commission income
is recognised when the corresponding service is provided
and receipt of the fee is certain. Loan commitment fees for
loans that are not expected to be drawn down are recognised
on a straight-line basis over the commitment period.
statements but are disclosed in the notes to the financial
statements.
Managed funds and trust
activities
Certain companies in the Group operate unit trusts, hold and
invest funds on behalf of clients and act as trustees and in
other fiduciary capacities. Assets and liabilities representing
such activities are not included on the balance sheet, as
these relate directly to clients. Income from these activities
is brought into account over the period to which the service
relates.
Share capital
Preference share capital
Preference share capital is classified as equity if it is non­
redeemable and any dividends are discretionary at the option
of the directors. Preference share capital is classified as a
liability if it is redeemable on a specific date or at the option
of the shareholders and dividends thereon are recognised in
the income statement as an interest expense.
Repurchase of share capital
Shares repurchased by Group companies are classified as
treasury shares, and held at cost. These shares are treated
as a deduction from the issued share capital and the cost
price of the shares is presented as a deduction from total
equity. Fair value changes recognised in the subsidiary’s
financial statements on equity investments in the holding
entity’s shares, are reversed on consolidation and dividends
received are eliminated against dividends paid. Where such
shares are subsequently sold or re-issued, any consideration
received is included in shareholders’ equity.
Dividends
Dividends are recognised as a liability in the period in which
they are declared.
Share issue costs
Incremental costs directly attributable to the issue of new
shares or options or to the acquisition of a business are shown
in equity as a deduction, net of tax, from the proceeds.
61
the value of the lease amount receivable and accounted for
over the lease term as an adjustment to the effective rate of
return. The benefits arising from investment allowances on
assets leased to clients are accounted for in tax. Leases of
assets under which the lessor effectively retains all the risks
and benefits of ownership are classified as operating leases.
Receipts of operating leases from properties held as invest­
ment properties in investment management net of any incen­
tives given to lessees, are accounted for as rental income on
the straight-line basis over the period of the lease. When an
operating lease is terminated before the lease period has
expired, any payment required by the lessee by way of penalty
is recognised as income in the period in which termination
takes place.
Repossessed assets
Repossessed assets are not brought on balance sheet until
they are sold off to extinguish or reduce the outstanding
debt.
Employee benefits
Defined contribution plans
In terms of certain employment contracts, the Group provides
for medical aid contributions to qualifying employees beyond
the date of normal retirement. Although these benefits are a
defined benefit plan, the full liability has not been recognised
as the number of employees affected is very small. The
contributions are recognised as an expense in the income
statement as incurred.
Termination benefits
The Group recognises gratuity and other termination benefits
in the financial statements when it has a present obligation
relating to termination.
Leave pay accrual
The Group’s obligation in respect of accumulated leave days
is recognised in full in the financial statements, on an undis­
counted basis and is expensed as the related services are
provided.
Taxation
Income tax on the profit or loss for the year comprises
current and deferred tax. Current tax is the expected tax
payable on the taxable income for the year, using tax rates
Net trading income
Net trading income includes realised gains and losses arising
from trading in financial assets and liabilities and unrealised
changes in fair value of these instruments.
Dividends
Dividend income is recognised in the income statement on
the date that the dividend is declared.
Rental income
Rental income from investment property is recognised in
the income statement on a straight-line basis over the term
of the lease. Lease incentives granted are recognised as an
integral part of total rental income.
Leases
Group as lessee
Leases where the Group assumes substantially all the risks
and rewards of ownership are classified as finance leases.
Finance leases are capitalised at the leases’ inception at the
lower of the fair value of the leased asset and the present
value of the minimum lease payments. Lease payments
are separated using the interest rate implicit in the lease to
identify the finance cost, which is charged against income
overtheleaseperiod,andthecapitalrepayment,whichreduces
the liability to the lessor. Leases of assets are classified as
operating leases if the lessor effectively retains all the risks
and rewards of ownership. Payments made under operating
leases, net of any incentives received from the lessor are
charged to the income statement on a straight-line basis
over the period of the lease. When an operating lease is
terminated before the lease period has expired, any payment
required to be made to the lessor by way of penalty is
recognised as an expense in the period in which termination
takes place.
Group as lessor
Lease and instalment sale contracts are primarily financing
transactions in banking activities, with rentals and instal­ments
receivable, less unearned finance charges, being included in
loans and advances on the balance sheet. Finance charges
earned are computed using the effective interest method,
which reflects a constant periodic return on the investment
in the finance lease. Initial direct costs paid are capitalised to
Significant accounting policies continued
ABC Holdings Limited ANNUAL REPORT 201162
reduced to the extent that it is no longer probable that the
related tax benefit will be realised. Current and deferred
tax relating to items that are charged or credited directly to
equity, are also charged or credited directly to equity and are
subsequently recognised in the income statement when the
related deferred gain or loss is recognised.
Segmental reporting
Operating segments are reported in a manner consistent
with the internal reporting provided to the chief operating
decision maker. The chief operating decision maker is the
person or group that allocates resources to and assesses
the performance of the operating segments of an entity. The
Group has determined the Group Executive Committee as
its chief operating decision maker. All transactions between
business segments are conducted on an arm´s length basis,
with intra-segment revenue and costs being eliminated in
head office. Income and expenses directly associated with
each segment are included in determining business segment
performance. In accordance with IFRS  8, the Group has
the following business segments: Banking operations in
Botswana, Mozambique, Tanzania, Zambia and Zimbabwe
and non­-banking operations arising from ABCH and non-
banking subsidiaries.
enacted or substantively enacted at the balance sheet date,
and any adjustment to tax payable in respect of previous
years. Additional income taxes that arise from the distribution
of dividend are recognised at the same time as the liability
to pay the related dividend is recognised. Deferred tax is
provided using the balance sheet liability method, providing
for temporary differences between the carrying amounts of
assets and liabilities for financial reporting purposes and the
amounts used for taxation purposes. Deferred tax assets or
liabilities are measured using tax rates enacted or substan­
tively enacted at the balance sheet date. Deferred tax is not
recognised for the following temporary differences:
•	 the initial recognition of goodwill;
•	 the initial recognition of assets and liabilities, in a trans­
action that is not a business combination, which affects
neither accounting nor taxable profits or losses; and
•	 investments in subsidiaries and joint ventures (excluding
mutual funds) where the Group controls the timing of the
reversal of temporary differences and it is probable that
these differences will not reverse in the foreseeable future.
A deferred tax asset is recognised only to the extent that it
is probable that future taxable profits will be available against
which the asset can be utilised. Deferred tax assets are
63
power to authorise credit exposures. Each subsidiary has a
credit committee which operates within the defined limits
set by the Board. These committees are responsible for the
management of credit risk within their country including,
credit decisions, processes, legal and documentation risk
and compliance with impairment policies.
TheGroupRiskdepartmentregularlyreviewseachsubsidiary’s
adherence to required standards.
The Executive Committee reports to the Board and is respon­
sible for approval of credit decisions that are above country
limits, recommendations on exposure limits and impairment
policies.
The Group has adopted standard impairment policies which
at a minimum comply with the prudential guidelines of the
respective countries’ central banks. Impairments are deter­
mined monthly at subsidiary level and are subject to regular
review by Group Risk.
Credit risk management
Loans and advances
In measuring credit risk of loans and advances to customers
and to banks at a counterparty level, the Group considers
three components: the probability of default by the client
or counterparty on its contractual obligations; the current
exposures to the counterparty and its likely future develop­
ment; and the likely recovery on the defaulted obligations.
These credit risk measurements, which reflect expected
loss, are embedded in the Group’s daily operational manage­
ment. The operational measurements are contrasted with
impairment allowances required under IAS 39, which are
based on losses that have been incurred at the balance
sheet date.
The Group assesses the probability of default of individual
counterparties using internal rating tools tailored to the various
categories of counterparties. They have been developed
inter­nally and combine statistical analysis for certain cate­
gories, as well as credit officer judgement. Clients of the
Group are segmented into five rating classes. The Group’s
rating scale, which is shown below, reflects the range of
default probabilities defined for each rating class. This means
that, in principle, exposures migrate between classes as the
assessment of their probability of default changes. The rating
tools are kept under review and upgraded as necessary. The
Group regularly validates the performance of the rating and
their predictive power with regard to default events.
financial risk management
The Group’s activities exposes it to a variety of financial risks
and those activities involve the analysis, evaluation, accept­
anceandmanagementofsomedegreeofriskoracombination
of risks. Taking risk is core to the financial business, and the
operational risks are an inevitable consequence of being in
business. The Group’s aim is therefore to achieve an appro­
priate balance between risk and return and minimise potential
adverse effects on the Group’s financial performance.
The Group’s risk management policies are designed to identify
and analyse these risks, to set appropriate risk limits and
controls, and to monitor the risks and adherence to limits by
means of reliable and up-to-date information systems. The
Group regularly reviews its risk management policies and
systemstoreflectchangesinmarkets,productsandemerging
best practice.
Risk management is carried out by Group Risk, under policies
approved by the Board of Directors. The Board approves
principles for overall risk management as well as policies
covering specific areas, such as foreign exchange risk, interest
rate risk, credit risk, use of derivative financial instruments
and non-derivative financial instruments. In addition, internal
audit is responsible for the independent review of risk man­
age­ment and the control environment. The most important
types of risk are credit risk, liquidity risk, market risk and
operational risk. Market risk includes currency risk, interest
rate and price risk.
Credit risk
The Group takes on exposure to credit risk, which is the risk
that a counterparty will cause a financial loss for the Group
by failing to discharge an obligation. Significant changes in
the economy, or in the health of a particular industry segment
that represents a concentration in the Group’s portfolio,
could result in losses that are different from those provided
for at the balance sheet date. Country (or Sovereign) risk is
part of overall credit risk and is managed as part of the credit
risk management function as it has a major impact on
indi­vidual counterparties’ ability to perform. Management
there­fore carefully manages its exposure to credit risk. Credit
exposures arise principally in loans and advances, debt secu­
rities and other bills. There is also credit risk in off-balance
sheet financial arrangements such as loan commitments. The
Group Risk team reviews subsidiary risk exposures regularly,
and reports to the Board of Directors.
The Board has defined and documented a credit policy for
the Group which forms the basis of credit decisions. This
policy includes a framework of limits and delegation of credit
approval authority that are strictly adhered to; refer to “Risk
and Governance” – page 28. No one individual has the
ABC Holdings Limited ANNUAL REPORT 201164
Risk limit control and
mitigation policies
The Group manages, limits and controls concentrations of
credit risk in respect of individual counterparties and groups,
and to industries and countries. The Group structures the
levels of credit risk it undertakes by placing limits on the
amount of risk accepted in relation to one borrower, or groups
of borrowers, and to geographical and industry segments.
Such risks are monitored on a revolving basis and subject
to an annual or more frequent review, when considered
necessary. Limits on the level of credit risk by product,
industry sector and by country are approved by the Board
of Directors, and reviewed regularly. Exposure to credit risk
is also managed through regular analysis of the ability of
borrowers and potential borrowers to meet interest and
capital repayment obligations and by changing these lending
limits where appropriate. Some other specific control and
mitigation measures are outlined below.
(a) Collateral
The Group employs a range of policies and practices to
mitigate credit risk. The most traditional of these is the taking
of security for funds advanced, which is common practice.
The Group implements guidelines on the acceptability of
specific classes of collateral for credit risk mitigation. The
principal collateral types for loans and advances are:
•	 cash collateral;
•	 charges over assets financed;
•	 mortgages over residential and commercial properties;
Group’s internal rating scale
Category Description
Performing The credit appears satisfactory
Special mention The credit appears satisfactory but exhibits potential or inherent weaknesses which, if not attended
to, may weaken the asset or prospects of collection in full e.g. poor documentation or 30 days but less
than 90 days in arrears
Sub-standard The credit has defined weaknesses that may jeopardise liquidation of the debt i.e the paying capacity
of the borrower is doubtful or inadequate, or more than 90 days but less than 180 days in arrears
Doubtful Credit facilities with above weaknesses and has deteriorated further to the extent that even with the
existing security, full recovery will not be possible, or 180 days but less than 12 months in arrears
Loss Facilities considered impossible to collect with little or no realisable security, or more than 12 months
in arrears
•	 charges over business assets such as premises, inventory
and accounts receivable; and
•	 charges over financial instruments such as debt securities
and equities.
Loans and advances to corporates are generally secured. In
addition, in order to minimise credit loss, the Group will seek
additional collateral from the counterparty as soon as impair­
ment indicators are noticed for the relevant individual loans
and advances. Collateral held as security for financial assets
other than loans and advances is determined by the nature
of the instrument. Debt securities, treasury and other eligible
bills are generally unsecured, with the exception of asset-
backed securities and similar instruments, which are secured
by portfolios of financial instruments.
(b) Master netting arrangements
The Group further restricts its exposure to credit losses
by entering into master netting arrangements with counter­
parties with which it undertakes a significant volume of
transactions. Master netting arrangements do not generally
result in an offset of balance sheet assets and liabilities, as
transactions are usually settled on a gross basis. However,
the credit risk associated with favourable contracts is reduced
by a master netting arrangement to the extent that if a default
occurs, all amounts with the counterparty are terminated
and settled on a net basis. The Group’s overall exposure to
credit risk on derivative instruments subject to master netting
arrangements can change substantially within a short period,
asitisaffectedbyeachtransactionsubjecttothearrangement.
65
Financial risk management continued
(d) Derivatives
The Group maintains strict control limits on net open derivative
positions (that is, the difference between purchase and sale
contracts) by both amount and term. The amount subject
to credit risk is limited to expected future net cash inflows
of instruments, which in relation to derivatives are only a
fraction of the contract, or notional values used to express
the volume of instruments outstanding. This credit risk
exposure is managed as part of the overall lending limits
with customers, together with potential exposures from
market movements. Collateral or other security is not always
obtained for credit risk exposures on these instruments,
except where the Group requires margin deposits from
counter­parties.
Impairment policies
The impairments shown in the balance sheet at year-end are
derived from each of the five internal rating grades, adjusted
for the provision of IAS 39. The table below shows the
percentage of the Group’s on-and-off balance sheet items
relating to loans and advances and the associated impairment
for each of the Group’s internal rating categories.
(c) Credit-related commitments
The primary purpose of these instruments is to ensure that
funds are available to a customer as required. Guarantees
and standby letters of credit carry the same credit risk as
loans. Documentary and commercial letters of credit – which
are written undertakings by the Group on behalf of a
customer authorising a third party to draw drafts on the
Group up to a stipulated amount under specific terms and
conditions – are collateralised by the underlying shipments
of goods to which they relate and therefore carry less risk
than a direct loan.
Commitments to extend credit represent unused portions
of authorisations to extend credit in the form of loans,
guarantees or letters of credit. With respect to credit risk on
commitments to extend credit, the Group is potentially
exposed to loss in an amount equal to the total unused
commitments. However, the likely amount of loss is less
than the total unused commitments, as most commitments
to extend credit are contingent upon customers maintaining
specific credit standards. The Group monitors the term
to  maturity of credit commitments because longer-term
commitments generally have a greater degree of credit risk
than shorter-term commitments.
Impairments classification
2011 2010
Category
Loans and
advances (%)
Impairments
(%)
Loans and
advances (%)
Impairments
(%)
Performing 87% 17% 86% 19%
Special mention 6% 8% 6% 8%
Sub-standard 4% 15% 3% 6%
Doubtful 1% 7% 1% 12%
Loss 2% 53% 4% 55%
100% 100% 100% 100%
Impairments are managed on an expected loss basis, and are recorded on an actual loss basis.
The internal rating tool assists management to determine whether objective evidence of impairment exists under IAS 39,
based on the following criteria set out by the Group:
•	 delinquency in contractual payments of principal or interest;
•	 cash flow difficulties experienced by the borrower;
•	 breach of loan covenants or conditions;
•	 initiation of bankruptcy proceedings;
•	 deterioration of the borrower’s competitive position;
•	 deterioration in the value of collateral; and
•	 downgrading below “Performing” level.
ABC Holdings Limited ANNUAL REPORT 201166
Maximum exposure to credit risk before
collateral held or other credit enhancements
The following table presents the maximum exposure to
credit risk of balance sheet and off-balance sheet financial
instruments, before taking into account any collateral held or
othercreditenhancementsunlesssuchcreditenhancements
meet offsetting requirements. For financial assets recognised
on the balance sheet, the exposure to credit risk equals their
carrying amount before deducting impairments. For financial
guarantees granted, the maximum exposure to credit risk is
the maximum amount that ABC Holdings Limited would
have to pay if the guarantees are called upon. For loan com­
mit­ments and other credit related commitments that are
irrevocableoverthelifeoftherespectivefacilities,themaximum
exposure to credit risk is the full amount of the committed
facilities. Investment in associates and listed equities have
been excluded as they are regarded as primarily exposing
the Group to market risk.
The Group’s policy requires the review of individual financial
assets at least once a month, or more regularly when
individual circumstances require. Impairment allowances
on individually assessed accounts are determined by an
evaluation of the incurred loss at balance-sheet date on
a case-by-case basis, and are applied to all individually
significantaccounts.Theassessmentnormallyencompasses
collateral held (including re-confirmation of its enforceability)
and the anticipated receipts for that individual account.
Collectively assessed impairment allowances are provided
for: (i) portfolios of homogenous assets that are individually
below materiality thresholds; and (ii) losses that have been
incurredbuthavenotyetbeenidentified,byusingtheavailable
historical experience, experienced judgement and statistical
techniques.
Credit risk exposures relating to on-balance sheet assets are as follows:
BWP‘000s 2011 2010
Placements with other banks 1,114,126 924,561
Derivative financial assets 32,337 42,012
Financial assets held for trading 651,049 1,117,827
–  Government bonds 52,747 102,766
–  Corporate bonds 26,709 5,677
–  Treasury bills 571,593 1,007,913
–  Bankers acceptances and commercial paper – 1,471
185,412 75,034
Financial assets designated at fair value 185,412 75,034
Loans and advances to customers at amortised cost 6,294,959 3,216,575
–  Mortgage lending 65,201 14,659
–  Instalment finance 331,826 320,602
–  Corporate lending 4,440,053 2,567,327
–  Commercial and property finance 169,531 45,151
–  Micro-finance lending 354,374 135,870
–  Consumer lending 933,974 132,966
Investment securities 42,172 38,502
–  Promissory notes 42,172 38,502
Prepayments and receivables 172,000 188,306
Current tax assets 8,458 6,388
8,500,513 5,609,205
Contingent liabilities
Credit exposures relating to off-balance sheet items are as follows:
Guarantees 337,516 210,146
Loan commitments and other credit related facilities 95,387 129,805
432,903 339,951
67
74% (2010: 57%) of the total maximum exposure is derived from loans and advances, while 8% (2010: 20%) represents
financial assets held for trading.
Management is confident in its ability to continue to control and sustain minimal exposure of credit risk to the Group resulting
from both its loans and advances portfolio and financial assets held for trading based on the following:
•	 93% (2010: 92%) of the gross loans and advances portfolio is categorised in the top two grades of the internal rating system;
•	 87% (2010: 86%) of the gross loans and advances portfolio is considered to be “neither past due nor impaired”;
•	 7% (2010: 8%) of gross loans and advances are “individually impaired”;
•	 the Group continues to improve its credit selection and monitoring processes; and
•	 loans and advances to corporates are generally backed by collateral.
Nature of security held
The nature of security held ranges from cash security, assets financed, bonds over residential and commercial property, shares
and stock in trade.
Credit quality
Loans and advances
The following tables reflect broadly, stable credit quality across the majority of the Group’s businesses.
Distribution of loans and advances by credit quality:
BWP‘000s 2011 2010
Neither past due nor impaired 5,472,461 2,765,645
Past due but not impaired 404,327 182,600
Individually impaired 418,171 268,330
Gross loans and advances 6,294,959 3,216,575
Less: Allowance for impairment (217,560) (138,465)
Net loans and advances 6,077,399 3,078,110
The total impairment of loans and advances is BWP217.6 million (2010: BWP138.5 million).
Further information on the impairment allowance for loans and advances to customers is provided in Notes 2 and 10.
During the year ended 31 December 2011, the Group’s total gross loans and advances increased by 95% (2010: increased by
51%), attributable to improved economic activity in the markets the Group operates in. Loans and advances to the corporate
sector continue to form the bulk of the Group’s lending portfolio, but consumer and micro-finance lending also grew strongly
as the Group continues to expand in the Retail market segment.
Financial risk management continued
ABC Holdings Limited ANNUAL REPORT 201168
(a) Distribution of loans and advances neither past due nor impaired
The credit quality of the portfolio of loans and advances that were neither past due nor impaired can be assessed by reference
to the internal rating system adopted below:
Internal Grade: Performing
BWP’000s 2011 2010
Mortgage lending 56,973 14,659
Instalment finance 266,236 283,447
Corporate lending 3,791,223 2,192,573
Commercial and property finance 150,220 45,151
Micro-finance lending 354,374 103,231
Consumer lending 853,435 126,584
5,472,461 2,765,645
(b) Loans and advances past due but not impaired: age analysis
Internal Grade: Special mention
Late processing and other administrative delays on the side of the borrower can lead to a financial asset being past due but
not impaired.
Therefore, loans and advances less than 90 days past due are not usually considered impaired, unless other information is
available to indicate the contrary. Gross amount of loans and advances by class to customers that were past due but not
impaired were as follows:
2011
BWP’000s
Days past due
1 – 30 days 31 – 60 days 61 – 90 days Total
Internal Grade: Special mention
Mortgage lending 3,095 3,047 – 6,142
Instalment finance 15,378 10,601 340 26,319
Corporate lending 140,865 143,776 49,682 334,323
Commercial and property finance 5,118 – – 5,118
Consumer lending 27,796 1,546 3,083 32,425
192,252 158,970 53,105 404,327
2010
BWP’000s
Days past due
1 – 30 days 31 – 60 days 61 – 90 days Total
Internal Grade: Special mention
Instalment finance 439 697 3,379 4,515
Corporate lending 27,492 113,864 12,396 153,752
Micro-finance lending 24,333 – – 24,333
52,264 114,561 15,775 182,600
Upon initial recognition of loans and advances, the fair value of collateral is based on valuation techniques commonly used for the
corresponding assets. In subsequent periods, the fair value is updated by reference to market price or indexes of similar assets.
Collateral taken for this category includes cash, mortgages over residential properties, charges over business assets such as
premises, inventory and accounts receivable, and charges over financial instruments such as debt securities and equities.
All micro-finance lending past due in 2011 was categorised as “individually impaired” advances.
69
(c) Loans and advances individually impaired
The individually impaired loans and advances before taking into consideration the cash flows from collateral held is
BWP418.2 million (2010: BWP268.3 million).
The breakdown of the gross amount of individually impaired loans and advances by class, along with the fair value of related
collateral held by the Group as security, is as follows:
2011 2010
BWP’000s Gross loans
Fair value
collateral
Under-
collateral-
isation* Gross loans
Fair value
collateral
Under-
collateral-
isation*
Mortgage lending 2,086 2,086 – – – –
Instalment finance 39,271 17,890 21,381 32,640 8,458 24,182
Corporate lending 314,507 134,440 180,067 221,003 128,457 92,546
Micro-finance lending – – – 8,305 – 8,305
Commercial and property
finance 14,193 14,193 – – – –
Consumer lending 48,114 – 48,114 6,382 253 6,129
418,171 168,609 268,330 137,168
* The under-collateralisation amount is considered for impairment. It includes an exposure in the ABC Holdings Company stand-alone financial statements
of BWP91.6 million. The exposure is meeting the terms of a repayment plan agreed to subsequent to the financial year-end. Interest of BWP28.2 million
was not recognised on this exposure during the financial year. This interest amount is not recoverable in terms of the repayment plan.
Collateral taken for this category includes cash, mortgages over residential properties, charges over business assets such as
premises, inventory and accounts receivable, and charges over financial instruments such as debt securities and equities.
(d) Loans and advances renegotiated
Restructuring activities include extended payment arrangements, approved external management plans, modification and
deferral of payments. Following restructuring, a previously overdue customer account is reset to a normal status, and managed
together with other similar accounts. Restructuring policies and practices are based on indicators or criteria which, in the
judgement of local management, indicate that payment will most likely continue. These policies are kept under continuous
review. Renegotiated loans totalled BWP27.2 million at 31 December 2011 (2010: BWP179.2 million).
BWP’000s 2011 2010
Mortgage lending 942 –
Corporate lending 24,941 179,189
Consumer lending 1,324 –
27,207 179,189
Repossessed collateral
During 2011, the Group obtained assets by taking possession of collateral held as security, as follows:
Nature of assets 2011 2010
Property – 2,655
Cash security – 1,005
Motor vehicles 50 589
Carrying amount 50 4,249
Repossessed properties are sold as soon as practical, with the proceeds used to reduce the outstanding indebtedness.
Repossessed property is classified in the balance sheet under prepayments and other receivables.
Financial risk management continued
ABC Holdings Limited ANNUAL REPORT 201170
Other classes of financial assets
All other classes of financial assets are allocated the internal grade “performing” and are neither past due nor impaired.
These classes of financial assets are subjected to the same credit processes as loans and advances.
Concentration risk of financial assets with credit risk exposure
(a) Geographical sectors
The following table breaks down the Group’s main credit exposure at their carrying amounts, as categorised by geographical
regions as of 31 December 2011.
For this table, the Group has allocated exposures to regions based on the country of domicile of its counterparties.
2011
BWP’000s Botswana
Mozam-
bique Tanzania Zambia Zimbabwe Other Total
Placements with
other banks 286,932 198,364 235,938 167,552 114,457 110,883 1,114,126
Financial assets held
for trading 418,406 119,904 49,073 36,957 26,709 – 651,049
Financial assets
designated at fair value – – – – 110,421 74,991 185,412
Derivative financial
assets 1,230 135 4,710 63 2 26,197 32,337
Loans and advances
(net of impairments) 1,410,762 761,938 582,758 603,581 2,684,717 33,643 6,077,399
Investment securities 42,172 – – – – – 42,172
Prepayments and other
receivables 3,868 4,467 15,286 10,166 134,835 3,378 172,000
Current tax asset – – 8,458 – – – 8,458
2,163,370 1,084,808 896,223 818,319 3,071,141 249,092 8,282,953
2010
BWP’000s Botswana
Mozam-
bique Tanzania Zambia Zimbabwe Other Total
Placements with
other banks 236,194 121,738 123,241 87,918 329,903 25,567 924,561
Financial assets held
for trading 884,934 77,897 126,693 20,328 7,975 – 1,117,827
Financial assets
designated at fair value – – – – 75,034 – 75,034
Derivative financial
assets 4,683 13,811 4,054 – – 19,464 42,012
Loans and advances
(net of impairments) 636,601 401,713 436,332 232,721 1,365,069 5,674 3,078,110
Investment securities 38,502 – – – – – 38,502
Prepayments and other
receivables 6,084 16,417 21,924 15,033 122,811 6,037 188,306
Current tax asset 751 1,564 733 3,340 – – 6,388
1,807,749 633,140 712,977 359,340 1,900,792 56,742 5,470,740
71
Market risk
The Group takes on exposure to market risks, which is the risk that the fair value of future cash flows of a financial instrument
will fluctuate because of changes in market prices. Market risks arise from open positions in interest rate, currency and equity
products, all of which are exposed to general and specific market movements and changes in the level of volatility of market
rates or prices such as interest rate, credit spreads, foreign exchange rates and equity prices.
Market and foreign currency exposures related to dealing positions are housed and managed in the Treasury division within a
framework of pre-approved dealer, currency and counterparty limits.
All trading positions are marked to market as required by IAS 39.
Group Risk is responsible for monitoring of limits and pricing, thereby ensuring that any errors or unauthorised transactions are
promptly identified.
The currency exposure that arises as a result of the Group’s continuing expansion and cross-border investment activities is
managed through the Executive Committee and the Group Asset and Liability Committee.
The following table breaks down the Group’s main credit exposure at their carrying amounts, as categorised by the industry
sectors of the counterparties.
2011
BWP‘000s Agriculture Construction
Wholesale,
retail and
trade Public sector Manufacturing
Placements with other banks – – – – –
Financial assets held for trading – 7,692 1,547 49,073 –
Financial assets designated
at fair value 77,125 – – – 14,390
Derivative financial assets – – 135 – –
Loans and advances 520,430 349,656 1,137,253 130,781 574,760
Investment securities – – – – –
Prepayments and other receivables – – 17,209 – –
Current tax assets – – – 8,458 –
597,555 357,348 1,156,144 188,312 589,150
2010
BWP‘000s Agriculture Construction
Wholesale,
retail and
trade Public Sector Manufacturing
Placements with other banks – – – – –
Financial assets held for trading – – – 126,693 –
Financial assets designated
at fair value 64,028 – – – 11,006
Derivative financial assets – – – – –
Loans and advances 449,675 197,389 339,496 135,849 359,806
Investment securities – – – – –
Prepayments and other receivables – 3,224 671 – –
Current tax assets – – – – –
513,703 200,613 340,167 262,542 370,812
Financial risk management continued
ABC Holdings Limited ANNUAL REPORT 201172
Mining
Financial
services
Transport
 energy Individuals Tourism Other Total
– 1,114,126 – – – – 1,114,126
– 575,267 – – – 17,470 651,049
– 93,897 – – – – 185,412
– 32,202 – – – – 32,337
842,833 516,236 292,734 1,256,703 94,851 361,162 6,077,399
– 42,172 – – – – 42,172
– 116,803 – – – 37,988 172,000
– – – – – – 8,458
842,833 2,490,703 292,734 1,256,703 94,851 416,620 8,282,953
Mining
Financial
Services
Transport
 energy Individuals Tourism Other Total
– 924,561 – – – – 924,561
– 983,159 – – – 7,975 1,117,827
– – – – – – 75,034
– 42,012 – – – – 42,012
539,434 301,227 157,084 259,716 62,260 276,174 3,078,110
– 38,502 – – – – 38,502
4,462 121,460 – – – 58,489 188,306
– – – – – 6,388 6,388
543,896 2,410,921 157,084 259,716 62,260 349,026 5,470,740
Market risk measurement techniques
The major measurement techniques used to measure and control market risk are outlined below.
Foreign exchange risk
The Group takes on exposure to the effects of fluctuations in the prevailing foreign currency exchange rates on its financial
position and cash flows. Group Risk sets limits on the level of exposure by currency and in aggregate for both overnight and
intra-day positions, which are monitored daily. The table below summarises the Group’s exposure to foreign currency exchange
rate risk at 31 December 2011. Included in the table are the Group’s assets and liabilities at carrying amounts, categorised by
currency.
73
Concentration of currency risk: On-and-off balance sheet financial instruments
At 31 December 2011
BWP’000s EUR USD BWP ZAR
Cash and short-term funds 47,371 533,626 302,208 54,662
Financial assets held for trading 451 27,588 418,406 –
Financial assets designated at fair value – 185,412 – –
Derivative financial asset* – 4,594 6,091 1,327
Loans and advances 21,228 3,292,744 1,465,953 2,077
Investment securities – 9,266 42,172 –
Prepayments and other receivables 1,527 150,478 1,986 1,277
Current tax asset – – – –
Investment in associates – 4,472 11,275 –
Property and equipment – 219,737 134,475 33,022
Investment property – 2,021 – –
Intangible assets – 16,164 52,252 9
Deferred tax asset – 25,255 15,064 444
70,577 4,471,357 2,449,882 92,818
Deposits 70,909 3,216,730 2,255,519 50,026
Derivative financial liabilities* – 151,959 – –
Creditors and accruals 100 61,549 24,746 10,813
Current tax liabilities – 17,250 5,322 –
Deferred tax liabilities – 443 4,485 –
Borrowed funds 4,942 573,220 275,540 –
75,951 4,021,151 2,565,612 60,839
Net on-balance sheet position (5,374) 525,336 (190,860) 31,979
Credit commitments 52,995 272,999 36,742 57,955
* Notional amounts have been reported in the currency columns and adjustments made in “Other” to arrive at the fair values.
At 31 December 2010
BWP’000s EUR USD BWP ZAR
Cash and short-term funds 51,299 566,303 153,555 32,363
Financial assets held for trading 402 7,573 884,934 –
Financial assets designated at fair value – 79,139 – –
Derivative financial asset* 26,375 129,202 19,283 55,224
Loans and advances 17,201 1,798,021 677,144 7,335
Investment securities – 5,576 38,502 –
Prepayments and other receivables 5 136,290 2,463 415
Current tax asset – – 751 –
Investment in associates – 16,551 15,370 –
Property and equipment 242 111,338 116,860 37,241
Investment property – 3,878 – –
Intangible assets – – 45,857 –
Deferred tax asset – 15,618 (2,248) 468
95,524 2,869,489 1,952,471 133,046
Deposits 153,242 1,990,750 1,653,411 94,425
Derivative financial liabilities* 1,064 255,621 29,036 7,715
Creditors and accruals 91 25,656 11,763 6,919
Current tax liabilities – 15,846 (11,599) –
Deferred tax liabilities – 5,678 6,622 –
Borrowed funds 12,347 167,455 277,936 –
166,744 2,461,006 1,967,169 109,059
Net on-balance sheet position (71,220) 408,483 (14,698) 23,987
Credit commitments 24,853 17,535 31,182 60,405
* Notional amounts have been reported in the currency columns and adjustments made in “Other” to arrive at the fair values.
Financial risk management continued
ABC Holdings Limited ANNUAL REPORT 201174
TZS ZMK MZN JPY Other Total
117,438 35,486 131,153 12,859 8,628 1,243,431
47,742 36,957 119,905 – – 651,049
– – – – – 185,412
– – 216 125,214 (105,105) 32,337
249,866 363,753 573,533 – 108,245 6,077,399
31,314 1,363 – – 2,059 86,174
6,376 4,424 1,793 – 4,139 172,000
– – – – 8,458 8,458
1,792 – – – – 17,539
23,859 34,796 68,991 – – 514,880
– – – – – 2,021
19,518 6,376 36,043 – – 130,362
6,200 15,863 – – – 62,826
504,105 499,018 931,634 138,073 26,424 9,183,888
583,897 358,311 789,209 14,013 36,086 7,374,700
– – 216 – (105,106) 47,069
7,442 11,321 10,266 – 4,190 130,427
– 1,612 3,433 – – 27,617
1,756 – 3,036 – – 9,720
742 – – 125,212 2,132 981,788
593,837 371,244 806,160 139,225 (62,698) 8,571,321
(89,732) 127,774 125,474 (1,152) 89,122 612,567
12,212 – – – – 432,903
TZS ZMK MZN JPY Other Total
86,179 8,921 78,530 13,149 9,039 999,338
126,693 20,328 77,897 – – 1,117,827
– – – – – 79,139
139,493 15,837 – 19,628 (363,030) 42,012
203,471 107,377 267,504 – 57 3,078,110
8,592 353 – – – 53,023
17,300 16,707 15,126 – – 188,306
733 3,339 1,565 – – 6,388
2,924 – – – – 34,845
13,971 9,987 40,579 – – 330,218
– – – – – 3,878
1,535 2,313 7,697 – – 57,402
2,890 4,225 – – – 20,953
603,781 189,387 488,898 32,777 (353,934) 6,011,439
384,341 174,286 437,463 11,281 7,846 4,907,045
53,426 4,841 13,023 2 (363,681) 1,047
4,629 6,195 – – 8,764 64,017
1,154 1,418 – – – 6,819
– – 2,933 – – 15,233
602 – – 121,080 – 579,420
444,152 186,740 453,419 132,363 (347,071) 5,573,581
159,629 2,647 35,479 (99,586) (6,863) 437,858
91,816 31,274 43,064 1,659 38,163 339,951
75
Interest rate risk
Cash flow interest rate risk is the risk that the future cash flows of a financial instrument will fluctuate because of changes in
market interest rates. Fair value interest rate risk is the risk that the value of a financial instrument will fluctuate because of
changes in market interest rates. The Group takes on exposure to the effects of fluctuations in the prevailing levels of market
interest rates on both its fair value and cash flow risks. Interest margins may increase as a result of such changes but may
reduce losses in the event that unexpected movements arise. The Asset and Liability Committee (ALCO) is responsible for
managing interest rate and liquidity risk in the Group. Asset and Liability management committees have been established
in each subsidiary and meet on a monthly basis. They operate within the prudential guidelines and policies established by
Group ALCO.
In order to reduce interest rate risk, the majority of the Group’s lending is on a variable interest rate with a term of less than
one year. This approach has been adopted as a result of the scarcity of term deposits in the region that limits the Group’s ability
to build a substantial, stable pool of fixed rate funding.
The table below summarises the Group’s exposure to interest rate risks. It includes the Group’s financial instruments at
carrying amounts, categorised by the earlier of contractual re-pricing or maturity dates. Variable rate financial instruments are
categorised in the “up to 1 month” column.
2011
BWP’000s
Up to
1 month
1 – 3
months
3 – 12
months
1 – 5
years
Total
interest
sensitive
Non-
interest
bearing Total
Cash and short-term funds 506,658 184,439 – – 691,097 552,334 1,243,431
Financial assets held
for trading 79,971 405,150 98,857 48,054 632,032 19,017 651,049
Financial assets designated
at fair value 16,635 – – 149,869 166,504 18,908 185,412
Derivative financial assets – – – – – 32,337 32,337
Loans and advances 3,350,971 374,551 1,078,255 1,273,622 6,077,399 – 6,077,399
Investment securities – – – 43,599 43,599 42,575 86,174
Prepayments and other
receivables – – – – – 172,000 172,000
Current tax asset – – – – – 8,458 8,458
Investment in associates – – – – – 17,539 17,539
Property and equipment – – – – – 514,880 514,880
Investment property – – – – – 2,021 2,021
Intangible assets – – – – – 130,362 130,362
Deferred tax asset – – – – – 62,826 62,826
Assets 3,954,235 964,140 1,177,112 1,515,144 7,610,631 1,573,257 9,183,888
Equity – – – – – 612,567 612,567
Deposits 4,781,494 1,677,412 857,957 301 7,317,164 57,536 7,374,700
Derivative financial liabilities – – – – – 47,069 47,069
Creditors and accruals – – – – – 130,427 130,427
Current tax liabilities – – – – – 27,617 27,617
Deferred tax liability – – – – – 9,720 9,720
Borrowed funds 24,262 228,704 222,818 506,004 981,788 – 981,788
Liabilities 4,805,756 1,906,116 1,080,775 506,305 8,298,952 272,369 8,571,321
Total interest repricing gap (851,521) (941,976) 96,337 1,008,839 (688,321) 688,321 –
Financial risk management continued
ABC Holdings Limited ANNUAL REPORT 201176
2010
BWP’000s
Up to
1 month
1 – 3
months
3 – 12
months
1 – 5
years
Total
interest
sensitive
Non-
interest
bearing Total
Cash and short-term funds 357,223 37,460 13,938 – 408,621 590,717 999,338
Financial assets held
for trading 378,344 602,713 28,973 99,822 1,109,852 7,975 1,117,827
Financial assets designated
at fair value – – – 64,028 64,028 15,111 79,139
Derivative financial assets – – – – – 42,012 42,012
Loans and advances 1,649,168 501,197 439,560 488,185 3,078,110 – 3,078,110
Investment securities – – – 38,502 38,502 14,521 53,023
Prepayments and other
receivables – – – – – 188,306 188,306
Current tax asset – – – – – 6,388 6,388
Investment in associates – – – – – 34,845 34,845
Property and equipment – – – – – 330,218 330,218
Investment property – – – – – 3,878 3,878
Intangible assets – – – – – 57,402 57,402
Deferred tax asset – – – – – 20,953 20,953
Assets 2,384,735 1,141,370 482,471 690,537 4,699,113 1,312,326 6,011,439
Equity – – – – – 437,858 437,858
Deposits 2,719,674 1,535,951 627,545 23,875 4,907,045 – 4,907,045
Derivative financial liabilities – – – – – 1,047 1,047
Creditors and accruals – – – – – 64,017 64,017
Current tax liabilities – – – – – 6,819 6,819
Deferred tax liability – – – – – 15,233 15,233
Borrowed funds 20,607 96,721 4,331 457,761 579,420 – 579,420
Liabilities 2,740,281 1,632,672 631,876 481,636 5,486,465 87,116 5,573,581
Total interest repricing gap (355,546) (491,302) (149,405) 208,901 (787,352) 787,352 –
77
The tables below illustrates the impact of a possible 50 basis points interest rate movement for each banking subsidiary:
2011 2010
BWP’000s Pre-tax Post-tax Pre-tax Post-tax
BancABC Botswana
ABC Botswana constituted 28% of the Group’s total assets.
Change in net interest income (+50 basis points) 761 593 278 209
As a percentage of total Shareholders equity 0.47% 0.36% 0.26% 0.20%
Change in net interest income (-50 basis points) (761) (593) (278) (209)
As a percentage of total Shareholders equity -0.47% -0.36% -0.26% -0.20%
BancABC Zambia
ABC Zambia constituted 10% of the Group’s total assets.
Change in net interest income (+50 basis points) 322 193 65 39
As a percentage of total Shareholders equity 0.45% 0.27% 0.00% 0.00%
Change in net interest income (-50 basis points) (322) (193) (65) (39)
As a percentage of total Shareholders equity -0.45% -0.27% 0.00% 0.00%
BancABC Mozambique
ABC Mozambique constituted 13% of the Group’s total assets
Change in net interest income (+50 basis points) (66) (45) 296 201
As a percentage of total Shareholders equity -0.04% -0.03% 0.22% 0.17%
Change in net interest income (-50 basis points) 66 45 (296) (201)
As a percentage of total Shareholders equity 0.04% 0.03% 0.22% -0.17%
BancABC Tanzania
ABC Tanzania constituted 10% of the Group’s total assets
Change in net interest income (+50 basis points) 592 414 1,411 988
As a percentage of total Shareholders equity 0.60% 0.42% 1.45% 1.01%
Change in net interest income (-50 basis points) (592) (414) (1,411) (988)
As a percentage of total Shareholders equity -0.60% -0.42% -1.45% -1.01%
BancABC Zimbabwe
ABC Zimbabwe constituted 29% of the Group’s total assets
Change in net interest income (+50 basis points) -797 -591 3,108 2,308
As a percentage of total Shareholders equity -0.28% -0.21% 1.13% 0.88%
Change in net interest income (-50 basis points) 797 591 (3,108) (2,308)
As a percentage of total Shareholders equity 0.28% 0.21% -1.13% -0.88%
The interest rate sensitivity analyses set out in the table above are illustrative only and are based on simplified scenarios over
a period of one year.
Sensitivity analysis of market price
The Group holds, directly or through its associates, listed equities with a fair value of BWP33.3 million (2010: BWP17.4 million).
The Group is therefore exposed to gains or losses related to the variability in the market prices of the equities held.
Liquidity risk
Liquidity risk is the risk that the Group is unable to meet its obligations when they fall due as a result of customer deposits
being withdrawn, cash requirements from contractual commitments, or other cash outflows, such as debt maturities or
margin call for derivatives. Such outflows would deplete available cash resources for client lending, trading activities and
investments. In extreme circumstances, lack of liquidity could result in reductions in the consolidated statement of financial
position and sales of assets, or potentially an inability to fulfil lending commitments. The risk that the Group will be unable to
do so is inherent in all banking operations and can be affected by a range of institution-specific and market-wide events
including, but not limited to, credit events, merger and acquisition activity, systemic shocks and natural disasters.
Financial risk management continued
ABC Holdings Limited ANNUAL REPORT 201178
Liquidity risk management process
The Group holds liquidity reserves in highly tradable instruments or money market placements which are immediately available
if required. Liquidity is assessed by currency as well as by time bracket. Group liquidity management is dependent upon
accurate cash flow projections and the monitoring of its future funding requirements. The Group’s liquidity management
process is monitored by Group Treasury and includes:
Day-to-day funding, managed by monitoring future cash flows to ensure that requirements can be met. This includes replenishment
of funds as they mature or are borrowed by customers. The Group maintains an active presence in global money markets to enable
this to happen;
•	 maintaining a portfolio of highly marketable assets that can easily be liquidated as protection against any unforseen interruption
to cash flow;
•	 monitoring balance sheet liquidity ratios against internal and regulatory requirements; and
•	 managing the concentration and profile of debt maturities.
Monitoring and reporting take the form of cash flow measurement and projections for the next day, week and month respectively,
as these are key periods for liquidity management. The starting point for those projections is an analysis of the contractual maturity
of the financial liabilities and the expected collection date of the financial assets.
Group Treasury also monitors unmatched medium-term assets, the level and type of undrawn lending commitments, the usage of
overdraft facilities and the impact of contingent liabilities such as standby letters of credit and guarantees.
The Group’s maturity analysis (on a discounted cash flow basis) as at 31 December 2011 was as follows:
2011
BWP’000s
Up to
1 month
1 – 3
months
3 – 12
months
Greater than
1 year Total
Cash and short-term funds* 1,049,890 193,541 – – 1,243,431
Financial assets held for trading 87,545 423,413 112,098 27,993 651,049
Financial assets designated at fair value 8,616 – – 176,796 185,412
Derivative financial assets 6,139 – – 26,198 32,337
Loans and advances 1,234,660 442,777 1,757,424 2,642,538 6,077,399
Investment securities – – 1,363 84,811 86,174
Prepayments and other receivables 9,248 1,030 161,722 – 172,000
Current tax asset – 225 8,233 – 8,458
Investment in associates – – – 17,539 17,539
Property and equipment – – – 514,880 514,880
Investment property – – – 2,021 2,021
Intangible assets – – – 130,362 130,362
Deferred tax asset – – – 62,826 62,826
Total assets 2,396,098 1,060,986 2,040,840 3,685,964 9,183,888
Shareholders equity and liabilities
Equity – – – 612,567 612,567
Liabilities
Deposits 4,839,030 1,677,412 837,759 20,499 7,374,700
Derivative financial liabilities 216 – – 46,853 47,069
Creditors and accruals 81,995 9,945 38,487 – 130,427
Current tax liabilities 4,051 4,427 19,139 – 27,617
Deferred tax liabilities – – – 9,720 9,720
Borrowed funds 4,458 14,909 380,122 582,299 981,788
Total equity and liabilities 4,929,750 1,706,693 1,275,507 1,271,938 9,183,888
Net maturity gap (2,533,652) (645,707) 765,333 2,414,026 –
Contingent liabilities 288,048 61,277 1,928 81,650 432,903
* Included in the ‘Up to 1 month’ bucket are statutory reserve balances of BWP378.7 million (2010: BWP211.3 million).
79
2010
BWP’000s
Up to
1 month
1 – 3
months
3 – 12
months
Greater than
1 year Total
Cash and short-term funds* 999,338 – – – 999,338
Financial assets held for trading 314,329 665,496 37,628 100,374 1,117,827
Financial assets designated at fair value 15,111 – – 64,028 79,139
Derivative financial assets – – 42,012 – 42,012
Loans and advances 1,404,310 597,542 462,851 613,407 3,078,110
Investment securities – – 458 52,565 53,023
Prepayments and other receivables 152,789 – 14,405 21,112 188,306
Current tax asset – – 5,637 751 6,388
Investment in associates – – – 34,845 34,845
Property and equipment – – – 330,218 330,218
Investment property – – – 3,878 3,878
Intangible assets – – – 57,402 57,402
Deferred tax asset – – 3,406 17,547 20,953
Total assets 2,885,877 1,263,038 566,397 1,296,127 6,011,439
Shareholders equity and liabilities
Equity – – – 437,858 437,858
Liabilities
Deposits 2,719,674 1,535,951 544,913 106,507 4,907,045
Derivative financial liabilities – – 1,047 – 1,047
Creditors and accruals 51,766 – 6,104 6,147 64,017
Current tax liabilities 3,549 1,444 1,826 – 6,819
Deferred tax liabilities – – – 15,233 15,233
Borrowed funds 1,276 7,615 82,862 487,667 579,420
Total equity and liabilities 2,776,265 1,545,010 636,752 1,053,412 6,011,439
Net maturity gap 109,612 (281,972) (70,355) 242,715 –
Contingent liabilities 16,998 118,983 131,833 72,137 339,951
* Included in the ‘Up to 1 month’ bucket are statutory reserve balances of BWP211.3 million.
Funding approach
Sources of liquidity are regularly reviewed by the Asset and Liability Committees to maintain a diversification by currency, geography,
provider, product and term where possible.
Financial risk management continued
ABC Holdings Limited ANNUAL REPORT 201180
Non-derivative cashflow
The table below presents the cash flows payable by the Group under non-derivative financial liabilities by remaining contractual
maturities at the date of the consolidated statement of financial position. The amounts disclosed in the table are the contractual
undiscounted cash flows, whereas the Group manages the inherent liquidity risk based on expected undiscounted cash inflows:
2011
BWP’000s
Up to
1 month
1 – 3
months
3 – 12
months
Greater
than
1 year Total
Effect of
discount/
financing
rates
31 Dec
2011
Deposits 4,872,611 1,689,052 843,573 20,642 7,425,878 (51,178) 7,374,700
Creditors and accruals 81,995 9,945 38,487 – 130,427 – 130,427
Current tax liabilities 4,051 4,427 19,139 – 27,617 – 27,617
Borrowed funds 6,347 24,075 598,430 942,192 1,571,044 (589,256) 981,788
Total liabilities 4,965,004 1,727,499 1,499,629 962,834 9,154,966 (640,434) 8,514,532
2010
BWP’000s
Up to
1 month
1 – 3
months
3 – 12
months
Greater
than
1 year Total
Effect
of discount/
financing
rates
31 Dec
2010
Deposits 2,725,150 1,554,271 568,656 110,518 4,958,595 (51,550) 4,907,045
Creditors and accruals 51,766 – 6,104 6,147 64,017 – 64,017
Current tax liabilities 3,549 1,445 1,825 – 6,819 – 6,819
Borrowed funds 1,722 8,947 85,604 510,764 607,037 (27,617) 579,420
Total liabilities 2,782,187 1,564,663 662,189 627,429 5,636,468 (79,167) 5,557,301
The Group principally uses cash and short-term funds together with financial assets held for trading to manage liquidity risk.
Derivative financial liabilities cash flows
The table below presents the cash flows payable by the Group for derivative financial liabilities by remaining contractual maturities
at the date of the consolidated statement of financial position. The amounts disclosed in the table are the contractual undiscounted
nominal currency swap cash flows for the liability leg of such swaps, whereas the Group manages the inherent liquidity risk based
on expected undiscounted cash inflows:
2011
Up to
1 month
1 – 3
months
3 – 12
months
Greater than
1 year Total
Derivative financial liabilities 762,158 215,275 – – 977,433
2010
Up to
1 month
1 – 3
months
3 – 12
months
Greater than
1 year Total
Derivative financial liabilities 139,966 138,385 55,052 30,278 363,681
With the exception of swaps where on-going cashflows are settled on a gross basis, all derivative financial liabilities are settled
on a net basis.
81
Financial risk management continued
Financial assets and liabilities measured at fair value
Effective 1 January 2009, the Group adopted the amendments to IFRS 7 for financial instruments that are measured in the balance
sheet at fair value. This requires disclosure of fair value measurements by level of the following fair value measurement hierarchy:
•	 quoted prices (unadjusted) in active markets for identical assets or liabilities (level 1);
•	 inputs other than quoted prices included within level 1 that are observable for the asset or liability, either directly (that is as
prices) or indirectly (that is, derived from prices) (level 2); or
•	 inputs for the asset or liability that are not based on observable market data (that is, unobservable inputs) (level 3).
The following table presents the Group’s assets and liabilities that are measured at fair value at 31 December 2011:
2011 2010
BWP‘000s
Quoted
prices
Level 1
Ob-
servable
inputs
Level 2
Unob-
servable
inputs
Level 3
Total at
fair value
Quoted
prices
Level 1
Ob-
servable
inputs
Level 2
Unob-
servable
inputs
Level 3
Total at
fair value
Financial assets
held for trading – 651,049 – 651,049 – 1,117,827 – 1,117,827
Financial assets
designated
at fair value* 33,297 – 152,115 185,412 15,111 – 64,028 79,139
Derivative financial
assets – 32,337 – 32,337 – 42,012 – 42,012
Investment
securities** – – 44,002 44,002 – – 14,521 14,521
Total assets at fair
value 33,297 683,386 196,117 912,800 15,111 1,159,839 78,549 1,253,499
Derivative financial
liabilities*** – – 47,069 47,069 – 1,047 – 1,047
Total liabilities at
fair value – – 47,069 47,069 – 1,047 – 1,047
The fair value of financial instruments traded in active markets is based on quoted market prices at the balance sheet date.
A market is regarded as active if quoted prices are readily available from an exchange, dealer, broker, industry group, pricing
service or regulatory agency, and those prices represent actual and regularly occurring market transactions on an arm’s length
basis. The quoted price used for financial assets held by the Group is the current bid price. These instruments are included
in level 1. Instruments included in level 1 comprise primarily quoted equity investments classified as trading securities or
available-for-sale.
The fair value of financial instruments that are not traded in an active market (for example, over-the-counter derivatives) is
determined by using valuation techniques. These valuation techniques maximise the use of observable market data where it
is available and rely as little as possible on entity specific estimates. If all significant inputs required to fair value an instrument
are observable, the instrument is included in level 2. Financial assets held for trading and derivatives under level 2 have been
valued using market interest and exchange rates.
If one or more of the significant inputs is not based on observable market data, the instrument is included in level 3.
ABC Holdings Limited ANNUAL REPORT 201182
Specific valuation techniques used to value financial instruments include:
•	 quoted market prices or dealer quotes for similar instruments;
•	 the fair value of interest rate swaps is calculated as the present value of the estimated future cash flows based on observable
yield curves;
•	 the fair value of foreign exchange contracts is determined using forward exchange rates at the balance sheet date, with the
resulting value discounted back to present value; and
•	 other techniques, such as discounted cash flow analysis, are used to determine fair value for the remaining financial instruments.
*  Level 3 input:
In estimating the fair value of instruments under level 3 at 31 December 2011, the following assumptions were applied for
investments in convertible debentures of BWP77 million (2010: BWP64 million) included in this category:
•	 volatility in the price of the underlying equity instrument of 50% (2010: 50%); and
•	 credit spread of 12.54% (2010: 12.54%).
The balance included in this category at 31 December 2011 of BWP75 million comprises of an investment made in September
2011 in a Special Purpose Entity (SPE) which in turn is invested in another syndicated SPE which, with the funds of other
investors, is held to invest in a foreign bank (refer to note 9).
** The investment securities comprise of unlisted equities. The unlisted equities have been valued based on the value of
recent trades in these equities where available. They comprise of shareholdings smaller than 20% in a number of private
companies.
*** For the detailed assumptions relating to the valuation of level 3 derivative financial liabilities see note 21.2
The movement in instruments included in the level 3 analysis is as follows
2011
Trading
securities
Trading
derivatives
Debt or
equity
investments
Total assets
at fair value
Derivative
financial
liabilities
Total
liabilities
at fair value
Opening balance – – 78,549 78,549 – –
Total gains or losses
–  in profit and loss – – 27,611 27,611 27,485 27,485
– in other comprehensive
income – – – – – –
Purchases – – 89,599 89,599 19,584 19,584
Issues – – – – – –
Settlements – – – – – –
Exchange rate adjustment – – 358 358 – –
Transfers out of level 3 – – – – – –
Closing balance – – 196,117 196,117 47,069 47,069
83
2010
Trading
securities
Trading
derivatives
Debt or
equity
investments
Total at
fair value
Derivative
financial
liabilities
Total
liabilities at
fair value
Opening balance – – 14,450 14,450 – –
Total gains or losses
–  in profit and loss – – – – – –
– in other comprehensive
income – – – – – –
Purchases – – 65,543 65,543 – –
Issues – – – – – –
Settlements – – – – – –
Exchange rate adjustment – – (1,444) (1,444) – –
Transfers out of level 3 – – – – – –
Closing balance – – 78,549 78,549 – –
Financial instruments not measured at fair value
The table below details the carrying amounts and fair values of those financial assets and liabilities not presented on the
Group’s balance sheet at their fair value:
2011 2010
Carrying
value Fair value
Unrecognised
profit/(loss)
Carrying
value Fair value
Unrecognised
profit/(loss)
Borrowed funds 981,788 1,068,349 (86,561) 579,420 648,603 (69,183)
Financial instruments not measured at fair value, where the carrying value is estimated to approximate the fair value of these
instruments, were as follows:
(i) Placements with other banks
Placements with other banks includes inter-bank placements and items in the course of collection.
The fair value of floating rate placements and overnight deposits is their carrying amount. The estimated fair value of fixed interest-
bearing deposits is based on discounted cash flows using prevailing money-market interest rates for debts with similar credit risk
and remaining maturity.
(ii) Loans and advances
Loans and advances are accounted for on an amortised cost basis using the effective interest rate. Origination transaction costs
and origination fees received that are integral to the effective rate are capitalised to the value of the loans and amortised through
interest income as part of the effective interest rate. Loans and advances are stated net of allowances for specific and portfolio
impairment.
(iii) Investment securities
Investment securities include only interest-bearing assets held to maturity, and unlisted equities; assets classified as available for
sale are measured at fair value. Fair value for held-to-maturity assets is based on market prices or broker/dealer price quotations.
Where this information is not available, fair value is estimated using quoted market prices for securities with similar credit, maturity
and yield characteristics.
Financial risk management continued
ABC Holdings Limited ANNUAL REPORT 201184
(iv) Deposits
The estimated fair value of deposits with no stated maturity, which includes non-interest-bearing deposits, is the amount
repayable on demand.
The estimated fair value of fixed interest-bearing deposits and other borrowings not quoted in an active market is based on
discounted cash flows using interest rates for new debts with similar remaining maturity.
(v) Off-balance sheet financial instruments
The estimated fair values of the off-balance sheet financial instruments are based on market prices for similar facilities. When
this information is not available, fair value is estimated using discounted cash flow analysis.
Off-balance sheet items
BWP’000s 2011 2010
(a) Contingent liabilities
Guarantees 337,516 210,146
Letters of credit, loan commitments and other contingent liabilities 95,387 129,805
432,903 339,951
The timing profile of the contractual amounts of the Group’s off-balance sheet financial
instruments that commit it to extend credit to customers and other facilities as at 31 December
2011, are summarised below:
Less than one year 351,253 267,814
Between one and five years 81,650 72,137
432,903 339,951
(b) Capital commitments
Approved and contracted for 10,782 15,604
Approved but not contracted for 93,571 68,004
104,353 83,608
(c) Non-cancellable operating leases commitments
Future minimum lease payments under non-cancelled operating leases are as follows:
Office premises 64,353 36,285
Equipment and motor vehicles – 984
64,353 37,269
Non-cancellable operating leases are payable as follows:
Less than one year 6,327 9,241
Between one and five years 33,403 22,649
Over five years 24,623 5,379
64,353 37,269
Capital management
The Group’s objectives when managing capital, which is a broader concept than the ‘equity’ on the face of balance sheets, are:
•	 to comply with the capital requirements set by the regulators of the banking markets where the entities within the Group
operate;
•	 to safeguard the Group’s ability to continue as a going concern so that it can continue to provide returns for shareholders
and benefits for other stakeholders; and
•	 to maintain a strong capital base to support the development of its business.
85
Capital adequacy and the use of regulatory capital are monitored daily by the Group’s management, employing techniques
based on the guidelines developed by the Basel Committee and the relevant Central Bank Authorities. The required information
is filed with the Authorities on a monthly basis.
The Group’s policy is to maintain a strong capital base so as to maintain investor, creditor and market confidence and to sustain
future developments of the business.
At 31 December 2010 all regulated banking operations complied with all externally imposed capital requirements.
There have been no material changes to the Group’s management of capital during the year.
Regulatory minimum capital adequacy ratios for the Group’s banking operations based on December 2011 returns submitted
to regulatory authorities, are summarised below:
2011
BWP’000s
BancABC
Botswana
BancABC
Zimbabwe
BancABC
Zambia
BancABC
Tanzania
BancABC
Mozambique
Tier I Capital
Share capital and premium 71,470 171,272 81,004 128,973 61,810
Capital reserves and retained earnings* 89,325 91,913 (3,297) (31,784) 58,041
Allocation for market and operational risk – (6,589) – – –
Intangible assets (software)/deferred charges – – – – (20,754)
Prepayments – – – (9,036) –
Exposures to insiders – (5,219) – –
Total qualifying for Tier I capital 160,795 251,377 77,707 88,153 99,097
Tier II capital
Shareholder’s loan 68,439 – 54,304 – 52,415
General debt provision 5,523 14,924 – – –
Current year’s unpublished profits – – – – –
Fair value revaluation/available for sale reserve – 1,265 – – –
Other – – – – –
Revaluation reserves (limited to Tier I capital) 1,151 1,318 – – –
Total qualifying for Tier II capital 75,113 17,507 54,304 – 52,415
Tier III capital – 6,589 – – –
Total qualifying for Tier III capital – 6,589 – – –
Total capital 235,908 275,473 132,011 88,153 151,512
Risk weighted assets**
On balance sheet assets 1,471,292 2,508,637 620,270 682,417 958,287
Off balance sheet assets 29,653 19,485 207,135 43,371 25,571
Total risk weighted assets 1,500,945 2,528,122 827,405 725,788 983,858
Capital adequacy ratio

16% 11% 16% 12% 15%
Minimum regulatory capital adequacy ratio

15% 10% 10% 12% 8%
* Net of foreign currency translation reserve.
Financial risk management continued
ABC Holdings Limited ANNUAL REPORT 201186
2010
BWP’000s
BancABC
Botswana
BancABC
Zimbabwe
BancABC
Zambia
BancABC
Tanzania
BancABC
Mozambique
Tier I Capital
Share capital and premium 34,070 67,913 81,004 128,973 61,810
Capital reserves and retained earnings* 57,750 78,075 (37,477) (31,541) 42,143
Intangible assets (software) – – – – (7,697)
Allocation for market and operational risk – (6,965) – – –
Prepayments – – – (11,429) –
Exposures to insiders – (4,573) – –
Total qualifying for Tier I capital 91,820 134,450 43,527 86,003 96,256
Tier II capital
Shareholder’s loan 63,236 – 43,527 – 46,058
General debt provision 3,496 7,996 – – –
Revaluation reserve 13,262 – – – –
Revaluation reserves (limited to Tier I capital) – – – – –
Total qualifying for Tier II capital 79,994 7,996 43,527 – 46,058
Tier III Capital – 6,965 – – –
Total qualifying for Tier III capital – 6,965 – – –
Total capital 171,814 149,411 87,054 86,003 142,314
Risk weighted assets**
On-balance sheet assets 889,642 769,958 298,545 476,251 21,178
Off-balance sheet assets 33,534 12,735 48,514 46,776 601,202
Total risk weighted assets 923,176 782,693 347,059 523,027 622,380
Capital adequacy ratio

19% 19% 25% 16% 23%
Minimum regulatory capital adequacy ratio

15% 10% 10% 12% 8%
* Net of foreign currency translation reserve.
** Weighting of assets is based on the nature of the asset and the weighting as prescribed by the relevant regulatory authority.
The increase of the regulatory capital is mainly due to increase in shareholders’ loans at subsidiary level, as well as contributions
of the current year profit. The increase of the risk-weighted assets reflects the expansion of the lending business in most of the
subsidiaries.
Capital allocation
The allocation of capital between specific operations and activities is, to a large extent, driven by optimisation of the return achieved
on the capital allocated. The amount of capital allocated to each subsidiary is based on the regulatory capital requirements of the
countries we operate in and the need to maximise returns to shareholders.
The Group’s policies in respect of capital management and allocation are reviewed regularly by the Board of Directors.
87
Segment aNALysis
By geographical segment
Operating segments are reported in accordance with the internal reporting provided to the Group Executive Committee (the
chief operating decision-maker), which is responsible for allocating resources to the reportable segments and assesses its
performance. All operating segments used by the Group meet the definition of a reportable segment under IFRS 8.
The Group has six main business segments, comprising:
•	 Banking operations in:
	 –	Botswana
	 –	Mozambique
	 –	Tanzania
	 –	Zambia; and
	 –	Zimbabwe
•	 and non-deposit taking operations arising from ABCH and non-banking subsidiaries.
The Group’s segment operations are all financial with a majority of operating revenues derived from interest and fee and commission
income. The Group Executive Committee relies primarily on attributable profits to assess the performance of the segment for the
period.
There were no changes in the reportable segments during the year.
Transactions between the business segments are carried out at arm’s length. The revenue from external parties reported to
the Group Executive Committee is measured in a manner consistent with that in the consolidated income statement.
As the banking operations comprise of stand alone banks, each banking operation is funded with tier I and II capital from
ABCH. Interest is charged at rates disclosed in the ABCH Company stand alone financial statements on page 124. Other
material items of income or expense between the business segments comprise of management fees and dividends.
The Group’s management reporting is based on a measure of operating profit comprising net interest income, loan impairment
charges, net fee and commission income, other income and non-interest expenses. The effects of non-recurring items of
income or expense is described in the report on the Group financial performance.
The information provided about each segment is based on the internal reports about segment profitability, assets and liabilities
composition, and other information, which are regularly reviewed by the Group Executive Committee.
Segment assets and liabilities comprise the majority of items appearing on the consolidated balance sheet.
There were no banking revenues derived from transactions with a single external customer that amounted to 10% or more of
the Group’s revenues.
Financial risk management continued
ABC Holdings Limited ANNUAL REPORT 201188
The segment information provided to the Group Executive Committee for the reportable segments for the year ended
31 December 2011 is as follows:
2011
BWP’000s
BancABC
Botswana
BancABC
Mozam-
bique
BancABC
Tanzania
BancABC
Zimbabwe
BancABC
Zambia
Head
office
and
other**
Consoli-
dation
entries**** Total
Net interest income
after impairment of
loans and advances* 70,339 55,294 17,734 90,244 67,070 32,144 – 332,825
Total income 116,481 120,660 55,639 218,943 100,902 119,834 (73,650) 658,809
Net income from
operations 32,551 39,862 (6,123) 70,242 21,382 28,597 (73,650) 112,861
Share of results of
associates – – – 730 – (5,907) – (5,177)
Profit before tax 32,551 39,862 (6,123) 70,972 21,382 22,690 (73,650) 107,684
Income tax (4,546) (10,998) 2,580 (15,882) 10,489 (1,629) – (19,986)
Profit for the year 28,005 28,864 (3,543) 55,090 31,871 21,061 (73,650) 87,698
Attributable profit 28,005 28,864 (3,326) 55,090 31,871 16,148 (73,650) 83,002
Financial assets held
for trading 418,406 119,904 49,073 19,016 36,957 7,693 – 651,049
Loans and advances 1,658,100 761,897 572,697 2,033,159 576,910 474,636 – 6,077,399
Segment assets
(excluding associates) 2,564,270 1,220,893 918,312 2,618,330 883,887 1,641,051 (680,394) 9,166,349
Associates – – – 4,472 – 13,067 – 17,539
Total assets 2,564,270 1,220,893 918,312 2,622,802 883,887 1,654,118 (680,394) 9,183,888
Deposits 2,563,126 1,216,349 1,060,686 1,986,419 548,120 – – 7,374,700
Borrowed funds 133,016 – 23,253 151,400 76,836 597,283 – 981,788
Segment
liabilities*** 2,329,837 995,901 819,786 2,339,194 765,957 1,320,646 – 8,571,321
Other segment items:
Capital expenditure 20,899 32,171 24,188 115,903 29,755 32,100 – 255,016
Depreciation 5,456 7,608 3,266 9,367 3,458 2,860 – 32,015
Amortisation 4,348 5,522 1,514 2,382 1,691 427 – 15,884
Impairment charge 9,135 5,409 32,949 31,331 681 32 – 79,537
Operating expenses 83,930 80,798 61,762 148,702 79,520 91,236 – 545,948
* After eliminations.
** Reflects non-banking operations in various geographical sectors.
*** Includes inter-company assets or liabilities.
**** The main consolidation entry relates to the elimination of inter-group dividends of BWP74 million as well as the investment in subsidiaries of
BWP713 million net of goodwill of BWP33 million.
89
2010
BWP’000s
BancABC
Botswana
BancABC
Mozam-
bique
BancABC
Tanzania
BancABC
Zimbabwe
BancABC
Zambia
Head
office
and
Other**
Consoli-
dation
entries Total
Net interest income
after impairment of
loans and advances* 51,610 26,641 29,975 55,255 70,790 47,748 – 282,019
Total income 84,964 83,967 67,855 140,347 91,562 112,298 (34,686) 546,307
Net income from
operations 25,594 27,370 20,186 28,787 11,203 34,119 (36,045) 111,214
Share of results of
associates – – – 228 – (20,362) – (20,134)
Profit before tax 25,594 27,370 20,186 34,083 11,203 8,689 (36,045) 91,080
Income tax (5,554) (4,450) (3,351) (7,344) – (808) (988) (22,495)
Profit for the year 20,040 22,919 16,834 26,739 11,203 7,883 (37,033) 68,585
Attributable profit 20,040 22,919 15,805 26,739 11,203 7,037 (37,033) 66,710
Financial assets held
for trading 884,934 77,897 126,693 1,658 20,328 6,317 – 1,117,827
Loans and advances 794,615 424,274 446,426 895,169 232,721 284,905 – 3,078,110
Segment assets
(excluding associates) 1,989,701 718,762 727,993 1,515,559 375,189 1,406,464 (757,072) 5,976,596
Associates – – – 4,760 – 30,085 – 34,845
Total assets 1,989,701 718,762 727,993 1,520,319 375,189 1,436,547 (757,072) 6,011,439
Deposits 1,966,307 836,104 795,640 1,056,032 252,962 – – 4,907,045
Borrowed funds 85,076 – – 19,336 29,016 445,992 – 579,420
Segment
liabilities*** 1,818,748 556,374 630,561 1,329,071 288,845 963,160 (13,178) 5,573,581
Other segment
items:
Capital expenditure 23,838 10,895 14,455 29,546 2,162 2,095 – 82,991
Depreciation 3,423 4,318 2,717 7,657 2,572 2,457 1,358 24,502
Amortisation 1,073 2,152 591 – 1,159 – – 4,975
Impairment charge (158) 2,416 18,063 2,187 (3,458) (3,224) – 15,826
Operating expenses 59,370 56,597 47,670 106,593 80,360 83,145 1,358 435,093
* After eliminations.
** Reflects non-banking operations in various geographical sectors.
*** Includes inter-company assets or liabilities.
Financial risk management continued
ABC Holdings Limited ANNUAL REPORT 201190
CONSOLIDATED
GROUP FINANCIAL
STATEMENTS
	92	 Consolidated income statement
	92	 Consolidated statement of comprehensive income
	93	 Consolidated balance sheet
	94	 Consolidated statement of changes in equity
	96	 Consolidated cash flow statement
	97	 Notes to the financial statements
91
BWP‘000s Notes 2011 2010
Interest and similar income 821,900 594,837
Interest expense and similar charges (409,538) (296,992)
Net interest income before impairment of advances 1 412,362 297,845
Impairment of loans and advances 2 (79,537) (15,826)
Net interest income after impairment of advances 332,825 282,019
Non-interest income 3 325,984 264,288
Total income 658,809 546,307
Operating expenditure 4 (545,948) (435,093)
Net income from operations 112,861 111,214
Share of results of associates 13 (5,177) (20,134)
Profit before tax 107,684 91,080
Tax 5 (19,986) (22,495)
Profit for the year 87,698 68,585
Attributable to:
Ordinary shareholders 83,002 66,710
Minorities 4,696 1,875
Profit for the year 87,698 68,585
Basic earnings per share (Thebe) 6 56.6 46.3
Dividend per share (Thebe) 28 17.5 10.0
for the year ended 31 December 2011
consolidated income statement
consolidated statement of comprehensive income
BWP‘000s 2011 2010
Profit for the year 87,698 68,585
Other comprehensive income 101,846 (46,506)
  Exchange differences on translating foreign operations 102,415 (48,834)
  Revaluation of property 1,833 (1,982)
  Share of reserves in associate companies (1,901) 3,016
  Movement in available-for-sale reserves (132) 24
  Income tax relating to components of other comprehensive income (369) 1,270
Total comprehensive income for the year 189,544 22,079
Total comprehensive income attributable to:
Ordinary shareholders 183,775 23,267
Minorities 5,769 (1,188)
189,544 22,079
ABC Holdings Limited ANNUAL REPORT 201192
BWP‘000s Notes 2011 2010
ASSETS
Cash and short-term funds 7 1,243,431 999,338
Financial assets held for trading 8 651,049 1,117,827
Financial assets designated at fair value 9 185,412 79,139
Derivative financial assets 21 32,337 42,012
Loans and advances 10 6,077,399 3,078,110
Investment securities 12 86,174 53,023
Prepayments and other receivables 11 172,000 188,306
Current tax assets 8,458 6,388
Investment in associates 13 17,539 34,845
Property and equipment 15 514,880 330,218
Investment property 14 2,021 3,878
Intangible assets 17 130,362 57,402
Deferred tax assets 16 62,826 20,953
Total assets 9,183,888 6,011,439
EQUITIES AND LIABILITIES
Liabilities
Deposits 18 7,374,700 4,907,045
Derivative financial liabilities 21 47,069 1,047
Creditors and accruals 20 130,427 64,017
Current tax liabilities 27,617 6,819
Deferred tax liabilities 16 9,720 15,233
Borrowed funds 19 981,788 579,420
8,571,321 5,573,581
Equity
Stated capital 22 316,592 307,586
Foreign currency translation reserve (246,046) (347,388)
Non-distributable reserves 182,593 162,535
Distributable reserves 343,672 299,603
Equity attributable to ordinary shareholders 596,811 422,336
Minority interest 15,756 15,522
Total equity 612,567 437,858
TOTAL EQUITY AND LIABILITIES 9,183,888 6,011,439
as at 31 December 2011
consolidated balance sheet
93
for the year ended 31 December 2011
Attributable to owners of the parent
BWP’000s
Stated
capital
Foreign
currency
translation
reserve
Regulatory
general
credit risk
reserve
Property
revaluation
reserve
Available-
for-sale
reserve
Balance as at 1 January 2010 307,586 (298,715) 4,170 116,535 728
Comprehensive income:
Profit for the year – – – – –
Other comprehensive income: – (48,673) 889 2,608 24
 Exchange differences on translating
foreign operations – (45,771) – – –
  Revaluation of property net of deferred tax – – – (712) –
  Movement in general credit risk reserve – – 889 – –
  Hedging reserve transfer – (2,902) – – –
  Share of reserves in associate companies – – – 3,320 –
  Movement in statutory reserves – – – – –
  Disposal of treasury shares – – – –
  Movement in available for sale reserves: – – – – 24
  –  Arising in current year – – – – 24
TOTAL COMPREHENSIVE INCOME – (48,673) 889 2,608 24
Balance as at 31 December 2010 307,586 (347,388) 5,059 119,143 752
Comprehensive income:
Profit for the year – – – – –
Other comprehensive income: – 101,342 8,832 (860) (132)
 Exchange differences on translating
foreign operations – 101,342 – – –
  Revaluation of property net of deferred tax – – – 1,464 –
  Movement in general credit risk reserve – – 8,832 – –
  Share of reserves in associate companies – – – (2,324) –
  Movement in statutory reserves – – – – –
  Movement in available for sale reserves: – – – – (132)
  –  Realised through profit and loss – – – – (132)
TOTAL COMPREHENSIVE INCOME – 101,342 8,832 (860) (132)
Transactions with owners
Dividends paid – – – – –
Dividends paid by subsidiaries
to minority interests – – – – –
Disposal of treasury shares – – – – –
Discount on new shares issued to staff – – – – –
Proceeds from shares issued 9,006 – – – –
Total transaction with owners 9,006 – – – –
Balance as at 31 December 2011 316,592 (246,046) 13,891 118,283 620
consolidated statement of changes in equity
ABC Holdings Limited ANNUAL REPORT 201194
Attributable to owners of the parent
Total
Minority
interest
Total
Equity
Statutory
reserve
Hedging
reserve
Share based
payments
reserve
Treasury
share
reserve
Distributable
reserves
28,052 (2,902) – (2,574) 246,189 399,069 16,710 415,779
– – – – 66,710 66,710 1,875 68,585
11,900 2,902 – 203 (13,296) (43,443) (3,063) (46,506)
– – – – – (45,771) (3,063) (48,834)
– – – – – (712) – (712)
– – – – (889) – – –
– 2,902 – – – – – –
205 – – – (509) 3,016 – 3,016
11,695 – – – (11,695) – – –
– – – 203 (203) – – –
– – – – – 24 – 24
– – – – – 24 – 24
11,900 2,902 – 203 53,414 23,267 (1,188) 22,079
39,952 – – (2,371) 299,603 422,336 15,522 437,858
– – – – 83,002 83,002 4,696 87,698
9,847 – – – (18,256) 100,773 1,073 101,846
– – – – – 101,342 1,073 102,415
– – – – – 1,464 – 1,464
– – – – (8,832) – – –
255 – – – 168 (1,901) – (1,901)
9,592 – – – (9,592) – – –
– – – – – (132) – (132)
– – – – – (132) – (132)
9,847 – – – 64,746 183,775 5,769 189,544
– – – – (25,161) (25,161) – (25,161)
– – – – – – (5,535) (5,535)
– – (1,028) 2,371 4,484 5,827 – 5,827
– – 2,379 – – 2,379 – 2,379
– – (1,351) – – 7,655 – 7,655
– – – 2,371 (20,677) (9,300) (5,535) (14,835)
49,799 – – – 343,672 596,811 15,756 612,567
95
for the year ended 31 December 2011
BWP’000s 2011 2010
CASH FLOWS FROM OPERATING ACTIVITIES (175,580) 219,100
Cash generated from operating activities 263,802 154,379
Net profit before tax 107,684 91,080
Adjusted for:
Impairment of loans and advances 79,537 15,826
Depreciation and amortisation 47,899 29,477
Net unrealised losses/(gains) on derivative financial instruments 17,122 (1,725)
Fair value gains on investment properties – (125)
Profit on disposal of investment property (395) –
Loss from associates 5,177 20,134
Discount on new shares issued to staff 2,379 –
Impairment of investment in associates 4,292 –
Loss/(profit) on disposal of property and equipment 107 (288)
Tax paid (53,328) (25,522)
Net cash inflow from operating activities before changes in operating funds 210,474 128,857
Net (decrease)/increase in operating funds (386,054) 90,243
Increase in operating assets (3,460,992) (1,671,299)
Increase in operating liabilities 3,074,938 1,761,542
CASH FLOWS FROM INVESTING ACTIVITIES (244,185) (79,350)
Purchase of property and equipment (174,441) (82,991)
Purchase of intangible assets (80,575) (13,087)
Additions to investment property (38) (336)
Purchase of associates (1,665) (11,314)
Proceeds on disposal of property and equipment 206 8,006
Proceeds on disposal of investment property 2,709 20,372
Proceeds on disposal of associate 9,619 –
CASH FLOWS FROM FINANCING ACTIVITIES 392,795 40,075
Increase in borrowed funds 410,009 40,075
Dividend paid (25,161) –
Dividends paid by subsidiaries to minority interests (5,535) –
Disposal of treasury shares 5,827 –
Proceeds from issue of shares 7,655 –
(Decrease)/increase in cash and cash equivalents (26,970) 179,825
Cash and cash equivalents at the beginning of the year 788,026 701,766
Exchange adjustment on opening balance 103,678 (93,565)
Cash and cash equivalents at the end of the year 864,734 788,026
Cash and cash equivalents 864,734 788,026
Statutory reserves 378,697 211,312
Cash and short-term funds 1,243,431 999,338
consolidated cash flow statement
ABC Holdings Limited ANNUAL REPORT 201196
for the year ended 31 December 2011
BWP’000s 2011 2010
1. NET INTEREST INCOME
Interest and similar income
Cash and short-term funds 19,073 66,462
Investment securities and dated financial instruments 137,240 78,506
Loans and advances at amortised cost 665,587 449,869
821,900 594,837
Interest expense
Deposits 347,142 248,013
Borrowed funds 62,396 48,979
409,538 296,992
Net interest income 412,362 297,845
2. IMPAIRMENT OF LOANS AND ADVANCES
Specific impairments 55,721 18,146
Portfolio impairments 24,002 2,691
Impairments prior to recoveries 79,723 20,837
Recoveries of loans and advances previously written off (186) (5,011)
79,537 15,826
3. NON-INTEREST INCOME
Gains from trading activities: 31,277 46,561
Gains on financial assets at fair value through profit and loss 48,399 44,836
–  held for trading 18,705 33,496
–  designated at fair value 29,694 11,340
Net (losses)/gains on derivative financial instruments* (17,122) 1,725
Dividends received: 131 123
Listed shares – fair value through profit or loss 131 123
Fee and commission income: 162,148 103,189
Net fee income on loans and advances 77,867 60,516
Net fee income from trust and fiduciary activities 21,731 7,998
Cash transaction fees 5,646 14,566
Other fee income 56,904 20,109
Other non-interest income: 132,428 114,415
Money market trading income – (6)
Fair value gains on investment properties at fair value (Note 14) – 125
Rental and other income 15,987 7,632
(Loss)/profit on disposal of property and equipment (107) 288
Forex trading income and currency revaluation** 116,153 106,090
Profit on disposal of investment properties 395 –
Service charges recoveries – 286
325,984 264,288
* Net (losses)/gains on derivative financial instruments include net gains of BWP10 million (2010: BWP1.7 million) arising from the
USD: Japanese Yen derivative swap, and net losses of BWP27 million (2010: nil) arising from the derivative conversion option included
in the IFC convertible loan (note 21).
** Foreign exchange income includes a foreign exchange loss of BWP26 million (2010: loss of BWP10.7 million) arising from the Japanese
Yen exposure with NDB, disclosed in note 19. Net gains/(losses) on derivative instruments include an offsetting fair value gain arising from
an equal but opposite nominal Japanese Yen derivative asset.
notes to the financial statements
97
Notes to the financial statements continued
BWP’000s 2011 2010
4. OPERATING EXPENDITURE
Administrative expenses 186,579 150,971
Property lease rentals 20,234 20,971
Staff costs (note 4.1) 264,560 217,346
Auditor’s remuneration 6,479 4,786
Impairment of investment in associate (note 13) 4,292 –
Depreciation (note 15) 32,015 24,502
Amortisation of software (note 17) 15,884 4,975
Directors remuneration (note 4.2) 15,905 11,542
545,948 435,093
4.1 Staff Costs
Salaries 164,164 163,701
Employer contributions to post retirement funds 16,546 13,576
Other staff costs 83,850 40,069
264,560 217,346
Other staff costs comprise profit share expense, medical aid contributions, staff training
and other staff related expenses.
4.2 Directors remuneration
Executive directors
Salary, performance related remuneration and other benefits 12,251 8,013
Non-executive directors
Fees as director of holding company 2,769 2,617
Fees as director of subsidiaries 885 912
3,654 3,529
15,905 11,542
Details of other transactions and balances with related parties have been disclosed under
note 25.
5. TAX
Current tax expense
Current year 59,343 22,438
Under/(over) provision in prior years 1,026 (544)
Withholding tax 4,953 –
Bank levies – 231
65,322 22,125
Deferred tax
Accruals (5,209) 285
Impairment losses (13,623) (123)
Property and equipment 1,481 3,485
Gains and investments 1,533 (3,654)
Tax losses (29,518) 377
(45,336) 370
Total tax expense per income statement 19,986 22,495
ABC Holdings Limited ANNUAL REPORT 201198
BWP’000s 2011 2010
5. TAX (continued)
Reconciliation of effective tax charge:
Profit before tax* 107,684 91,080
Income tax using corporate tax rates* 52,575 39,065
Non-deductible expenses 368 1,267
Tax exempt revenues (18,896) (12,375)
Tax incentives (3,059) (5,149)
Tax on dividends received 4,893 –
Under/(over) provision in prior years 1,026 (544)
Tax losses of prior years now raised/claimed (16,394) –
Bank levies – 231
Rate change (527) –
Current tax expense per income statement 19,986 22,495
Effective tax rate 19% 25%
* Profit before tax is net of inter-group dividends. Income tax using corporate tax rates is calculated prior to this elimination.
5.1 Income tax effects relating to components of other comprehensive income
2011 2010
Tax (charge)/ Tax (charge)/
BWP‘000s Before tax credit After tax Before tax credit After tax
Exchange differences on
translating foreign operations 102,415 – 102,415 (48,834) – (48,834)
Revaluation of property net
of deferred tax 1,833 (369) 1,464 (1,982) 1,270 (712)
Share of reserves in associate
companies (1,901) – (1,901) 3,016 – 3,016
Movement in available
for sale reserves (132) – (132) 24 – 24
Other comprehensive
income 102,215 (369) 101,846 (47,776) 1,270 (46,506)
BWP’000s 2011 2010
6. EARNINGS PER SHARE
Basic earnings per share
Profit attributable to ordinary shareholders (‘000) 83,002 66,710
Weighted average number of ordinary shares in issue (‘000) 146,760 143,956
Basic earnings per share (Thebe) 56.6 46.3
Number of shares (‘000)
Shares in issue at beginning of the year 146,420 146,420
Ordinary shares issued during the year 3,053 –
Total Company 149,473 146,420
Recognised as treasury shares – (2,371)
Total Group 149,473 144,049
Weighted average number of ordinary shares 146,760 143,956
99
BWP’000s 2011 2010
7. CASH AND SHORT-TERM FUNDS
Cash on hand 129,306 74,777
Balances with central banks 40,549 42,722
Balances with other banks 694,879 670,527
Cash and cash equivalents 864,734 788,026
Statutory reserve balances 378,697 211,312
1,243,431 999,338
Statutory reserve balances are restricted minimum statutory balances not available for the
banking operation’s daily operations. These balances do not accrue interest.
8. FINANCIAL ASSETS HELD FOR TRADING
Government bonds 52,747 102,766
Corporate bonds 26,709 5,677
Treasury bills and other open market instruments 571,593 1,007,913
Bankers acceptances and commercial paper – 1,471
651,049 1,117,827
Investment in government bonds and treasury bills by subsidiaries is partly for liquidity
requirements as stipulated by local central banks and also as a source of diversification of
the assets portfolio. There are no cross-border investments in government securities by
any of the subsidiaries and the holding company. The Group also invests in tradeable paper
issued by large corporates in the respective markets.
All financial assets held for trading are carried at fair value.
9. FINANCIAL ASSETS DESIGNATED AT FAIR VALUE
Listed equities 18,907 4,105
Listed debentures 14,390 11,006
Unlisted debentures 152,115 64,028
185,412 79,139
The listed equities comprise various counters listed on the Zimbabwe stock exchange
that subsidiaries have invested in.
The listed debentures comprise of an investment in 10% convertible debentures
issued by PG Industries (Zimbabwe) Limited.
The unlisted debentures comprise of an investment in 12% convertible debentures
issued by Star Africa Corporation Limited and a 10% convertible loan to ADC Enterprises
Limited (refer to the overview of valuation assumptions included in the financial risk
management section of the financial statements).
10. LOANS AND ADVANCES
Mortgage lending 65,201 14,659
Instalment finance 331,826 320,602
Corporate lending 4,440,053 2,567,327
Commercial and property finance 169,531 45,151
Micro-finance lending 354,374 135,870
Consumer lending 933,974 132,966
6,294,959 3,216,575
Less impairments (Note 10.1) (217,560) (138,465)
Net loans and advances 6,077,399 3,078,110
Notes to the financial statements continued
ABC Holdings Limited ANNUAL REPORT 2011100
BWP’000s 2011 2010
10. LOANS AND ADVANCES (continued)
10.1 Analysis of impairments
Specific impairments 173,008 121,472
Portfolio impairments 44,552 16,993
217,560 138,465
10.2 Impairment of loans and advances – movement analysis
BWP‘000s
Total
impair-
ments
Mortgage
lending
Instalment
finance
Corporate
lending
Commer-
cial and
property
finance
Micro-
finance
lending
Consumer
lending
2011
Opening balance 138,465 1,378 25,651 94,216 1,423 14,510 1,287
Exchange adjustment 22,656 (144) 4,593 14,509 1 974 2,723
Bad debts written off (23,284) – (17,430) – – (5,854) –
Net new impairments
created (Note 2) 79,723 – – 71,692 – 2,221 5,810
Impairments created 79,723 – – 71,692 – 2,221 5,810
Closing balance 217,560 1,234 12,814 180,417 1,424 11,851 9,820
BWP‘000s
Total
impair-
ments
Mortgage
lending
Instalment
finance
Corporate
lending
Commer-
cial and
property
finance
Micro-
finance
lending
Consumer
lending
2010
Opening balance 134,347 2,163 26,999 85,338 1,423 15,198 3,226
Exchange adjustment (10,828) – (211) (9,661) – (983) 27
Bad debts written off (11,396) – (838) (10,558) – – –
Net new impairments
created (Note 2) 20,837 (785) (299) 22,563 – 295 (937)
Impairments created 21,161 (785) (299) 22,887 – 295 (937)
Impairments released (324) – – (324) – – –
Suspended interest 5,505 – – 6,534 – – (1,029)
Closing balance 138,465 1,378 25,651 94,216 1,423 14,510 1,287
BWP’000s 2011 2010
11. PREPAYMENTS AND OTHER RECEIVABLES
Accounts receivable and prepayments 144,512 171,358
Security deposits 5,262 3,467
Other amounts due 22,226 13,481
172,000 188,306
101
BWP’000s 2011 2010
12. INVESTMENT SECURITIES
Available for sale
  Unlisted equities 44,002 14,521
Held to maturity
  Promissory notes 42,172 38,502
86,174 53,023
The investments in unlisted equities are accounted for at fair value. Refer to fair value note
under financial risk management for details.
The promissory notes are partial security for the loan from BIFM (Note 19). The promissory
notes earn a fixed interest of 10.25% p.a., and are redeemable on 31 March 2015.
The fair value of the promissory notes has not been determined as the promissory notes
are specifically conditional to the terms of the BIFM loan referred to in note 19.
13. INVESTMENT IN ASSOCIATES
Carrying value at the beginning of the year 34,845 40,946
Exchange rate adjustment 2,150 (1,346)
Reclassification during the year – 1,049
Share of (losses)/profits (5,177) (23,828)
Tax (132) 3,694
Share of other comprehensive income (1,901) 3,016
Disposals* (9,619) –
Impairment (note 4) (4,292) –
Additions* 1,665 11,314
17,539 34,845
* Refer to note 29 for an overview of additions and disposals.
13.1 Investment in associates
The Group’s interest in its principal associates are as follows:
BWP’000s
Country of
incorporation Assets Liabilities
Carrying
amount
Share
of
profit/
(loss)
Impair-
ment
during
the year
%
interest
held
Reporting
date
2011
Lion of Tanzania Insurance
Company Limited Tanzania 23,281 18,746 3,881 305 – 38% 31 December
PG Industries (Botswana)
Limited* Botswana 30,800 24,358 9,186 (1,892) 4,292 37% 31 March
Credit Insurance
Zimbabwe Limited Zimbabwe 8,644 4,224 4,472 954 – 24% 31 December
Prestige Investments
Private Limited** Zimbabwe – – – (4,544) – 0% 31 December
62,725 47,328 17,539 (5,177) 4,292
Notes to the financial statements continued
ABC Holdings Limited ANNUAL REPORT 2011102
13.1 Investment in associates (continued)
BWP’000s
Country of
incorporation Assets Liabilities
Carrying
amount
Share
of
profit/
(loss)
Impair-
ment
during
the year
%
interest
held
Reporting
date
2010
Lion of Tanzania Insurance
Company Limited Tanzania 16,467 13,644 2,925 248 – 38% 31 December
PG Industries (Botswana)
Limited* Botswana 31,779 24,736 15,370 (2,821) – 37% 31 March
Credit Insurance
Zimbabwe Limited Zimbabwe 5,361 2,280 3,162 227 – 24% 31 December
Prestige Investments
Private Limited** Zimbabwe 14,307 4,243 11,789 (17,788) – 49% 31 December
PG Industries (Zimbabwe)
Limited** Zimbabwe 4,402 2,476 1,599 – – 2% 31 December
72,316 47,379 34,845 (20,134) –
* IFRS compliant management accounts not available.
* In assessing investments in associates for impairment, the following assumptions were applied in assessing PG Industries
Botswana Limited, which generated a loss during the year, for impairment:
   •  projected compounded free cashflows of BWP5.3 million, BWP4.5 million and BWP4.8 million over the next 3 years;
   •  terminal value based on 3.5% long-term cash flow growth rate; and
   •  weighted average cost of capital of 12.72%
The equity accounted numbers, other than for Lion of Tanzania, are based on management accounts. Lion of Tanzania was
equity accounted using audited annual financial statements for the year ended 31 December 2010.
** On 31 August 2011, the Group divested from Prestige Investment Private Limited. The dissolution of the Company was by
way of a distribution of assets to the shareholders of the Company on that date. The Group received shares that it was
entitled to in PG Industries (Zimbabwe) Limited. As the effective shareholding of the Group in PG Industries (Zimbabwe)
Limited is less than 20%, these shares were transferred to investment securities held at fair value through profit or loss.
The carrying amount of the Group’s investment in Prestige Investments Private Limited and PG Industries Zimbabwe
Limited on 31 August 2011 was BWP9.6 million. The fair value of the PG shares recognised was BWP9.6 million. These
shares were accounted for as financial assets designated at fair value.
BWP’000s 2011 2010
14. INVESTMENT PROPERTY
Balance at the beginning of the year 3,878 25,851
Exchange rate adjustment 419 195
Disposal (2,314) (20,372)
Transfer to property and equipment – (2,257)
Additions 38 336
Increase/(decrease) in fair value (Note 3) – 125
Balance at end of the year 2,021 3,878
Rental income recognised in the income statement 1,493 471
Investment property comprises commercial properties that are leased to third parties. The carrying amount of the investment
property is at fair value as determined by registered independent valuers every 3 years as applicable.
103
15. PROPERTY AND EQUIPMENT
BWP’000s
Land and
buildings
Motor
vehicles
Computer
and office
equipment
Furniture
and fittings Total
Cost or valuation at prior year 248,600 12,173 87,163 40,239 388,175
Exchange adjustment 36,301 2,548 2,553 4,688 46,090
Additions 83,827 7,539 47,436 35,639 174,441
Revaluations surplus
(gross of deferred tax)* 1,833 – – – 1,833
Reclassifications – – 160 (160) –
Disposals (158) (506) (3) (204) (871)
Cost or valuation at 31 December 2011 370,403 21,754 137,309 80,202 609,668
Accumulated depreciation at
December 2010 (9,107) (6,276) (31,093) (11,481) (57,957)
Exchange adjustment (457) (576) (3,379) (1,109) (5,521)
Disposals 98 372 (3) 91 558
Reclassifications – – 959 (812) 147
Charge for the year (6,743) (2,135) (17,608) (5,529) (32,015)
Accumulated depreciation at
31 December 2011 (16,209) (8,615) (51,124) (18,840) (94,788)
Carrying amount at 31 December 2011 354,194 13,139 86,185 61,362 514,880
Cost or valuation at prior year 219,576 10,039 61,908 25,111 316,634
Exchange adjustment (3,907) (701) (3,383) 1,411 (6,580)
Additions 29,556 3,441 36,227 13,767 82,991
Revaluations deficit
(gross of deferred tax) 1,118 – – – 1,118
Transfer from Investment property 2,257 – – – 2,257
Disposals – (606) (7,589) (50) (8,245)
Cost or valuation at 31 December 2010 248,600 12,173 87,163 40,239 388,175
Accumulated depreciation at
December 2009 (3,636) (4,818) (21,033) (8,172) (37,659)
Exchange adjustment 205 (116) 3,139 449 3,677
Disposals – 527 – – 527
Charge for the year (5,676) (1,869) (13,199) (3,758) (24,502)
Accumulated depreciation at
31 December 2010 (9,107) (6,276) (31,093) (11,481) (57,957)
Carrying amount at 31 December 2010 239,493 5,897 56,070 28,758 330,218
* Land and buildings are revalued by independent professional valuers based on open market value every 3 years. In the current year, certain
land and buildings in Botswana were revalued at BWP27.9 million. The carrying cost of this land and buildings had the revaluation not been
done would have been BWP26 million.
BWP’000s 2011 2010
Carrying amount of revalued land and buildings had it not been revalued, including
exchange differences 193,285 120,351
Notes to the financial statements continued
ABC Holdings Limited ANNUAL REPORT 2011104
BWP’000s 2011 2010
16. DEFERRED TAX
Balance at the beginning of the year 5,720 6,694
Exchange adjustment 2,419 1,213
Income statement charge (Note 5) 45,336 (370)
Deferred tax on amounts charged to equity (369) (1,817)
53,106 5,720
Disclosed as follows:
Deferred tax asset 62,826 20,953
Deferred tax liability (9,720) (15,233)
53,106 5,720
Tax effects of temporary differences:
Accruals (1,848) 2,693
Impairment losses 16,476 483
Property and equipment (8,889) (6,715)
Unrealised losses/(gains) on investment 1,272 (984)
Unearned income 6,876 704
Revaluation surplus (716) (2,920)
Tax losses 39,935 12,459
53,106 5,720
17. INTANGIBLE ASSETS
Goodwill 32,544 32,544
Software 97,818 24,858
130,362 57,402
Goodwill
Cost 67,342 67,342
Impairments losses (34,798) (34,798)
Carrying amount at the end of the year 32,544 32,544
Software
Cost
Balance at the beginning of the year (software) 41,791 34,161
Exchange rate adjustment 15,000 (5,457)
Additions 80,575 13,087
137,366 41,791
Amortisation
Balance at the beginning of the year (16,933) (16,284)
Exchange rate adjustment (6,731) 4,326
Amortisation charge (Note 4) (15,884) (4,975)
(39,548) (16,933)
Carrying amount at the end of the year 97,818 24,858
105
17. INTANGIBLE ASSETS (continued)
The impairment test of goodwill is based on assumptions that take into account risk and uncertainty. The impairment test
makes a number of assumptions regarding projected cashflows, considering local market conditions and management’s
judgement of future trends.
The most significant goodwill arises from the Zimbabwe operations. The key assumptions used in the impairment test of the
Zimbabwe operations are as follows:
•	 Projected compounded free cash flows growth of 26% per annum for 5 years, (2010: 20% per annum for 5 years)
•	 Terminal value based on 5% long-term cash flow growth rate, (2009: 5%)
•	 Weighted average cost of capital of 11.24%, (2010: 18.41%)
Management determined free cash flows, residual value and growth rates based on past performance and its
expectations of market developments. The discount rates are pre-tax and reflect specific risks relating to the operation.
The weighted average cost of capital has been impacted by movements in the Botswana Stock Exchange all share index
and also the increased borrowings at lower rates than the older loans.
BWP’000s 2011 2010
18. DEPOSITS
Deposits from banks 557,228 618,267
Deposits from other customers 6,817,472 4,288,718
Deposits under repurchase agreements – 60
7,374,700 4,907,045
Payable on demand
Corporate customers 2,221,361 1,146,908
Public Sector 321,993 105,696
Retail customers 446,355 151,687
Other financial institutions 191,659 29,664
Banks 169,287 405,299
3,350,655 1,839,254
Term deposits
Corporate customers 975,023 1,226,249
Public sector 1,927,913 1,148,080
Retail customers 107,862 176,441
Other financial institutions 625,306 304,053
Banks 387,941 212,968
4,024,045 3,067,791
7,374,700 4,907,045
Geographical analysis
Botswana 2,563,126 1,810,308
Mozambique 1,216,349 836,104
Tanzania 1,060,686 795,640
Zambia 548,120 252,961
Zimbabwe 1,986,419 1,065,048
Other – 146,984
7,374,700 4,907,045
Notes to the financial statements continued
ABC Holdings Limited ANNUAL REPORT 2011106
BWP’000s 2011 2010
19. BORROWED FUNDS
Convertible bond 84,619 –
Other borrowed funds 897,169 579,420
981,788 579,420
(a) Convertible bond
Face value of convertible bond issued on 13th May 2011 88,787 –
Derivative component (note 21.2) (19,367) –
Liability component on initial recognition 69,420 –
Interest expense 7,209 –
Upfront loan arrangement fees (728) –
Interest paid (1,368) –
Exchange rate movement 10,086 –
84,619 –
During the year, the Group issued a US Dollar denominated convertible loan to International
Finance Corporation (IFC) for US$13.5 million. The loan attracts interest of 6 months
LIBOR + 3.75% per annum, payable semi-annually and it is convertible at IFC’s option as
follows:
•	 BWP3.15 per share at any time during the period from 13th May 2011 to
12th May 2012;
•	 BWP3.24 per share at any time during the period from 13th May 2012 to
12th May 2013; or
•	 If at any time during the conversion period, the Group raises additional capital, a price
equal to the price of the shares issued as part of such a capital raising exercise.
The redemption dates for the principal amount are as follows:
15th Mar 2013 – US$3,500,000	 	 15th Sep 2013 – US$3,500,000
15th Mar 2014 – US$3,500,000	 	 15th Sep 2014 – US$3,048,969
The carrying amount of this convertible loan approximates its fair value at
31 December 2011.
(b) Other borrowed funds
National Development Bank of Botswana Limited 125,212 121,080
BIFM Capital Investment Fund One (Pty) Ltd 255,862 257,328
Afrexim Bank 209,262 –
Standard Chartered Bank Botswana Limited 113,325 96,721
Other 193,508 104,291
897,169 579,420
Fair value
National Development Bank of Botswana Limited 152,466 124,961
BIFM Capital Investment Fund One (Pty) Ltd 315,169 322,630
Afrexim Bank 209,262 –
Standard Chartered Bank Botswana Limited 113,325 96,721
Other 193,508 104,291
983,730 648,603
107
19. BORROWED FUNDS (continued)
National Development Bank of Botswana Limited (NDB)
The loan from National Development Bank of Botswana is denominated in Japanese Yen and attracts interest at 3.53% per
annum. Principal and interest is payable semi-annually on 15 June and 15 December. The loan matures on 15 December 2016.
BIFM Capital Investment Fund One (Pty) Ltd
The loan from BIFM Capital Investment Fund One (Pty) Ltd is denominated in Botswana Pula and attracts interest at
11.63% per annum, payable semi annually.
The redemption dates for the principal amount are as follows:
30 September 2017 – BWP62,500,000 30 September 2018 – BWP62,500,000
30 September 2019 – BWP62,500,000 30 September 2020 – BWP62,500,000
Afrexim Bank Limited
This is a US$50 million trade finance facility availed to the Group on a one year renewable basis by Afrexim Bank Limited
from September 2011. The Group had utilised US$28 million of this facility at 31 December 2011. It attracts interest at
LIBOR + 4% and it is repayable on the earlier of when the underlying customers funded repay their respective loans or
within one year, but with a provision to extend it for another one year period.
Standard Chartered Bank Botswana Limited
This is a US$15 million one year facility issued to BancABC Botswana by Standard Chartered Bank Botswana Limited.
The loan was initially granted on 22 June 2006 and has been renewed annually ever since. It matures on 30 June 2012.
It attracts interest of LIBOR + 3.39% and it is secured by Bank of Botswana Certificates amounting to BWP109 million.
Other borrowings
Other borrowings relate to medium- to long-term funding from international financial institutions for onward lending to
BancABC clients. Fair value is equivalent to carrying amounts as these borrowings have variable interest rates.
BWP’000s 2011 2010
Maturity analysis
On demand to one month 4,458 1,276
One to three months 14,909 7,615
Three months to one year 380,122 82,862
Over one year 582,299 487,667
981,788 579,420
20. CREDITORS AND ACCRUALS
Accrued expenses 49,970 50,756
Other amounts due 80,457 13,261
130,427 64,017
Notes to the financial statements continued
ABC Holdings Limited ANNUAL REPORT 2011108
21. DERIVATIVE FINANCIAL INSTRUMENTS
2011 2010
BWP’000s Assets Liabilities Assets Liabilities
Cross-currency interest rate swaps 26,197 – 19,464 –
Convertible bond option – 46,852 – –
Forward foreign exchange contracts – held for trading 6,140 217 22,548 1,047
32,337 47,069 42,012 1,047
21.1 Cross-currency interest rate swaps
The Group uses cross-currency rate swaps to manage its exposure to foreign currency and interest rate risk. These instruments
are transacted for both hedging and non-hedging activities. These instruments result in an economic exchange of currencies and
interest rates. An exchange of principal takes place for all cross-currency interest rate swaps. The Group’s credit risk exposure
represents the potential cost to replace the swap contracts if counterparties fail to fulfil their obligation. To control the level of
credit risk taken, the Group assesses counterparties using the same technique as for its lending activities.
The notional amounts of the financial instruments provide a basis of comparison with instruments recognised on the balance
sheet but do not necessarily indicate the amounts of future cash flows or the current fair value of the instruments and,
therefore, do not indicate Group’s exposure to credit or price risks.
The derivative financial instruments become favourable (assets) or unfavourable (liabilities) as a result of fluctuations in the
market interest rates or foreign exchange rates relative to their terms. The aggregate contractual or notional amount of
derivative financial instruments on hand, the extent to which instruments are favourable or unfavourable, and thus the
aggregate fair values of derivative financial assets and liabilities, can fluctuate significantly from time to time. The fair values of
derivative financial instruments held are set out below:
BWP’000s
Notional
amount Fair value
At 31 December 2011
Cross currency interest rate swaps
Designated at fair value through profit and loss 125,212 26,197
Total recognised derivatives 26,197
Comprising:
Derivative financial assets 26,197
Derivative financial liabilities –
At 31 December 2010
Cross currency interest rate swaps
Designated at fair value through profit and loss 122,087 19,464
Total recognised derivatives 19,464
Comprising:
Derivative financial assets 19,464
Derivative financial liabilities –
109
BWP’000s 2011 2010
21. DERIVATIVE FINANCIAL INSTRUMENTS (continued)
21.2 Convertible bond option
Value on initial recognition on 13th May 2011 19,367 –
Fair value loss 27,485 –
46,852 –
The convertible bond option is in relation to the IFC convertible loan issued by the Group on 13th May 2011. See also note 19.
The key assumptions in the valuation of the conversion option were as follows:
–  ABCH share price at year-end of BWP4.55
–  Volatility of 35% (ABCH share price and US dollar)
–  Spot exchange rate – BWP7.47/US$
– Forward foreign exchange rates for first 12 months obtained from Bloomberg and were extended beyond 12 months by
extrapolating at a constant growth rate
–  Credit spread of 3.75% above LIBOR
– Conversion price of BWP3.24 used
–  Dividend yield of 3% assumed
Sensitivity: a change in volatility from 35% to 48% results in a BWP5 million change in the fair value of this derivative.
21.3 Forward foreign exchange contracts
The notional amounts of outstanding forward foreign exchange contracts at 31 December 2011 were BWP977 million
(2010: BWP364 million).
These result in derivative financial assets of BWP6.1 million (2010: BWP22.5 million) and derivative financial liabilities of
BWP0.2 million (2010: BWP1 million)
BWP’000s 2011 2010
22. STATED CAPITAL
22.1 Authorised
150 000 000 shares of BWP0.05 each 7,500 7,500
22.2 Issued and fully paid
149 472 131 (2010: 146 419 524) shares of BWP0.05 each 7,474 7,320
Share premium 309,118 300,266
Total Company 316,592 307,586
Total Group 316,592 307,586
BWP’000s
Share
capital
Share
premium Total
At 1 January 2010 and 2011 7,320 300,266 307,586
Issue of shares 154 8,852 9,006
At 31 December 2011 7,474 309,118 316,592
The holders of ordinary shares are entitled to receive a dividend as declared from time to time and are entitled to one vote per
share at the annual general meeting of the Company. Treasury shares comprise the cost of the Company’s own shares held by
subsidiaries. As at 31 December 2011, there were no treasury shares held within the Group (2010: 2,370,657 ).
Notes to the financial statements continued
ABC Holdings Limited ANNUAL REPORT 2011110
BWP’000s 2011 2010
23. FUNDS UNDER MANAGEMENT
Funds under management 368,977 240,759
The Group provides asset management and unit trusts activities to pension funds, individuals, trusts and other institutions,
whereby it holds and manages assets. The Group receives a management fee for providing these services. The Group is not
exposed to any credit risk relating to such placements.
24. EMPLOYEE BENEFITS
The Group uses a combination of externally administered defined contribution schemes and, where there is a mandatory
requirement, state social security schemes. Both the employee and employer contribute to these schemes. The Group
does not operate any defined benefit scheme.
Amounts recognised in expenses have been disclosed in Note 4.1
25. RELATED PARTY TRANSACTIONS
Related party transactions are a normal feature of business and are disclosed in terms of IAS 24. Related party transactions
may affect the assessment of operations, risk and opportunity facing the organisation.
ABC Holdings Limited is the holding company in the ABC Group.
Subsidiary companies and associates
ABC Holdings Limited and its subsidiaries entered into various financial services contracts with fellow subsidiaries and
associates during the year. These transactions are entered into in the normal course of business, under terms that are no more
favourable than those arranged with third parties. Loans to associates as at 31 December 2011 amounted to BWP8.6 million
(2010: BWP9.6 million) which represents 1.4% (2010: 2%) of shareholders’ funds, and 0.1% (2010: 0.3%) of gross loans. In
addition, financial assets designated at fair value include an investment in debentures issued by PG Industries (Zimbabwe)
valued at BWP14 million (2010: BWP11 million).
ABC Consulting and Management Services Limited has entered into management services agreements with Group companies
on an arm’s length basis. Details of disclosures of investments in subsidiaries are set out in note 15 of the separate Company
financial statements. Details of associate companies are set out in note 13 of the consolidated Group financial statements.
Shareholders
During the year, the Group invested in ADC Enterprises Limited which is a 100% subsidiary of African Development Corporation
(ADC). ADCE in turn is invested in a syndicated special purpose entity which, with the funds of other investors, is held to
invest in a foreign bank. ADC is a significant shareholder of the Group. The investment balance as at 31 December 2011 was
BWP75 million and has been classified as fair value through profit or loss.
Directors and officers
Emoluments to directors have been disclosed in note 4.2. The list of directors of ABC Holdings is shown on page 39. The total
exposure of the Group to directors, officers and parties related to them in terms of IAS 24 as at 31 December 2011 is
BWP20.8 million (2010: BWP20.4 million) which represents 3% (2010: 5%) of shareholders’ funds.
Particulars of lending transactions entered into with directors or their related companies that have given rise to exposure on the
balance sheet as at the end of the year are as follows:
111
25. RELATED PARTY TRANSACTIONS (continued)
2011 2010
BWP‘000s Balance Interest Balance Interest
Loans and advances to entities related
through shareholding:
PG Industries (Botswana) Limited 8,626 1,405 9,615 195
Star Africa Corporation – – – 738
8,626 1,405 9,615 933
Loans and advances to entities related to directors:
Loans and advances to entities related to N Kudenga 4,604 531 174 64
Loans and advances to entities related to FM Dzanya 435 17 921 2
5,039 548 1,095 66
Loans and advances to directors:
D T Munatsi 2,237 218 2,982 255
F Dzanya 7,079 612 6,624 734
B Moyo  3,849 303 3,040 392
13,165 1,133 12,646 1,381
Loans and advances to key management:
H Matemera – 198 4,746 462
B Mudavanhu 2,586 121 1,885 49
2,586 319 6,631 511
Financial assets designated at fair value held
with entities related through shareholding:
Listed debentures:
PG Industries (Zimbabwe) Limited – – 11,006 –
– – 11,006 –
Deposits held by entities related to directors
and key management:
D Khama – Doreen Khama Attorneys Trust Account 9,460 93 5,833 206
Kudenga  Company Chartered Accountants 7 – – –
Deposits from entities related to F Dzanya 801 – – –
Deposits from entities related to D T Munatsi – – 6 –
10,268 – 5,839 206
Deposits held by directors and key management:
N Kudenga 57 – – –
F Dzanya 44 – 32 –
B Moyo  6 – 73 –
H Matemera – – 10 –
D Khama 571 – 2,666 181
D T Munatsi 250 – 70 1
928 – 2,851 182
Remuneration to key management personnel:
Short-term employment benefits 15,455 13,264
Post-employment benefits 1,241 1,296
Discount on shares issued 934 –
17,630 14,560
All loans bear interest and fees at rates applicable to similar exposures to third parties.
The Group assists officers and employees in respect of housing, motor vehicle and personal loans at subsidised rates in some
instances. Consistent policies and processes govern the granting and terms of such loans.
In 2011, PG Industries (Zimbabwe) Limited ceased to be an associate of the Group.
Notes to the financial statements continued
ABC Holdings Limited ANNUAL REPORT 2011112
26. EXCHANGE RATES
Closing Average Closing Average
Dec 11 Dec 11 Dec 10 Dec 10
United States Dollar 0.134 0.146 0.155 0.147
Tanzanian Shilling 212.345 231.829 233.427 210.117
Zambian Kwacha 682.442 711.427 744.484 707.889
Mozambican Metical 3.647 4.194 5.053 4.994
South African Rand 1.083 1.059 1.028 1.080
BWP’000s 2011 2010
27. COLLATERAL
27.1 Liabilities for which collateral is pledged
Deposits from banks 207,127 46,156
Deposits from customers 343,579 63,732
Borrowed funds 108,560 116,860
659,266 226,748
Assets pledged to secure these liabilities are carried at amortised cost and are included
under the following:
Cash and short-term funds 20,515 –
Bankers’ acceptances 405,221 –
Financial assets held for trading 233,530 233,868
659,266 233,868
These transactions are conducted under terms that are usual and customary to standard
lending and borrowing activities.
27.2 Collateral accepted as security for assets
Deposits from customer 290,517 402,840
Mortgage bonds, inventory, plant and equipment, shares, letter of undertaking 1,494,989 1,428,452
1,785,506 1,831,292
ABC Holdings Limited is obliged to return equivalent securities. The Group is not
permitted to sell or repledge collateral in the absence of default.
These transactions are conducted under terms that are usual and customary to standard
lending and borrowing activities.
28. ORDINARY DIVIDENDS
Dividend of 10 Thebe per share paid on 12th April 2011 to shareholders on the register
on 1st April 2011 14,642 –
Dividend of 7 Thebe per share paid on 16th September 2011 to shareholders on the
register on 2nd September 2011 10,519 –
25,161 –
The Board of Directors proposed a gross final dividend in respect of the year ended
31 December 2011 of 10.5 Thebe per ordinary share.
This will bring the full year dividend to 17.5 Thebe per share.
113
29. ACQUISITIONS AND DISPOSAL OF ASSOCIATE COMPANIES
During 2011 the Group acquired additional shares in PG Industries (Zimbabwe) for BWP1.7 million. Subsequently in August
2011, the Group disposed of its interest in Prestige, an investment company that was housing the PG Industries (Zimbabwe)
shares. Each party was then handed over the shares in PG Industries (Zimbabwe) that they were entitled to in full and final
settlement of the transaction.
During 2010 the Group followed its rights in a rights issue by PG Industries (Botswana) Limited for BWP5.5 million.
During 2010 the Group acquired a 2% interest in PG Industries (Zimbabwe) Limited for BWP1.6 million, following the under­
writing of a right issue, and indirectly invested an additional BWP4.2 million by following existing rights.
In addition, the Group acquired listed convertible debentures in PG Industries (Zimbabwe) Limited as detailed in note 9.
30. EVENTS AFTER THE REPORTING DATE
There were no significant events after the reporting date.
31. RESTATEMENT
Comparative numbers for interest income and interest expense were restated by BWP55.62 million respectively to eliminate
interest on transactions between subsidiaries. The restatement had no impact on income before and after tax, or on equity.
The restatement is summarised as follows:
BWP’000
Previously
stated Restated
Interest and similar income 650,466 594,837
Interest expense and similar charges (352,621) (296,992)
297,845 297,845
ABC Holdings Limited ANNUAL REPORT 2011114
COMPANY SEPARATE
FINANCIAL
STATEMENTS
	116	 Company income statement
	116	 Company statement of comprehensive income
	117	 Company balance sheet
	118	 Company statement of changes in equity
	119	 Company cash flow statement
	120	 Notes to the Company financial statements
115
for the year ended 31 December 2011for the year ended 31 December 2011
for the year ended 31 December 2011
company income statement
company statement of comprehensive income
BWP’000s Notes 2011 2010
Interest and similar income 110,153 102,202
Interest expense and similar charges (77,918) (56,748)
Net interest income 1 32,235 45,454
Non-interest income 2 63,564 56,056
Other impairments 3 – (4,340)
Total income 95,799 97,170
Operating expenditure 4 (78,821) (83,923)
Profit before tax 16,978 13,247
Tax 5 122 (633)
Profit for the year 17,100 12,614
BWP’000s 2011 2010
Profit for the year 17,100 12,614
Total comprehensive income for the year 17,100 12,614
ABC Holdings Limited ANNUAL REPORT 2011116
BWP’000s Notes 2011 2010
ASSETS
Cash and short-term funds 6 5,102 22,660
Financial assets designated at fair value 17 152,115 64,028
Derivative financial assets 16 26,316 19,464
Loans and advances 7 281,111 193,370
Inter-company balances 8 77,652 58,433
Investment securities 9 42,172 38,502
Prepayments and other receivables 10 7,577 18,607
Property and equipment 11 263 790
Deferred tax assets 12 15,017 10,002
Loans to subsidiary companies 13 177,547 158,053
Intangible assets 14 215 –
Investment in subsidiaries 15 680,626 602,077
TOTAL ASSETS 1,465,713 1,185,986
EQUITY AND LIABILITIES
Liabilities
Derivative financial liabilities 16 46,971 –
Creditors and accruals 18 9,110 6,147
Inter-company balances 8 482,884 449,064
Borrowed funds 19 615,201 427,028
Total liabilities 1,154,166 882,239
Equity
Stated capital 20 316,592 307,586
Distributable reserves (5,045) (3,839)
Equity attributable to ordinary shareholders 311,547 303,747
EQUITY AND LIABILITIES 1,465,713 1,185,986
as at 31 December 2011
company balance sheet
117
for the year ended 31 December 2011
BWP’000s
Stated
capital
Treasury
share
reserve
Distributable
reserves
Total
equity
Balance as at 31 December 2009 307,586 – (16,453) 291,133
Comprehensive income:
  Profit for the year – – 12,614 12,614
TOTAL COMPREHENSIVE INCOME – – 12,614 12,614
Balance as at 31 December 2010 307,586 – (3,839) 303,747
Comprehensive income:
  Profit for the year – – 17,100 17,100
TOTAL COMPREHENSIVE INCOME – – 17,100 17,100
Transactions with owners:
  Shares issued 9,006 – – 9,006
  Dividends paid during the year – – (25,161) (25,161)
  Acquisition of treasury shares from subsidiary – (2,371) 2,371 –
  Disposal of treasury shares – 2,371 4,484 6,855
Balance as at 31 December 2011 316,592 – (5,045) 311,547
company statement of changes in equity
ABC Holdings Limited ANNUAL REPORT 2011118
BWP’000s 2011 2010
CASH FLOWS FROM OPERATING ACTIVITIES (98,146) 149,638
Cash generated from operating activities 34,654 16,116
Net profit before tax 16,978 13,247
Adjusted for:
Other impairments – 4,340
Depreciation and amortisation 554 254
Net losses/(gains) on derivative financial instruments 17,122 (1,725)
Tax paid (4,893) (1,166)
29,761 14,950
Net increase in operating funds (127,907) 134,688
Increase in operating assets (211,661) (183,084)
Increase in operating liabilities 83,754 317,772
CASH FLOWS FROM INVESTING ACTIVITIES (98,285) (135,194)
Purchase of intangible assets (619) (806)
Proceeds on disposal of property and equipment 377 –
Investment in subsidiaries (78,549) (118,759)
Changes in loans to subsidiaries (19,494) (15,629)
CASH FLOWS FROM FINANCING ACTIVITIES 178,873 8,165
Increase in borrowed funds 188,173 8,165
Proceeds from issue of shares 9,006 –
Proceeds from issue of treasury shares 6,855 –
Dividend paid (25,161) –
(Decrease)/Increase in cash and cash equivalents (17,558) 22,609
Cash and cash equivalents at the beginning of the year 22,660 51
Cash and cash equivalents at the end of the year 5,102 22,660
for the year ended 31 December 2011
company cash flow statement
119
for the year ended 31 December 2011
ACCOUNTING POLICIES
The accounting policies of the Company and the Group are set out on pages 49 to 63.
BWP’000s 2011 2010
1. NET INTEREST INCOME
Interest and similar income
Cash and short-term funds 238 7,525
Investment securities at amortised cost 3,670 3,670
Loans and advances at amortised cost* 88,556 73,406
Inter-company 17,689 17,601
110,153 102,202
Interest expense
Borrowed funds 64,578 42,921
Inter-company 13,340 13,827
77,918 56,748
Net interest income 32,235 45,454
* Interest income includes interest of BWP30.8 million pertaining to an individually impaired exposure.
In terms of a loan syndication agreement with BancABC Zimbabwe, a portion of the exposure
arising from this interest accrual was sold to BancABC Zimbabwe, and subsequently impaired. In
the consolidated financial statements, BWP14.5 million of this interest income was eliminated
against the impairment charge processed by BancABC Zimbabwe.
2. NON-INTEREST INCOME
(Losses)/gains from trading activities: (9,526) 7,082
–  Designated at fair value 7,596 5,357
–  Net (losses)/gains on derivative financial instruments* (17,122) 1,725
Dividends received: 72,967 37,456
–  Subsidiary companies 72,967 37,456
Fee and commission income: 2,570 9,600
–  Net fee and commission income 2,570 9,600
Other non-interest income: (2,447) 1,918
Rentals and other income – –
Foreign exchange income and currency revaluation** (2,447) 1,918
63,564 56,056
* Net (losses)/gains on derivative financial instruments include net gains of BWP10 million arising
from the USD:Japanese Yen derivative swap, and net losses of BWP27 million arising from the
derivative convertion option included in the IFC convertible loan (note 19).
** Foreign exchange income includes a foreign exchange loss of BWP26 million (2010: loss of
BWP10.7 million) arising from the Japanese Yen exposure with NDB, disclosed in note 19. Net
gain/(losses) on derivative financial instruments includes an offsetting fair value gain arising from
an equal but opposite nominal Japanese Yen derivative asset.
3. OTHER IMPAIRMENTS
Impairment of investment in subsidiaries
EDFUND S.A. – 4,340
4,340
notes to the company financial statements
ABC Holdings Limited ANNUAL REPORT 2011120
BWP’000s 2011 2010
4. OPERATING EXPENDITURE
Inter-company management fees 50,175 59,103
Administrative expenses 5,922 5,362
Staff costs 5,532 7,464
Auditors’ remuneration 1,618 1,110
Depreciation (note 11) 150 254
Amortisation of software (note 14) 404 –
Directors’ remuneration 15,020 10,630
78,821 83,923
5. TAX
Profit before tax 16,978 13,247
Income tax using standard corporate tax rate 2,531 1,987
Tax exempt revenues (10,945) (5,618)
Non-deductible expenses 16 617
Tax on dividends received 4,893 1,165
Tax losses of prior years not claimed 3,383 2,482
Tax (income)/expense per income statement (122) 633
Effective tax rate 1% (5%)
5.1 Current tax expense
Deferred tax
Tax losses (5,015) (532)
Current tax
Tax on dividends received 4,893 1,165
Total tax (income)/expense per income statement (122) 633
6. CASH AND SHORT-TERM FUNDS
Balances with banks 5,102 22,660
Balances with banks include bank accounts with group companies that total
BWP552 thousand.
These accounts are maintained to make dividend payments.
7. LOANS AND ADVANCES
Corporate lending 267,946 165,570
Other* 13,165 27,800
281,111 193,370
Less: Allowance for impairments – –
Net loans and advances 281,111 193,370
* Related party loans and advances included in the above are set out in note 21.
The fair value of net loans and advances approximates their carrying amount.
7.1 Maturity analysis
On demand to one month 2,658 135,389
One month to three months 2,249 40,410
Three months to one year 263,040 2,430
Greater than one year 13,164 15,141
281,111 193,370
121
BWP’000s 2011 2010
7. LOANS AND ADVANCES (continued)
7.2 Impairment of loans and advances
–  Movement analysis
Opening balance – 6,674
Exchange rate adjustment – (94)
Bad debts written off – (6,580)
Impairments created – –
Closing balance – –
The loans all have floating interest rates which range from 8.5% to 19.6% (2010: 9.75% to 43%). The loans are denominated
in Botswana Pula and United States Dollars.
BWP’000s 2011 Fair value 2010 Fair value
8. INTER-COMPANY BALANCES
8.1 Balances due from:
BancABC Zambia Limited – – 4,541 4,541
ABCH Management Support Services (Pty) Ltd and
other non-banking subsidiaries* 77,652 77,652 53,892 53,892
77,652 77,652 58,433 58,433
8.2 Balances due to:
BancABC Botswana Limited 266,662 266,662 157,192 157,192
BancABC Mozambique Sarl 20,458 20,458 109,840 109,840
BancABC Tanzania Limited 44,710 44,710 66,745 66,745
BancABC Zambia Limited 9,633 9,633 – –
BancABC Zimbabwe, Second Nominees and Capital
Partners 97,524 97,524 71,423 71,423
EDFUND S.A. 43,799 43,799 37,713 37,713
Tanzania Development Finance Company Limited 98 98 6,151 6,151
482,884 482,884 449,064 449,064
* The amount includes an interest free loan of BWP35.7 million (2010: BWP37.4 million) pertaining to ABCH Management Support Services
(Pty) Ltd, (ABC South Africa). The loan has no fixed terms of repayment. In addition, the amount includes a loan of BWP18.8 million
(2010: nil) to Kendra (Pvt) Ltd, (a group company in Zambia). As the entity reflects a negative net asset value of BWP4.7 million at
31 December 2011, ABC Holdings committed to provide financial support to the entity to enable it to carry on its operations as a going
concern and to meet its obligations as and when they fall due in the foreseeable future.
Inter-company balances are generally short-term placements or borrowings at prevailing market rates.
The balances are denominated in Botswana Pula: -BWP242.5 million (2010: -BWP164.3 million); United States Dollars:
-BWP256.2 million (2010: -BWP276.2 million); South African Rands: BWP13.5 million (2010: BWP49.1 million); and Euro nil
(2010: 0.8 million).
Notes to the Company financial statements continued
ABC Holdings Limited ANNUAL REPORT 2011122
BWP’000s 2011 2010
9. INVESTMENT SECURITIES
Held-to-maturity
–  Promissory notes 42,172 38,502
The promissory notes are partial security for the loan from BIFM (Note 19). The promissory
notes earn a fixed interest of 10.25% p.a., and are redeemable on 31 March 2015.
The fair value of the promissory notes has not been determined as the promissory notes
are specifically conditional to the terms of the BIFM loan referred to in note 19.
10. PREPAYMENTS AND OTHER RECEIVABLES
Accounts receivable and prepayments 2,219 3,985
Security deposit 3,744 3,224
Other amounts due 1,614 11,398
7,577 18,607
All prepayments and other receivables are classified as current.
11. PROPERTY AND EQUIPMENT
BWP’000s
Computer
and office
equipment
Furniture
and fittings Total
Cost or valuation at 31 December 2010 977 267 1,244
Disposals (619) – (619)
Cost or valuation at December 2011 358 267 625
Accumulated depreciation at December 2010 (445) (9) (454)
Disposals 242 – 242
Charge for the year (97) (53) (150)
Accumulated depreciation at December 2011 (300) (62) (362)
Carrying amount at December 2011 58 205 263
Cost or valuation at 31 December 2009 438 – 438
Additions 539 267 806
Cost or valuation at December 2010 977 267 1,244
Accumulated depreciation at December 2009 (200) – (200)
Charge for the year (245) (9) (254)
Accumulated depreciation at December 2010 (445) (9) (454)
Carrying amount at December 2010 532 258 790
BWP’000s 2011 2010
12. DEFERRED TAX
Balance at the beginning of the year (10,002) (9,470)
Income statement charge (note 5) (5,015) (532)
Balance at the end of the year (15,017) (10,002)
Tax effect of temporary differences:
–  Property and Equipment (32) –
–  Unrealised gain on investments (3,306) –
–  Tax losses (11,679) (10,002)
(15,017) (10,002)
123
BWP’000s 2011 2010
13. LOANS TO SUBSIDIARY COMPANIES
BancABC Botswana Limited 70,614 65,902
BancABC Zambia Limited 53,804 46,058
BancABC Mozambique Sarl 53,129 46,093
177,547 158,053
The loans are 13 year loans provided to subsidiaries as Tier II capital. Interest ranges from
10% to 12.5% and is payable half yearly. The loans mature between 2020 and 2021.
The loans are denominated in Botswana Pula: BWP32 million (2010: BWP32 million) and
United States Dollars: BWP146.9 million (2010: BWP126.1 million).
14. INTANGIBLE ASSETS
Cost
Additions 619 –
619 –
Amortisation
Amortisation charge (note 4) (404) –
(404) –
Carrying amount at the end of the year 215 –
15. Investment in subsidiaries
Ownership of ordinary shares Carrying value
2011 2010 2011 2010
Nature of business % % BWP’000s BWP’000s
Botswana
BancABC Botswana Limited Registered bank 100 100 89,641 52,241
Bohemian Private Limited Investment holding company 100 100 4,000 4,000
Capital Partners Private Limited Investment holding company 100 100 2,019 2,019
Mozambique
BancABC Mozambique Sarl Registered bank 100 100 68,050 68,050
South Africa
ABCH Management Support
Services (Proprietary) Limited
Management services 100 100 – –
Tanzania
BancABC Tanzania Limited Registered bank 94* 94* 128,397 128,397
Tanzania Development Finance
Company Limited
Financial services 68 68 15,949 15,949
Zambia
BancABC Zambia Limited Registered bank 100 100 82,486 78,776
Zimbabwe
BancABC Zimbabwe Limited Registered merchant bank,
Stockbroking and Asset
Management
100 100 248,049 210,610
Luxembourg
EDFUND S.A.** Management services 100 100 42,035 42,035
680,626 602,077
* Effective shareholding.
** In 2009 the investment in EDFUND S.A. was impaired by BWP2.6 million as the carrying amount exceeded the net asset value, and the
entity does not generate income. In 2010, the investment was further impaired by BWP4.3 million.
Notes to the Company financial statements continued
ABC Holdings Limited ANNUAL REPORT 2011124
16. DERIVATIVE FINANCIAL INSTRUMENTS AND HEDGING ACTIVITIES
2011 2010
Assets Liabilities Assets Liabilities
Cross-currency interest rate swaps 26,197 – 19,464 –
Convertible bond option – 46,852 – –
Forward foreign exchange contracts – held for trading 119 119 – –
26,316 46,971 19,464 –
Cross-currency interest rate swaps
The Company uses cross currency interest rate swaps to manage the Group’s exposure to foreign currency and interest rate
risk. These instruments are transacted for both hedging on Group basis, and non-hedging activities. These instruments result
in an economic exchange of currencies and interest rates. An exchange of principal takes place for all cross-currency interest
rate swaps. The Company’s credit risk exposure represents the potential cost to replace the swap contracts if counterparties
fail to fulfil their obligation. To control the level of credit risk taken, the Company assesses counterparties using the same
technique as for its lending activities.
The notional amounts of the financial instruments provide a basis of comparison with instruments recognised on the balance
sheet but do not necessarily indicate the amounts of future cash flows or the current fair value of the instruments and, there­
fore, do not indicate the Company’s exposure to credit or price risks.
The derivative financial instruments become favourable (assets) or unfavourable (liabilities) as a result of fluctuations in the
market interest rates or foreign exchange rates relative to their terms. The aggregate contractual or notional amount of derivative
financial instruments on hand, the extent to which instruments are favourable or unfavourable, and thus the aggregate fair
values of derivative financial assets and liabilities, can fluctuate significantly from time to time. The fair values of derivative
financial instruments held are set out below:
BWP’000s
Notional
amount Fair value
At 31 December 2011
Cross-currency interest rate swaps:
Designated at fair value through profit and loss 125,212 26,197
Total recognised derivatives 26,197
At 31 December 2010
Cross-currency interest rate swaps:
Designated at fair value through profit and loss 121,080 19,464
Total recognised derivatives 19,464
BWP’000s 2011 2010
16.1 Convertible bond option
Value on initial recognition on 13th May 2011 19,367 –
Fair value loss 27,485 –
46,852 –
For details of the assumptions taken in valuing the convertible option and the sensitivity thereof, please refer to note 21.2
in the Group financial statements.
16.2 Forward foreign exchange contracts
The notional amounts of outstanding forward foreign exchange contracts at 31 December 2011 were BWP14.4 million
(2010: nil).
125
BWP’000s 2011 2010
17. FINANCIAL ASSETS DESIGNATED AT FAIR VALUE
Unlisted debentures 152,115 64,028
The unlisted debentures comprise of:
– investment in 5 year 12% convertible debentures issued by Star Africa Corporation
Limited, convertible at the option of the holder after 2 years, with interest being paid
quarterly on 31 March, 30 June, 30 September and 31 December. The balance is
denominated in United States dollars.
– from October 2011, an investment of US$10 million in a 5 year 10% convertible loan to
ADC Enterprises Limited, convertible on maturity or liquidating on the occurance of a
specified ‘liquidity event’ in the shareholders agreement, with interest being paid as and
when sufficient funds are available from returns earned on the ultimate investment. The
balance is denominated in United States Dollars.
Both investments are carried at fair value.
18. CREDITORS AND ACCRUALS
Accrued expenses 2,825 3,010
Items in transit 3,653 –
Other amounts due 2,632 3,137
9,110 6,147
Creditors and accruals are due and payable within twelve months.
BWP’000s 2011 Fair value 2010 Fair value
19. BORROWED FUNDS
Convertible bond 84,619 84,619 – –
Other borrowed funds 530,582 617,142 427,028 496,211
615,201 701,761 427,028 496,211
(a) Convertible bond
Face value of convertible bond issued on
13th May 2011 88,787 88,787 – –
Derivative component (note 16.1) (19,367) (19,367) – –
Liability component on initial recognition 69,420 69,420 – –
Interest expense 7,209 7,209 – –
Upfront loan arrangement fees (728) (728) – –
Interest paid (1,368) (1,368) – –
Exchange rate movement 10,086 10,086 – –
84,619 84,619 – –
During the year, the Group issued a US Dollar denominated convertible loan to International Finance Corporation (IFC) for
US$13.5 million. The loan attracts interest of 6 months LIBOR + 3.75% per annum, payable semi-annually and it is convertible
at IFC’s option as follows:
– BWP3.15 per share at any time during the period from 13th May 2011 to 12th May 2012;
– BWP3.24 per share at any time during the period from 13th May 2012 to 12th May 2013; or
– if at any time during the conversion period, the Group raises additional capital, a price equal to the price of the shares issued
as part of such a capital raising exercise.
The redemption dates for the principal amount are as follows:
15th March 2013 – US$3,500,000 	 15th September 2013 – US$3,500,000
15th March 2014 – US$3,500,000	 15th September 2014 – US$3,048,969
Notes to the Company financial statements continued
ABC Holdings Limited ANNUAL REPORT 2011126
BWP’000s 2011 Fair value 2010 Fair value
19. BORROWED FUNDS (continued)
(b) Other borrowed funds
National Development Bank of Botswana Limited 125,212 152,466 121,080 124,961
BIFM Capital Investment Fund One (Pty) Ltd 255,862 315,168 257,328 322,630
Afrexim Bank Limited 112,063 112,063 – –
Standard Chartered Bank Botswana Limited 37,445 37,445 32,248 32,248
Other borrowings – – 16,372 16,372
530,582 617,142 427,028 496,211
National Development Bank of Botswana Limited (NDB)
The loan from National Development Bank of Botswana is denominated in Japanese Yen and attracts interest at 3.53% per
annum. Principal and interest is payable semi-annually on 15 June and 15 December. The loan matures on 15 December 2016.
BIFM Capital Investment Fund One (Pty) Ltd
The loan from BIFM Capital Investment Fund One (Pty) Ltd is denominated in Botswana Pula and attracts interest at 11.63%
per annum, payable semi annually.
The redemption dates for the principal amount are as follows:
30 September 2017 – BWP62,500,000        30 September 2018 – BWP62,500,000
30 September 2019 – BWP62,500,000        30 September 2020 – BWP62,500,000
Afrexim Bank Limited
This is a US$50 million trade finance facility availed to the Group on a one year renewable basis by Afrexim Bank Limited from
September 2011. The Group had utilised US$28 million of this facility at 31 December 2011. It attracts interest at LIBOR + 4%
and it is repayable on the earlier of when the underlying customers funded repay their respective loans or within one year, but
with a provision to extend it for another one year period. Only the portion related to ABCH has been recognised in the Company
financial statements.
Standard Chartered Bank Botswana Limited
This is a US$15 million one year facility issued to BancABC Botswana by Standard Chartered Bank Botswana Limited. The loan
was initially granted on 22 June 2006 and has been renewed annually ever since. It matures on 30th June 2012. It attracts
interest of LIBOR + 3.39% and it is secured by Bank of Botswana Certificates amounting to BWP109 million. Only the portion
syndicated to ABCH has been recognised in the Company financial statements.
Other borrowings
Other borrowings relate to medium- to long-term funding from international financial institutions for onward lending to BancABC
clients. Fair value is equivalent to carrying amounts as these borrowings have variable interest rates.
BWP’000s 2011 2010
19.1 Maturity analysis
One month to three months 8,550 7,328
Three months to one year 177,003 10,081
Greater than one year 429,648 409,619
615,201 427,028
127
2011 2010
20. STATED CAPITAL
20.1 Authorised
150 000 000 shares of BWP0.05 each 7,500 7,500
20.2 Issued and fully paid
149 472 131 (2010: 146 419 524) shares of BWP0.05 each 7,474 7,320
Share premium 309,118 300,266
Total Company 316,592 307,586
Share
capital
Share
premium Total
At 1 January 2010 and 2011 7,320 300,266 307,586
Issue of shares 154 8,852 9,006
At 31 December 2011 7,474 309,118 316,592
The holders of ordinary shares are entitled to receive a dividend as declared from time to time and are entitled to one vote
per share at the annual general meetings of the Company.
2011 2010
20.3 Reconciliation of the number of shares in issue
Shares at the beginning of the year 146,419,524 146,419,524
Shares issued 3,052,607 –
At the end of the year 149,472,131 146,419,524
21. RELATED PARTY TRANSACTIONS
Related party transactions are a normal feature of business and are disclosed in terms of IAS 24. Related party transactions
may affect the assessment of operations.
Subsidiary companies and associates
ABC Holdings Limited is the holding company in the ABC Group. ABC Holdings Limited and its subsidiaries entered into various
financial services contracts with fellow subsidiaries and associates during the year. These transactions are entered into in the
normal course of business, under terms that are no more favourable than those arranged with third parties. Loans to/from
subsidiary companies have been disclosed in note 8 and 13 and interest on these in note 1. Dividends received from subsidiaries
have been disclosed in note 2. Bank balances with subsidiaries is disclosed in note 6.
ABC Consulting and Management Services Limited and ABCH Management Support Services (Pty) Limited have entered into
management services agreements with the Company on an arm’s length basis. Details of inter-company management fees
incurred during the year have been disclosed on note 4.
Details of disclosures of investments in subsidiaries are set out in note 15. Details of associate companies are set out in note
13 of the Group financial statements.
Shareholders
During the year, the Company invested in ADC Enterprises Limited, which is a 100% subsidiary of African Development
Corporation (ADC). ADCE in turn is invested in a syndicated SPE which, with the funds of other investors, is held to invest in a
foreign bank. ADC is a significant shareholder of the Group. The investment balance as at 31 December 2011 was BWP75 million
and has been classified as fair value through profit or loss.
Notes to the Company financial statements continued
ABC Holdings Limited ANNUAL REPORT 2011128
21. RELATED PARTY TRANSACTIONS (continued)
Directors and officers
Emoluments to directors have been disclosed in note 4. Particulars of other lending transactions entered into with related
parties are as follows:
2011 2010
Balance Interest Balance Interest
Loans and advances to entities related through
shareholding: – – – 738
Star Africa Corporation Limited* – – – 738
Loans and advances to directors:
DT Munatsi 2,237 240 2,104 237
F Dzanya 7,079 563 6,624 734
B Moyo 3,849 278 3,040 392
13,165 1,081 11,768 1,363
Loans and advances to key management:
H Matemera – 198 3,737 421
– 198 3,737 421
There were no specific impairments on balances with related parties.
* The Group disposed of its interest in Star Africa Corporation Limited in the prior year.
129
BWP’000s 2011 2010
22. OFF-BALANCE SHEET ITEMS
22.1 Contingent liabilities
The Company has agreed to provide its subsidiary Kendra (Pvt) Ltd with the required
operational and financial support (see note 8 for details)
As at 31 December 2011, Kendra (Pvt) Ltd's liabilities exceeded its assets by BWP4.7 million.
22.2 Capital commitments
Approved and contracted for the next year ­– –
23. COLLATERAL
23.1 Liabilities for which collateral is pledged
Borrowed funds 255,862 257,328
255,862 257,328
Assets pledged to secure these liabilities are carried at amortised cost and are included
under the following:
Investment securities 42,172 38,502
42,172 38,502
23.2 Collateral accepted as security for assets
Mortgage, bonds, inventory and debtors 101,307 –
101,307 –
The Company is obliged to return equivalent securities. The Company is not permitted to
sell or repledge collateral in the absence of default. These transactions are conducted
under terms that are usual and customary to standard lending and borrowing activities.
24. ORDINARY DIVIDENDS
Dividend of 10 Thebe per share paid on 12th April 2011 to shareholders on the register on
1st April 2011 14,642 –
Dividend of 7 Thebe per share paid on 16th September 2011 to shareholders on the register
on 2nd September 2011 10,519 –
25,161 –
The Board of Directors proposed a gross final dividend in respect of the year ended
31 December 2011 of 10.5 Thebe per ordinary share.
This will bring the full year dividend to about 17.5 Thebe per share.
Notes to the Company financial statements continued
ABC Holdings Limited ANNUAL REPORT 2011130
The credit risk management policies of the Company and Group are set out on pages 64 to 71 of the Group financial statements.
Maximum exposure to credit risk before collateral held or other
credit enhancements
The following table presents the maximum exposure to credit risk of balance sheet and off-balance sheet financial instruments,
before taking into account any collateral held or other credit enhancements unless such credit enhancements meet offsetting
requirements. For financial assets recognised on the balance sheet, the exposure to credit risk equals their carrying amount
before deducting impairments.
Credit risk exposures relating to on-balance sheet assets are as follows:
BWP’000s 2011 2010
Placements with banks 5,102 22,660
Derivative financial assets 26,316 19,464
Financial assets designated at fair value 152,115 64,028
Loans and advances to customers at amortised cost 281,111 193,370
–  Corporate Lending 267,947 165,570
–  Other loans and advances 13,164 27,800
Investment securities 42,172 38,502
–  Promissory notes 42,172 38,502
Loans to subsidiaries 177,547 158,053
Inter-company balances 77,652 58,433
762,015 554,510
Credit quality
Loans and advances
The following tables reflect broadly, stable credit quality of the Company’s exposures.
Distribution of loans and advances by credit quality:
BWP’000s 2011 2010
Neither past due nor impaired 189,520 193,370
Individually impaired 91,591 –
Gross Loans and Advances 281,111 193,370
Less: Allowance for impairment – –
Net Loans and Advances 281,111 193,370
FINANCIAL RISK MANAGEMENT
131
Financial risk management continued
(a) Distribution of loans and advances neither past due nor impaired
The credit quality of the portfolio of loans and advances that were neither past due nor impaired can be assessed by reference
to the internal rating system adopted below:
Internal grade: Performing
BWP’000s
31 December
2011
31 December
2010
Corporate lending 176,356 165,570
Other loans and advances 13,164 27,800
189,520 193,370
(b) Loans and advances individually impaired
The individually impaired loans and advances before taking into consideration the cash flows from collateral held is BWP91.6 million
(2010: nil).
The breakdown of the gross amount of individually impaired loans and advances by class, along with the fair value of related
collateral held by the Company as security, are as follows:
2011 2010
BWP’000s
Individually
Impaired
Fair value
collateral
Under-
collater-
alisation*
Individually
Impaired
Fair value
collateral
Under-
collater-
alisation*
Corporate Lending 91,591 – 91,591 – – –
91,591 – 91,591 – – –
* Individually impaired loans comprise of a single exposure to a corporate export entity in Zimbabwe. No impairment has been raised in the Company
financial statements as the carrying amount of the exposure equates to the discounted present value of a repayment plan agreed to with the
debtor. Subsequent to the financial year end, BWP43.4 million has been received in terms of this plan. The balance is receivable on 5 May and
30 June 2012.
The overdue interest relating to the impaired loan was suspended in full in the Group financial statements.
ABC Holdings Limited ANNUAL REPORT 2011132
Concentration risk of financial assets with credit risk exposure
(a) Geographical sectors
The following table breaks down the Company’s main credit exposure at their carrying amounts, as categorised by geographical
regions as of 31 December 2011.
2011
BWP’000s Botswana
Mozam-
bique Tanzania Zambia Zimbabwe Other Total
Placements with banks 105 – – – 496 4,501 5,102
Financial assets
designated at fair value – – – – 77,125 74,990 152,115
Derivative financial
assets – – – – 119 26,197 26,316
Loans and advances 51,313 – – – 229,798 – 281,111
Investment securities 42,172 – – – – – 42,172
Inter-company balances 31,902 – – 18,815 – 26,935 77,652
125,492 – – 18,815 307,538 132,623 584,468
2010
BWP’000s Botswana
Mozam-
bique Tanzania Zambia Zimbabwe Other Total
Placements with banks 50 – – – 19,445 3,165 22,660
Financial assets
designated at fair value – – – – 64,028 – 64,028
Derivative financial
assets – – – – – 19,464 19,464
Loans and advances 19,356 – – – 168,870 5,144 193,370
Investment securities 38,502 – – – – – 38,502
Inter-company balances 20,622 – – 4,541 – 33,270 58,433
78,530 – – 4,541 252,343 61,043 396,457
133
Concentration risk of financial assets with credit risk exposure
(b) Industry Sectors
The following table breaks down the Group’s main credit exposure at their carrying amounts, as categorised by industry
sectors of the counterparties:
2011
BWP’000s Agriculture Construction
Wholesale,
retail and
trade
Public
sector
Manu-
facturing
Placements with banks – – – – –
Financial assets designated at fair value – – 77,125 – –
Derivative financial assets – – – – –
Loans and advances – – 145,887 – –
Investment securities – – – – –
Inter-company balances – – – – –
– – 223,012 – –
2010
BWP’000s Agriculture Construction
Wholesale,
retail and
trade
Public
sector
Manu-
facturing
Placements with banks – – – – –
Financial assets designated at fair value – – 64,028 – –
Derivative financial assets – – – – –
Loans and advances 2,067 – – – –
Investment securities – – – – –
Inter-company balances – – – – –
2,067 – 64,028 – –
Financial risk management continued
ABC Holdings Limited ANNUAL REPORT 2011134
2011
Mining and
Energy
Financial
Services Transport Individuals Tourism Other Total
– 5,102 – – – – 5,102
– 74,991 – – – – 152,116
– 26,316 – – – – 26,316
122,061 – – 13,163 – – 281,111
– 42,172 – – – – 42,172
– 77,652 – – – – 77,652
122,061 226,233 – 13,163 – – 584,469
2010
Mining and
Energy
Financial
Services Transport Individuals Tourism Other Total
– 22,660 – – – – 22,660
– – – – – – 64,028
– 19,464 – – – – 19,464
135,389 28,115 – 27,799 – – 193,370
– 38,502 – – – – 38,502
– 58,433 – – – – 58,433
135,389 167,174 – 27,799 – – 396,457
135
Market risk
The Company takes on exposure to market risks, which is the risk that the fair value of future cash flows of a financial instrument
will fluctuate because of changes in market prices. Market risks arise from open positions in interest rate, currency and equity
products, all of which are exposed to general and specific market movements and changes in the level of volatility of market rates
or prices such as interest rate, credit spreads, foreign exchange rates and equity prices.
Market and foreign currency exposures related to dealing positions are housed and managed in the Treasury division within
a framework of pre-approved dealer, currency and counterparty limits. All trading positions are marked to market as required by
IAS 39. Group Risk is responsible for monitoring of limits and pricing, thereby ensuring that any errors or unauthorised transactions
are promptly identified.
Concentration of currency risk: On-and off-balance sheet financial instruments:
2011
BWP’000s EUR USD BWP ZAR
Cash and short-term funds – 3,691 105 1,306
Financial assets designated at fair value – 152,115 – –
Loans and advances – 229,797 51,314 –
Investment securities – – 42,172 –
Prepayments and other receivables 674 6,007 896 –
Derivative financial assets* – – 6,091 119
Inter-company balances – 49,264 1,454 26,934
Property and equipment – – 263 –
Total Intangible assets – – 215 –
Deferred tax assets – – 15,017 –
Investment in subsidiaries – 292,104 93,641 –
Loans to subsidiaries – 145,866 31,681 –
Total assets 674 878,844 242,849 28,359
Derivative financial liabilities* – 151,958 – 119
Creditors and accruals – 6,269 76 2,765
Borrowed funds – 234,128 255,861 –
Inter-company balances (116) 225,598 243,980 13,422
Total liabilities (116) 617,953 499,917 16,306
Net on-balance sheet position 790 260,891 (257,068) 12,053
* Notional amounts have been reported in the currency columns and adjustments made in “Other” to arrive at the fair values.
Financial risk management continued
ABC Holdings Limited ANNUAL REPORT 2011136
Market risk measurement techniques
The major measurement techniques used to measure and control market risk are outlined below.
Foreign Exchange Risk
The Company takes on exposure to the effects of fluctuations in the prevailing foreign currency exchange rates on its financial
position and cash flows. Group Risk sets limits on the level of exposure by currency and in aggregate for both overnight and
intra-day positions, which are monitored daily. The table below summarises the Company’s exposure to foreign currency
exchange rate risk at 31 December 2011.
Included in the table are the Company’s assets and liabilities at carrying amounts, categorised by currency.
2011
TZS ZMK MZN JPY Other Total
– – – – – 5,102
– – – – – 152,115
– – – – – 281,111
– – – – – 42,172
– – – – – 7,577
– – – 125,212 (105,106) 26,316
– – – – – 77,652
– – – – – 263
– – – – – 215
– – – – – 15,017
144,345 82,486 68,050 – – 680,626
– – – – – 177,547
144,345 82,486 68,050 125,212 (105,106) 1,465,713
– – – – (105,106) 46,971
– – – – – 9,110
– – – 125,212 – 615,201
– – – – – 482,884
– – – 125,212 (105,106) 1,154,166
144,345 82,486 68,050 – – 311,547
137
Concentration of currency risk: On-and off-balance sheet financial instruments (continued):
2010
BWP’000s EUR USD BWP ZAR
Cash and short-term funds – 22,610 50 –
Financial assets designated at fair value – 64,028 – –
Loans and advances – 134,294 59,076 –
Investment securities – – 38,502 –
Prepayments and other receivables – 12,413 6,150 44
Inter-company balances 58 (6,722) 28,825 36,272
Derivative financial assets* – 1,139 4,011 –
Property and equipment – – 790 –
Deferred tax assets – – 10,002 –
Investment in subsidiaries – 254,665 56,241 –
Loans to subsidiaries – 158,053 – –
Total assets 58 640,480 203,647 36,316
Derivative financial liabilities* – 106,766 – –
Creditors and accruals – 3,729 21 2,397
Borrowed funds 758 47,861 257,329 –
Inter-company balances (802) 269,519 193,173 (12,826)
Total liabilities (44) 427,875 450,523 (10,429)
Net on-balance sheet position 102 212,605 (246,876) 46,745
* Notional amounts have been reported in the currency columns and adjustments made in “Other” to arrive at the fair values.
Financial risk management continued
ABC Holdings Limited ANNUAL REPORT 2011138
2011
TZS ZMK MZN JPY Other Total
– – – – – 22,660
– – – – – 64,028
– – – – – 193,370
– – – – – 38,502
– – – – – 18,607
– – – – – 58,433
– – – 121,080 (106,766) 19,464
– – – – – 790
– – – – – 10,002
144,345 78,776 68,050 – – 602,077
– – – – – 158,053
144,345 78,776 68,050 121,080 (106,766) 1,185,986
– – – – (106,766) –
– – – – – 6,147
– – – 121,080 – 427,028
– – – – – 449,064
– – – 121,080 (106,766) 882,239
144,345 78,776 68,050 – – 303,747
139
Interest rate risk
Cash flow interest rate risk is the risk that the future cash flows of a financial instrument will fluctuate because of changes in
market interest rates. Fair value interest rate risk is the risk that the value of a financial instrument will fluctuate because of
changes in market interest rates. The Company takes on exposure to the effects of fluctuations in the prevailing levels of
market interest rates on both its fair value and cash flow risks. Interest margins may increase as a result of such changes but
may reduce losses in the event that unexpected movements arise. The Asset and Liability Committee (ALCO) is responsible
for managing interest rate and liquidity risk in the Group. Asset and Liability management committees have been established
in each subsidiary and meet on a monthly basis. They operate within the prudential guidelines and policies established by
Group ALCO.
In order to reduce interest rate risk, the majority of the Company’s lending is on a variable interest rate with a term of less than
one year.
The table below summarises the Company’s exposure to interest rate risks. It includes the Company’s financial instruments
at carrying amounts, categorised by the earlier of contractual re-pricing or maturity dates. Variable rate financial instruments
are categorised in the “Up to 1 month” column.
2011
BWP’000s 1 Month
1 – 3
Months
3 – 12
Months
1 – 5
Years
Non-interest
bearing Total
Cash and short-term funds 5,102 – – – – 5,102
Financial assets designated
at fair value 2,246 – – 149,869 – 152,115
Derivative financial assets – – – – 26,316 26,316
Loans and advances 189,520 – 91,591 – – 281,111
Investment securities – – – 42,172 – 42,172
Prepayments and other
receivables – – – – 7,577 7,577
Inter-company balances 58,837 18,815 – – – 77,652
Property and equipment – – – – 263 263
Intangible assets – – – – 215 215
Deferred tax asset – – – – 15,017 15,017
Investment in subsidiaries – – – – 680,626 680,626
Loans to subsidiaries – – – 177,547 – 177,547
Total assets 255,705 18,815 91,591 369,588 730,014 1,465,713
Shareholders equity
and liabilities
Equity – – – – 311,547 311,547
Derivative financial liabilities – – – – 46,971 46,971
Creditors and accruals – – – – 9,110 9,110
Borrowed funds – 92,144 149,509 373,548 – 615,201
Inter-company balances 431,705 51,179 – – – 482,884
Total equity and liabilities 431,705 143,323 149,509 373,548 367,628 1,465,713
Total interest repricing gap (176,000) (124,508) (57,918) (3,960) 362,386 –
Financial risk management continued
ABC Holdings Limited ANNUAL REPORT 2011140
2010
BWP’000s 1Month
1 – 3
Months
3 – 12
Months
1 – 5
Years
Non-interest
bearing Total
Cash and short-term funds 22,660 – – – – 22,660
Financial assets designated
at fair value – – – 64,028 – 64,028
Derivative financial assets – – – – 19,464 19,464
Loans and advances 193,370 – – – – 193,370
Investment securities – – – 38,502 – 38,502
Prepayments and other
receivables – – – – 18,607 18,607
Inter-company balances 58,433 – – – – 58,433
Property and equipment – – – – 790 790
Deferred tax asset – – – – 10,002 10,002
Investment in subsidiaries – – – – 602,077 602,077
Loans to subsidiaries – – – 158,053 158,053
Total assets 274,463 – – 260,583 650,940 1,185,986
Shareholders equity and
liabilities
Equity – – – – 303,747 303,747
Creditors and accruals – – – – 6,147 6,147
Borrowed funds – 7,328 10,081 409,619 – 427,028
Inter-company balances 449,064 – – – – 449,064
Total equity and liabilities 449,064 7,328 10,081 409,619 309,894 1,185,986
Total interest repricing gap (174,601) (7,328) (10,081) (149,036) 341,046 –
The table below illustrates the impact of a possible 50 basis points interest rate movement:
BWP‘000s 2011 2010
Shift in yield curves of +50 basis points (1,445) (885)
Percentage of Shareholders Equity (+50 basis points) 0.0% (0.0)%
Shift in yield curves of -50 basis points 1,445 885
Percentage of Shareholders Equity (-50 basis points) 0.0% (0.0)%
The interest rate sensitivity analysis set out in the table above is illustrative only and is based on simplified scenarios over a
period of one year.
141
Liquidity risk
Liquidity risk is the risk that the Company is unable to meet its payment obligations associated with its financial liabilities when
they fall due and to replace funds when they are withdrawn. The consequence may be the failure to meet obligations to repay
depositors and fulfil commitments to lend.
2011
BWP’000s
Up to
1 month
1 – 3
months
3 – 12
months
Greater than
1 Year Total
Cash and short-term funds 5,102 – – – 5,102
Financial assets designated at fair value 2,246 – – 149,869 152,115
Derivative financial assets 119 – – 26,197 26,316
Loans and advances 2,658 2,249 263,040 13,164 281,111
Investment securities – – – 42,172 42,172
Prepayments and other receivables 120 – 7,457 – 7,577
Inter-company balances 58,837 18,815 – – 77,652
Property and equipment – – – 263 263
Intangible assets – – – 215 215
Deferred tax asset – – – 15,017 15,017
Investment in subsidiaries – – – 680,626 680,626
Loans to subsidiaries – – – 177,547 177,547
Total assets 69,082 21,064 270,497 1,105,070 1,465,713
Shareholders equity and liabilities
Equity – – – 311,547 311,547
Derivative financial liabilities 119 – – 46,852 46,971
Creditors and accruals 9,110 – – – 9,110
Borrowed funds – 8,550 177,003 429,648 615,201
Inter-company balances 431,705 51,179 – – 482,884
Total equity and liabilities 440,934 59,729 177,003 788,047 1,465,713
Net maturity gap (371,852) (38,665) 93,494 317,023 –
2010
BWP’000s
Up to
1 month
1 – 3
months
3 – 12
months
Greater than
1 Year Total
Cash and short-term funds 22,660 – – – 22,660
Financial assets designated at fair value – – – 64,028 64,028
Derivative financial assets – – – 19,464 19,464
Loans and advances 135,389 40,410 2,430 15,141 193,370
Investment securities – – – 38,502 38,502
Prepayments and other receivables 18,607 – – – 18,607
Inter-company balances – – 58,433 – 58,433
Property and equipment – – – 790 790
Deferred tax asset – – – 10,002 10,002
Investment in subsidiaries – – – 602,077 602,077
Loans to subsidiaries – – – 158,053 158,053
Total assets 176,656 40,410 60,863 908,057 1,185,986
Shareholders equity and liabilities
Equity – – – 303,747 303,747
Creditors and accruals 6,147 – – – 6,147
Borrowed funds – 7,328 10,081 409,619 427,028
Inter-company balances 449,064 – – – 449,064
Total equity and liabilities 455,211 7,328 10,081 713,366 1,185,986
Net maturity gap (278,555) 33,082 50,782 194,691 –
Financial risk management continued
ABC Holdings Limited ANNUAL REPORT 2011142
Non-derivative cash flow
The table below presents the cash flows payable by the Company under non-derivative financial liabilities and assets held for
managing liquidity risk by remaining contractual maturities at the date of the consolidated statement of financial position. The
amounts disclosed in the table are the contractual undiscounted cash flows, whereas the Company manages the inherent
liquidity risk based on expected undiscounted cash inflows:
2011
BWP’000s
Up to
1 month
1 – 3
months
3 – 12
months
Greater
than
1 year Total
Effect of
discount/
financing
rates Total
Creditors and accruals 9,110 – – – 9,110 – 9,110
Borrowed funds – 16,878 345,911 826,958 1,189,747 (574,546) 615,201
Inter-company balances 376,351 70,242 38,144 – 484,737 (1,853) 482,884
Total liabilities 385,461 87,120 384,055 826,958 1,683,594 (576,399) 1,107,195
2010
BWP’000s
Up to
1 month
1 – 3
months
3 – 12
months
Greater
than
1 year Total
Effect of
discount/
financing
rates Total
Creditors and accruals 6,147 – – – 6,147 – 6,147
Borrowed funds 7,640 53,202 327,318 409,618 797,778 (370,750) 427,028
Inter-company balances 449,681 3,921 – – 453,602 (4,538) 449,064
Total liabilities 463,468 57,123 327,318 409,618 1,257,527 (375,288) 882,239
The Company principally uses cash and short-term funds together with financial assets held for trading to manage liquidity risk.
Derivative financial liabilities cash flows
The table below presents the cash flows payable by the Company for derivative financial liabilities by remaining contractual
maturities at the date of the statement of financial position. The amounts disclosed in the table are the contractual undiscounted
nominal currency swap cash flows for the liability leg of such swaps, whereas the Company manages the inherent liquidity
risk based on expected undiscounted cash inflows:
2011
BWP’000s
Up to
1 month
1 – 3
months
3 – 12
months
Greater than
1 year Total
Derivative financial liabilities 4,647 6,616 3,137 – 14,400
2010
BWP’000s
Up to
1 month
1 – 3
months
3 – 12
months
Greater than
1 year Total
Derivative financial liabilities – – – – –
With the exception of swaps where on-going cashflows are settled on a gross basis, all derivative financial liabilities are settled
on a net basis.
143
The following table presents the Company’s assets and liabilities that are measured at fair value at 31 December 2011:
2011
BWP’000s
Quoted
prices
Level 1
Observable
input
Level 2
Un-
observable
inputs
Level 3
Total at
fair value
Assets
Financial assets designated at fair value – – 152,115 152,115
Derivative financial assets – 26,197 – 26,197
Total assets at fair value – 26,197 152,115 178,312
Liabilities
Derivative financial liabilities – – 46,852 46,852
Total liabilities at fair value – – 46,852 46,852
Financial assets and liabilities measured at fair value
Effective 1 January 2009, the Company adopted the amendment to IFRS 7 for financial instruments that are measured in the
balance sheet at fair value. This requires disclosure of fair value measurements by level of the following fair value measurement
hierarchy:
•	 Quoted prices (unadjusted) in active markets for identical assets or liabilities (level 1).
•	 Inputs other than quoted prices included within level 1 that are observable for the asset or liability, either directly (that is, as
prices) or indirectly (that is, derived from prices) (level 2).
•	 Inputs for the asset or liability that are not based on observable market data (that is, unobservable inputs) (level 3).
The fair value of financial instruments traded in active markets is based on quoted market prices at the balance sheet date. A
market is regarded as active if quoted prices are readily and regularly available from an exchange, dealer, broker, industry
group, pricing service, or regulatory agency, and those prices represent actual and regularly occurring market transactions on
an arm’s length basis. The quoted market price used for financial assets held by the Group is the current bid price. These
instruments are included in level 1.
The fair value of financial instruments that are not traded in an active market (for example, over-the-counter derivatives) is
determined by using valuation techniques. These valuation techniques maximise the use of observable market data where it
is available and rely as little as possible on entity specific estimates. If all significant inputs required to fair value an instrument
are observable, the instrument is included in level 2.
If one or more of the significant inputs is not based on observable market data, the instrument is included in level 3.
Specific valuation techniques used to value financial instruments include:
•	 quoted market prices or dealer quotes for similar instruments;
•	 the fair value of interest rate swaps is calculated as the present value of the estimated future cash flows based on observable
yield curves;
•	 the fair value of forward foreign exchange contracts is determined using forward exchange rates at the balance sheet date,
with the resulting value discounted back to present value; and
•	 other techniques, such as discounted cash flow analysis, are used to determine fair value for the remaining financial
instruments.
Financial risk management continued
ABC Holdings Limited ANNUAL REPORT 2011144
2010
Quoted
prices
Level 1
Observable
input
Level 2
Un-
observable
inputs
Level 3
Total at
fair value
– – – –
– – 64,028 64,028
– – 64,028 64,028
– – – –
– – – –
145
Assets and liabilities measured at fair value for level 3
The following table presents the changes in level 3 instruments for the year ended at fair value at 31 December 2011:
2011
BWP’000s
Trading
securities
Trading
derivatives
Debt or
equity
investments
Total
assets at
fair value
Derivative
financial
liabilities
Total
liabilities at
fair value
Assets
Opening balance – – 64,028 64,028 – –
Gains/Loss in PL – – 13,096 13,096 27,485 27,485
Purchases – – 74,991 74,991 19,486 19,486
Closing balance – – 152,115 152,115 46,971 46,971
2010
BWP’000s
Trading
securities
Trading
derivatives
Debt or
equity
investments
Total
assets at
fair value
Derivative
financial
liabilities
Total
liabilities at
fair value
Liabilities
Opening balance – – – – – –
Gains/Loss in PL (1,515) (1,515) – –
Purchases – – 65,543 65,543 – –
Closing balance – – 64,028 64,028 – –
Financial instruments not measured at fair value
Financial assets not measured at fair value where the carrying value is estimated to approximate the fair value of the instrument,
are as follows:
Basis of measurement
(i) Placements with other banks
Placements with other banks includes inter-bank placements and items in the course of collection. The fair value of floating
rate placements and overnight deposits is their carrying amount. 
The estimated fair value of fixed interest-bearing deposits is based on discounted cash flows using prevailing money-market
interest rates for debts with similar credit risk and remaining maturity.
(ii) Loans and advances
Loans and advances are accounted for on an amortised cost basis using the effective interest rate. Origination transaction
costs and origination fees received that are integral to the effective rate are capitalised to the value of the loans and amortised
through interest income as part of the effective interest rate. Loans and advances are stated net of allowances for specific and
portfolio impairment.
Financial risk management continued
ABC Holdings Limited ANNUAL REPORT 2011146
(iii) Investment securities
Investment securities include only interest-bearing assets held to maturity. Fair value for held to maturity assets is based on
market prices or broker/dealer price quotations. Where this information is not available, fair value is estimated using quoted
market prices for securities with similar credit, maturity and yield characteristics.
(iv) Deposits
The estimated fair value of deposits with no stated maturity, which includes non-interest-bearing deposits, is the amount repayable
on demand.
The estimated fair value of fixed interest-bearing deposits and other borrowings not quoted in an active market is based on
discounted cash flows using interest rates for new debts with similar remaining maturity.
(v) Inter-company balances and loans to subsidiaries
The balances with subsidiary companies are carried at amortised cost. The carrying amount approximates their fair value.
147
for the year ended 31 December 2011
Range
Number of
holders
% of
total holders
Number of
shares
% of
total holders
0 – 50,000 3,491 97.43% 6,539,648 4.38%
50,001 – 100,000 42 1.17% 3,188,633 2.13%
100,001 – 500,000 32 0.89% 5,766,667 3.86%
500,001 – 1,000,000 2 0.06% 1,583,674 1.06%
1,000,001 – 10,000,000 12 0.33% 42,952,915 28.74%
Above 10,000,000 4 0.12% 89,440,594 59.83%
3,583 100.00% 149,472,131 100.00%
analysis of shareholders
Top 10 shareholders as at 31 December 2011
Shareholder Shares % holding
1 African Development Corporation 34,684,220 23.20%
2 Shares held by and on behalf of DT Munatsi 23,223,154 15.54%
3 Old Mutual Life Assurance Co. of Zimbabwe Ltd 15,891,065 10.63%
4 International Finance Corporation 15,642,155 10.47%
5 Botswana Insurance Fund Management 9,965,436 6.67%
6 Shares held by and on behalf of B Moyo 7,119,958 4.76%
7 SCBN-SIMS 6,794,419 4.55%
8 Nederlandse Financierings-Maatschappij Voor Ontwikkelingslande 3,582,623 2.40%
9 Shares held by and on behalf of FM Dzanya 3,094,774 2.07%
10 SCBN-OTHER 2,666,647 1.78%
Total top 10 shareholders 122,664,451 82.07%
Other shareholders 26,807,680 17.93%
149,472,131 100.00%
Geographical analysis of shareholders
Region
Number of
holders
% of
total holders
Number of
shares
% of
total shares
Americas 17 0.47% 15,762,554 10.55%
Botswana 322 8.99% 23,755,950 15.89%
Europe 27 0.75% 3,767,206 2.52%
Mauritius 1 0.03% 34,684,220 23.20%
South Africa 74 2.07% 1,089,707 0.73%
Zimbabwe 2,391 66.73% 68,161,775 45.60%
Other 751 20.96% 2,250,719 1.51%
3,583 100.00% 149,472,131 100.00%
ABC Holdings Limited ANNUAL REPORT 2011148
This document is important and requires your immediate attention.
If you are in doubt as to the action you should take in relation to this document, please consult your stockbroker, banker, legal
advisor or other professional advisor immediately.
Action required:
1.	If you have disposed of all of your shares in ABC Holdings Limited, this circular should be delivered to the agent through
whom you have disposed such shares for onward transmission to the acquirer of those shares.
2.	A notice convening the 12th annual general meeting of shareholders of ABC Holdings Limited (“AGM”), to be held at
09h30 on Wednesday 30 May 2012 at the Boardroom at BancABC Botswana, ABC House, Plot 62433, Fairground Office
Park, Gaborone, is attached hereto, which notice forms an integral part of this Circular.
3.	 A form of proxy is also attached to the AGM notice and Shareholders who are unable to attend the AGM should
complete the attached form of proxy and return it to the registered office of the Company so as to be received by no
later than 09h30 on Tuesday 29 May 2012. Submission of a form of proxy will not preclude shareholders from attending
and voting in person at the AGM should they so desire.
(Registration number 99/4865)
(Incorporated in the Republic of Botswana)
(ABC Holdings Limited or “the Company”)
CIRCULAR TO SHAREHOLDERS
Regarding:
–	a waiver by shareholders of the obligation to make an offer to minority shareholders;
–	 amendments to the existing Memorandum and Articles of Association and the adoption of a Constitution in terms of
Section 43(3) of the Companies Act in place of the existing Memorandum and Articles of Association;
and enclosing:
–	 the biographies of directors retiring and standing for re-election;
–	 a notice of General Meeting;
–	 a form of proxy.
Sponsoring Broker	 	 	 	 	 	
						
149
contents
Definitions	 Page 151
Salient dates and times	 Page 151
Waiver of the obligation to make an offer to shareholders	 Page 152
Amendments to the existing Memorandum and Articles of Association	 Page 153
Announcement	 Page 155
Annual General Meeting	 Page 155
Notice of Annual General Meeting	 Page 156
Form of Proxy	 Page 159
ABC Holdings Limited ANNUAL REPORT 2011150
Definitions
In this circular unless otherwise stated or the context otherwise requires, the words in the first column have the meanings
stated opposite them in the second column, words in the singular include the plural and vice-versa, and words importing
natural persons shall include juristic persons, whether corporate or incorporate, and vice versa:
“ADC” African Development Corporation, a company incorporated in Mauritius;
“Act” the Companies Act, Act No 32 of 2004, CAP 42:01 of the Laws of Botswana as amended;
“Articles” the Articles of Association of ABC Holdings Limited as at date hereof;
“BSE” the Botswana Stock Exchange;
“Botswana” the Republic of Botswana;
“Circular” this circular dated 8 May 2012 including the annexures hereto, the notice of General Meeting
and form of proxy;
“Directors” the Board of Directors of ABC Holdings Limited;
“ABC Holdings Limited or the
Company”
ABC Holdings Limited (registration number 99/4865) a company incorporated in the Republic
of Botswana and listed on the BSE and ZSE;
“General Meeting” the Annual General Meeting of Shareholders to be held on 30 May 2012;
“Memorandum of Association” the Memorandum of Association of ABC Holdings Limited as amended as the date hereof;
“Notice” the Notice of the General Meeting attached to this Circular;
“Offer Price” means a price of BWP4.28 (four Botswana Pula and twenty eight Thebe) or the USD
equivalent thereof at a date to be determined per ordinary share at which price the
Shareholders will be entitled to subscribe for the Shares offered pursuant to the Rights Offer;
“Rights Offer” the offer of 83,333,333 shares to be made by the Company to shareholders on the basis
of the Rights Offer Share to 1.79 shares held;
“Resolutions” the resolutions reflected in the Notice of Meeting incorporated within this Circular;
“Shareholders” holders of Ordinary Shares of the Company; and
“ZSE” Zimbabwe Stock Exchange.
Salient Dates And Times (Year 2012)
Circular posted to shareholders of ABC Holdings on	 Tuesday 8 May 2012
Forms of proxy to be received by 09h30	 Tuesday 29 May 2012
Annual General Meeting at 09h30	 Wednesday 30 May 2012
The above dates and times are subject to change. Any amendment will be published in the press.
151
Directors:
Howard Buttery (Chairman)
Ngoni Kudenga
Doreen Khama
Hans Wasmus
Lakshmi Shyam-Sunder
Mark M Schneiders
Douglas T Munatsi
Francis M Dzanya
Bekithemba Moyo
CIRCULAR TO SHAREHOLDERS OF ABC HOLDINGS LIMITED
PART 1: Waiver of the obligation to make an offer to shareholders
1.	 The Purpose of Part 1 of the Circular
	 The purpose of this Part 1 of the Circular and the Notice is to furnish information to the shareholders as to the proposed
resolution for waiver of the possible obligation of ADC to make an offer to purchase shares of Shareholders, other than
ADC, at the Offer Price, which shareholders will be asked to approve, as special business, at the General Meeting.
2.	 Reasons for the Waiver
	 In terms of the BSE Requirements, if a person, including an existing shareholder acquires more than 35% of the issued
shares of a company listed on the BSE, that person is required to make an offer to acquire / purchase the shares of the
other shareholders (“the minorities”) at the price that person acquired the shares.
	 The BSE can grant a waiver of the obligation to make this offer.
	 ABCH is to make a renounceable Rights Offer to its shareholders, in terms of which ABCH seeks to raise BWP356,666,666
(the equivalent of USD50,000,000) and offers to shareholders 83 333 333 shares in ABCH at a price of P4.28 (or the USD
equivalent thereof) (“the Offer Price”) on the basis of one new offer share for every 1.79 ordinary shares held by a shareholder.
	 In terms of the BSE Requirements a rights offer is to be underwritten.
	 ADC, a substantial shareholder holding approximately 23.20% of the issued shares in ABCH will follow its rights to acquire
shares in the Rights Offer and is prepared to underwrite the Rights Offer, and subscribe for Rights Offer Shares not taken
up by shareholders, by exercising their rights, or by third parties who have acquired such rights from shareholders, at the
close of the Rights Offer.
	Depending on the take up of Rights Offer Shares by shareholders other than ADC and third parties, ADC may be required
to subscribe for Rights Offer Shares not taken up, and such shares when added to the Shares acquired by ADC in following
its rights as Shareholder and the Shares in ABCH already held by ADC, could result in ADC holding more than 35% of the
then issued shares (after the Rights Offer) of ABCH.
	 In terms of the BSE Requirements, ADC would be obliged to make an offer to all other shareholders of ABCH to acquire
the shares in ABCH held by them, at a price of P4.28 (or the USD equivalent thereof) per share. The underwriting agreement
is conditional upon the wayver being obtained.
	 ABCH made application to the BSE to waive the requirement / obligation for ADC to make such an offer. The BSE has
indicated it will waive the requirement provided that, inter alia, the majority of independent shareholders other than ADC
waive the obligation also.
	Accordingly the Board seeks an ordinary resolution of independent shareholders other than ADC, to waive the requirement.
ABC Holdings Limited ANNUAL REPORT 2011152
The Board is of the view that the Rights Offer is essential to the Company:
	 i.	to enable it to complete its retail banking roll out (to which substantial amounts of money have already been invested)
by further investment in systems, people and distribution channels;
	 ii.	 to increase the capital of each of its operating subsidiaries;
	 iii.	 to enable each of its operating subsidiaries to grow its footprint and market share in each country of operation.
	 iv.	 to enable each subsidiary to be rated in the top ten of banks in the country of its operation.
	 Importantly all funds paid for Rights Offer Shares will accrue to the Company.
	Full details of the Rights Offer will be available in a circular and prelisting statement to be made available to shareholders
prior to the General Meeting.
	 The Rights Offer cannot be proceeded with unless underwritten.
	 Shareholders support for the Underwriting by granting the waiver is requested.
PART 2: Amendments to the existing Memorandum and
Articles of Association
1.	 Purpose of Part 2 of the Circular
	 The purpose of Part 2 the Circular and the Notice is to furnish information to the Shareholders as to the proposed
amendments to the Articles of Association which Shareholders will be asked to approve as by way of resolution as special
resolution and ordinary resolution special business at the General Meeting:
	 a.	 the adoption of a new Constitution in terms of section 43(3) of the Companies Act in place of the existing Articles of
Association that amends the Articles of Association to bring it in line with the Act and such other changes as are required
to update the Articles of Association in line with relevant statutes and current trends in corporate governance; and
	 b.	authorising the Directors to take all such steps and sign all such documents as are necessary to give effect to the
resolutions passed at this meeting.
2.	 Reasons for Amendments
	 It is sought to amend the Articles of Association of the Company to effect the substantive changes outlined below.
	 Adoption of a Constitution
	 In terms of the Act, which came into force on 3 July 2007, any existing Company which has as its Constitution, a Memorandum
and Articles of Association, is not entitled to amend such a document unless it consolidates both documents into a single
document known as the “Constitution”.
	It is proposed that the Memorandum and Articles of Association be amended and a Constitution adopted through the
procedures set out in this circular.
	The Constitution, a draft of which is available for inspection at the registered office of the Company, during normal business
hours from 10 May 2012 until the date of the AGM, will include amendments to the existing Articles of Association that
include the following:
	 (i)	amendments to bring the Constitution in line with mandatory changes as introduced by the Act as read together with
the BSE Listings Requirements (such changes include the removal of references to authorized share capital; references
to circumstances in which the Act allows for the Company to give financial assistance to purchase its own shares,
mandatory provisions on notice period to call meetings, etc) and to update references to the Act to reflect the appropriate
reference in the new Companies Act;
	 (ii)	amendments to bring the Constitution in line with the most current trends in corporate governance as referenced by
the BSE Guidelines on Corporate Governance and international guidelines such as the King Reports on Corporate
Governance
153
(iii)	 amendments to provide for uncertificated shares; and
	 (iv)	 formal amendments as to grammar and language to avoid repetition or extraneous provisions.
	The Constitution does not incorporate the objects of the Company, which has been rendered unnecessary by the provision
of the current Companies Act, which makes the provisions relating to objects optional.
PART 3: BIOGRAPHIES OF DIRECTORS
ABCH provides the following Biographies of directors standing for re-election and whose appointments are to be ratified at the
Annual General Meeting
Dr Lakshmi Shyam-Sunder (55)
Lakshmi Shyam-Sunder is the Chief Finance Officer and Director of the Multilateral Investment Guarantee Agency at the
World Bank Group.
She has wide-ranging financial experience, which includes a period on the Finance Faculty of the MIT Sloan School of
Management in the USA and at the Tuck School of Business Administration, Dartmouth College. She has also consulted on
finance, valuation, and risk management topics for financial institutions and corporations in the United States, for the US
Government and financial institutions in emerging markets.
She joined the IFC in 1994 and prior to being appointed a Director held a number of positions within the institution working in
treasury and portfolio management before being named Director of Risk Management and Financial Policy for IFC.
She serves on the Boards and Risk and Finance Committees of some IFC’s client companies.
She has a Ph.D in Finance from the MIT Sloan School of Management and an MBA from the Indian Institute of Management,
Ahmedabad, India.
Douglas T Munatsi
Douglas “Doug” Munatsi has been Chief Executive Officer of the ABC Holdings Group since its formation in 2000.
Involved in the world of finance and banking for his entire career, he has served as an executive in the Southern Africa regional
mission of the International Finance Corporation (IFC), the private sector arm of the World Bank.
He went on to establish Heritage Investment Bank (HIB), an investment bank which established a reputation for the successful
introduction of innovative capital market products. Under his guidance, HIB became one of the leading merchant banks in
Zimbabwe. In 1997, together with Anglo American of Zimbabwe, which then controlled 43% of First Merchant Bank of
Zimbabwe (“FMB”), he successfully negotiated the merger between HIB and FMB. He became Managing Director of the
merged bank, which continued to operate under the First Merchant Bank identity and remained in this position until the
formation of ABC Holdings.
His qualifications include a Bachelor of Business (Hon) degree from the University of Zimbabwe, an MBA from the American
University in Washington DC and an AMP from Harvard Business School.
Mark M Schneiders
Mark Schneiders has more than 27 years of banking sector experience in various wholesale and private banks within African
banks and around the globe serving as an entrepreneurial finance professional. He has held various positions that include
Managing Director with ING Financial Institutions in Amsterdam.
Mr Schneiders has extensive experience with company mergers, building new markets and setting up retail bank businesses
in a variety of countries including Switzerland, The Netherlands, Spain, Curaçao, Argentina, Venezuela, Hong Kong and USA.
He was appointed to the Board on 9 December 2011.
He holds a Bachelor’s and Master’s degree in law from the University of Leiden, The Netherlands, and has completed the
Advanced Management Program at Harvard Business School and banking management programs at INSEAD (Cedep).
Any member wishing to nominate a person to be considered for election as directors of the Company, in place of those
retiring, should submit a written nomination, proposed by that member and seconded by another member, containing the
ABC Holdings Limited ANNUAL REPORT 2011154
written consent of the nominee to be appointed a director, and the curriculum vitae of the nominee, to the Registered Office
of the Company at least five working days prior to the date of the Annual General Meeting.
Announcement
The results of the special business that is to be voted on at the Annual General Meeting will be announced in the press on or
before 5th June 2012.
Annual General Meeting
Following hereafter and forming part of the Circular, is the Notice of the Annual General Meeting of Shareholders of ABC
Holdings Limited to be held at the Boardroom, ABC House, BancABC Botswana,, Plot 62433, Fairground Office Park, Gaborone,
Botswana, on Wednesday 30 May 2012 at 09h30 for the purpose of considering the business of the Annual General Meeting
and of considering the special business.
Shareholders who are unable to attend the General Meeting and who wish to be represented thereat, are requested to
complete and return the attached form of proxy in accordance with the instructions contained therein and in the Notice of the
Annual General Meeting.
A proxy need not be a Member of the Company.
By order of the Board
M Vogt
Secretary to the Board of Directors
Gaborone
24 April 2012
Registered Office:
Rhoss (Pty) Ltd, Unit 2, Plot 8884, Rizika House, African Mall, Gaborone, Botswana.
155
(Registration number 99/4865)
(Incorporated in the Republic of Botswana)
(ABC Holdings Limited or “the Company”)
Howard Buttery (Chairman)
Ngoni Kudenga
Doreen Khama
Hans Wasmus
Lakshmi Shyam-Sunder
Mark Schneiders
Douglas T Munatsi
Francis M Dzanya
Bekithemba Moyo
Notice of Annual General Meeting
Notice is hereby given that the Annual General Meeting of Shareholders of the Company will be held at the Boardroom, ABC
House, BancABC Botswana, Plot 62433, Fairground Office Park, Gaborone, Botswana on Wednesday 30 May 2012 at 09h30
for the purpose of transacting the following ordinary and special business and considering and if deemed fit, passing, the following
resolutions:
Ordinary Business:
1.	 To read the notice convening the meeting.
2.	To receive, consider, and adopt the annual financial statements for the year ended 31 December 2011, including the
Chairman’s statement, Directors’ report and Auditors’ report.
3.	 To approve the remuneration of the Directors for the year ended 31 December 2011.
4.	 To note that Directors, Dr Shyam-Sunder, Mr Wasmus and Mr Munatsi retire by rotation in terms of Article 67 of the
Articles of Association and to re-elect Dr Shyam-Sunder and Mr Munatsi who being eligible, offer themselves for re-
election.
5.	 To ratify the appointment of Mr Mark Martijn Schneiders as a director of the Company.
6.	 To appoint auditors for the ensuing year and to fix their remuneration.
SPECIAL Business:
1.	 To consider waiver of the BSE requirement that ADC in the event it acquires such number of Right Offer Shares,
pursuant to the Rights Offer and the underwriting thereof, which together with the shares already held by it, ADC make
an offer to purchase the shares in ABCH held by other shareholders at a price of P4.28.
2.	 To amend the Articles of Association and to adopt a Constitution in its place under section 43(3) of the Act.
Ordinary Resolution 1:
To approve the annual financial statements for the year ended 31st December 2011, including the Chairman’s statement,
Directors’ report and Auditor’s report.
Ordinary Resolution 2:
To approve the remuneration of Directors for the year ended 31 December 2011.
ABC Holdings Limited ANNUAL REPORT 2011156
Ordinary Resolution 3:
To elect Directors in place of those retiring by rotation in accordance with the provisions of article 67 as read with article 73 of
the Company’s Articles of Association. In this regard Dr Shyam-Sunder retires by rotation and being available and eligible offers
herself for re-election.
Ordinary Resolution 4:
To elect Directors in place of those retiring by rotation in accordance with the provisions of article 67 as read with article 73 of
the Company’s Articles of Association. In this regard Mr. Munatsi retires by rotation and being available and eligible offers
himself for re-election.
Ordinary Resolution 5:
To ratify the appointment of Mr Mark Martijn Schneiders as a director of the Company.
Ordinary Resolution 6:
To appoint the Auditors for the Company for the ensuing year.
Ordinary resolution 7:
To waive the requirement set forth in the BSE Requirements that a person acquiring more than 35% of the issued share capital
of a company, in the instance of African Development Corporation (“ADC”) in the event that pursuant to the Rights Offer and
the Underwriting thereof, ADC acquires Rights Offer Shares which together with the shares already held by it will result in
ADC holding more than 35% of the issued shares of the Company.
Special Resolution 1:
Resolved to replace the Memorandum and Articles of Association of the Company in their entirety with a Constitution, a draft
of which Constitution is available for inspection from 10 May 2012 to the date of the General Meeting at the Company’s
registered office.
Ordinary Resolution 8:
The Directors be and are hereby authorized to take such steps and sign all such other documents as are necessary to give
effect to the resolutions passed at this meeting.
Voting and proxies
All holders of Ordinary Shares entitled to vote will be entitled to attend and vote at the Annual General Meeting.
A holder of shares who is present in person, by authorised representative or by proxy, shall have one vote on a show of hands
and have one vote for every ordinary share held on a poll.
Each Shareholder entitled to attend and vote at the Annual General Meeting is entitled to appoint one or more proxies (none
of whom need be a Shareholder of the Company) to attend, speak and subject to the Articles of Association of the Company,
vote in his/her/its stead.
The form of proxy for the Annual General Meeting, which sets out the relevant instructions for its completion, is annexed
hereto.
In order to be effective, a duly completed form of proxy must be received at the Registered Office of the Company, Rhoss
(Pty) Ltd, Unit 2, Plot 8884, Rizika House, African Mall,  Gaborone, Botswana by not later than 09h30 on Tuesday 29 May 2012.
By Order of the Board
M Vogt
Secretary to the Board of Directors
157
Notes:
ABC Holdings Limited ANNUAL REPORT 2011158
(Registration number 99/4865)
(Incorporated in the Republic of Botswana)
(ABC Holdings Limited or “the Company”)
Form of Proxy
For completion by holders of Ordinary Shares
PLEASE READ THE NOTES OVERLEAF BEFORE COMPLETING THIS FORM.
EXPRESSIONS USED IN THIS FORM SHALL, UNLESS THE CONTEXT REQUIRES OTHERWISE, BEAR THE SAME
MEANINGS AS IN THE CIRCULAR TO SHAREHOLDERS OF ABC HOLDINGS LIMITED ISSUED ON 8 MAY 2012.
For use at the Annual General Meeting of Shareholders of the Company to be held at the Boardroom, ABC House, BancABC
Botswana, Plot 62433, Fairground Office Park, Gaborone, Botswana on 30 May 2012 at 09h30.
I/We
(Name/s in block letters)
Of
(Address)
Appoint (see note 2):
1. or failing him/her,
2. or failing him/her,
3. the Chairman of the Meeting,
as my/our proxy to act for me/us at the General Meeting which will be held, in addition to considering the ordinary business,
for the purpose of considering and if deemed fit, passing with or without modification, the resolutions to be proposed under
the special business vote thereat and at each adjournment thereof, and to vote for or against the resolutions and/or abstain
from voting in respect of the Ordinary Shares registered in my/our name in accordance with the following instructions (see
note 2):
Number of Ordinary Shares
For Against Abstain
1. Ordinary Resolution 1
2. Ordinary Resolution 2
3. Ordinary Resolution 3
4. Ordinary Resolution 4
5. Ordinary Resolution 5
6. Ordinary Resolution 6
7. Special Resolution 1
8. Ordinary Resolution 7
Signed at					 on 			 day of 				 2012
Signature Assisted by (where applicable)
Each Shareholder is entitled to appoint one or more proxies (who need not be Member/s of the Company) to attend, speak
and vote in place of that Shareholder at the General Meeting.
Please read the notes on the reverse side hereof.
159
Notes
  1.	 A Shareholder must insert the names of two alternative proxies of the Shareholder’s choice in the space provided, with
or without deleting “Chairman of the Annual General Meeting”. The person whose name appears first on the form of
proxy, and whose name has not been deleted will be entitled to act as proxy to the exclusion of those whose names
follow.
  2.	 A Shareholder’s instructions to the proxy must be indicated by the insertion of the relevant number of votes exercisable
by the Shareholder in the appropriate space provided. Failure to comply herewith will be deemed to authorise the proxy
to vote at the General Meeting as he/she deems fit in respect of the Shareholder’s votes exercisable thereat, but where
the proxy is the Chairman, failure to comply will be deemed to authorise the proxy to vote in favour of the resolution.
A Shareholder or his/her proxy is obliged to use all the votes exercisable by the Shareholder or by his/her proxy.
  3.	 Forms of proxy must be lodged at or posted to the Registered Office of the Company, Rhoss (Pty) Ltd, Unit 2, Plot 8884,
Rizika House, African Mall, Gaborone, Botswana, or PO Box 1882, Gaborone, Botswana, to be received not less than
24 hours before the Annual General Meeting on 30 May 2012 at 09h30.
  4.	 The completion and lodging of this form will not preclude the relevant Shareholder from attending the General Meeting
and speaking and voting in person thereat to the exclusion of any proxy appointed in terms hereof should such
Shareholder wish to do so.
  5.	 The Chairman of the General Meeting may reject or accept any form of proxy not completed and/or received other than
in accordance with these notes provided that he is satisfied as to the manner in which the Shareholder concerned
wishes to vote.
  6.	 An instrument of proxy shall be valid for the General Meeting as well as for any adjournment thereof, unless the contrary
is stated thereon.
  7.	 A vote given in accordance with the terms of a proxy shall be valid, notwithstanding the previous death or insanity of the
Shareholder, or revocation of the proxy, or of the authority under which the proxy was executed, or the transfer of the
Ordinary Shares in respect of which the proxy is given, provided that no intimation in writing of such death, insanity or
revocation shall have been received by the Company not less than one hour before the commencement of the General
Meeting or adjourned General Meeting at which the proxy is to be used.
  8.	 The authority of a person signing the form of proxy under a power of attorney or on behalf of a company must be
attached to the form of proxy, unless the authority or full power of attorney has already been registered by the Company
or the Transfer Secretaries.
  9.	 Where Ordinary Shares are held jointly, all joint Shareholders must sign.
10.	A minor must be assisted by his/her guardian, unless relevant documents establishing his/her legal capacity are produced
or have been registered by the Company.
ABC Holdings Limited ANNUAL REPORT 2011160
company information
ABC Holdings Limited
Directors: H Buttery, F Dzanya, D Khama, N Kudenga,
B Moyo, D T Munatsi, L Shyam-Sunder, J Wasmus,
M Schneiders
ABC House, Plot 62433, Fairground Office Park,
Gaborone, Botswana
Tel: +267 3674300 Fax: +267 3902131
www.bancabc.com
Administrative office – South Africa
205 Rivonia Road, Morningside, 2196
Johannesburg, South Africa
Tel: +27 (11) 722 5300 Fax: +27 (11) 722 5360
BancABC Botswana
Directors: D Khama, L Makwinja, B Moyo,
D T Munatsi, J Kurian
BancABC House, Plot 62433,
Fairgrounds Office Park, Gaborone, Botswana
Tel: +267 3674300 Fax: +267 3902131
Branches:
Square branch +267 3160400
Fairgrounds branch +267 3674300
Francistown branch +267 2414133
Game City Branch +267 3704700
mybancbw@bancabc.com
BancABC Mozambique SA
Directors: B Alfredo, H Chambisse, D T Munatsi,
L S Simao, T E T Venichand, J Sibanda, F Mucave
Head Office: 999 Avenida Julius Nyerere,
Polana Cimento, Maputo, Mozambique
Tel: +258 (21) 482100 Fax: +258 (21) 486808
Branches:
Beira branch +258 (23) 320655/7
Chimoio branch +258 (25) 123007/8
Tete branch + 258 (25) 222984
Matola branch +258 (21) 720005/8
Chundi branch +258 (21)493715
abcmoz@bancabc.com
BancABC Tanzania
Directors: J P Kipokola, R Dave, J Doriye, W Nyachia,
D T Munatsi, L Sondo, B Nyoni
1st Floor Barclays House, Ohio Street,
PO Box 31, Dar es Salaam, Tanzania
Tel: +255 (22) 2111990 Fax: +255 (22) 2112402
Branches:
Kariakoo Branch +255 (22) 2180108/182/212
Upanga Branch +255 (22) 2121537-9
Quality Center Branch +255 22 2865904-10
abctz@africanbankingcorp.com  abctz@bancabc.com
Tanzania Development Finance Company Limited
Directors: J P Kipokola, J Doriye, W Nyachia,
D T Munatsi, B Nyoni
1st Floor Barclays House, Ohio Street,
Dar es Salaam, Tanzania
PO Box 2478, Dar es Salaam, Tanzania
Tel: +255 (22) 2111990 Fax: +255 (22) 2112402
abctz@africanbankingcorp.com  abctz@bancabc.com
BancABC Zambia
Directors: C Chileshe, D T Munatsi, C Simatyaba,
J W Thomas, L Mwafulilwa, A Dudhia, R Credo,
J Muwo
BancABC House, Plot 746B, Corner Nasser Road/
Church Road, Ridgeway, Lusaka
Tel: +260 (211) 257970-5 Fax: +260 (211) 257980
Branches:
Cairo Road branch +260 (211) 227690/3
Kitwe branch +260 (212) 222426/7
Livingstone branch +260 (213) 320681
Lumumba Road branch +260 (211) 230796
Ndola branch +260 (212) 621715/6
abcz@bancabc.com
BancABC Zimbabwe
Directors: N Kudenga, P Sithole, F E Ziumbe,
N M Matimba, A Mabhena, F M Dzanya,
H Matemera,T W Mudangwe
1 Endeavour Crescent, Mount Pleasant Business Park,
Mount Pleasant, Harare, Zimbabwe
Tel: +263 (4) 369260-99 Fax: +263 (4) 338064
Branches:
Beitbridge branch +263 (286) 23172/3/4
Checheche branch +263 (317) 258; 277; 314; 327
Chiredzi branch +263 (31) 2254-6/413609
Graniteside branch +263 (4) 781046/7; 781615-7
Heritage branch +263 (4) 781837-40
Hotsprings branch +263 772 456 188; 772 732 014
Hwange branch +263 (281) 21703-10
Kwekwe branch +263 (55) 25216-23
Jason Moyo branch +263 (9) 73700-11
Msasa branch +263 (4) 486087; 486139; 486508
Mt. Pleasant branch +263 (4) 369260-99
Mutare branches: Main +263 (20) 67939; 67941
Manica Centre +263 (20) 68255/69/78/79
Redcliff branch +263 (55) 62875-82
Victoria Falls branch +263 (13) 45101-8
TSF Branch +263 (4) 667039; 667892
Zvishavane branch +263 (51) 2940-4
abczw@africanbankingcorp.com
Abch annual report dec 2011 final

Abch annual report dec 2011 final

  • 1.
    ABC Holdings Limited AnnualReport 2011 ABC Holdings Limited Annual Report
  • 2.
    ABC Holdings Limitedis the parent company of a number of banks operating under the BancABC brand in Sub-Saharan Africa, with operations in Botswana, Mozambique, Tanzania, Zambia and Zimbabwe. A group services office is located in South Africa. Our vision is to be Africa’s preferred banking partner by offering world-class financial solutions. We will realise this by building profitable, lifelong customer relationships through the provision of a wide range of innovative financial products and services – to the benefit of all our stakeholders. The Group offers a diverse range of services including but not limited to the following: corporate banking, treasury services, Retail SME Banking, asset management and stock broking. ABC Holdings Limited is registered in Botswana. Its primary listing is on the Botswana Stock Exchange, with a secondary listing on the Zimbabwe Stock Exchange. ABOUT BancABC
  • 3.
    CONTENTS ifc Our values 1 Highlights 2 Five-year financial highlights 3 Salient features 4 Chairman’s report 10 Chief Executive Officer’s report 24 Corporate social responsibility report 28 Risk and governance report 39 Directors and Group management 43 Directors’ responsibility 44 Directors’ report 47 Annual financial statements 148 Analysis of shareholders ibc Company information
  • 4.
    Our core values centreon five distinct areas. They remain the guiding principles by which we operate and form the basis of our corporate personality. OUr VALUES Describes our people focused, accessible, personal and customised approach, anchored on the vital African energy. In short, we are passionate because we believe in and love what we do. Is a key value of the Group, which is the ability to be reliable, ethical, credible, and trustworthy with a great sense of heritage. Our cast iron ethics underpin our unquestionable character and business practice. Are the essence of our existence. Our world-class staff, clients, shareholders and other stakeholders define our ambitions, success and passion. Our passion for people makes us customer-centric. Embodies the key traits of being visionary, dynamic, energetic, challenging and agile. In practical terms, adoption of this core value means devotion to driving change by provoking new ideas and always doing things differently. Entails being uncomprimising, focused, and confident in offering world-class products and services. We strive for excellent in what we do and are always seeking to improve our performance.
  • 5.
    Total income upby 21% from BWP546 million to BWP659 million Cost to income ratio decreased to 74% (2010: 77%) Net operating income was flat at BWP113 million compared to BWP111 million despite a charge of BWP35 million in respect of the fair value loss and additional interest arising from the International Finance Corporation (IFC) convertible loan. Excluding the impact of this convertible loan, net operating income increased by 33% Pre-tax profit was 18% up from BWP91 million to BWP108 million Operating expenses up by 25% from BWP435 million to BWP546 million largely due to increased product and branch roll out in Retail and SME banking Attributable profit to shareholders up 24% from BWP67 million to BWP83 million Zambia Tanzania Mozambique Zimbabwe highlights Basic EPS of 56.6 Thebe (2010: 46.3 Thebe) Deposits increased by 50% from BWP4.9 billion to BWP7.4 billion Loans and advances almost doubled from BWP3.1 billion to BWP6.1 billion Total assets increased by 53% from BWP6 billion to BWP9.2 billion Average return on equity at 16% (2010: 16%) Retail Branches have increased to 49 (inclusive of consumer banking branches) from 31 branches in 2010 Staff numbers increased to 1,008, compared to 668 as at the end of December 2010 Botswana 1
  • 6.
    five-year financial highlights 31Dec 2011 US$’000s 31 Dec 2010 US$’000s 31 Dec 2009 US$’000s 31 Dec 2008 US$’000s 31 Dec 2007 US$’000s Income statement Net interest income after impairment 48,692 41,542 17,948 20,498 12,152 Non-interest revenue 47,692 38,930 37,402 31,650 37,849 Total income 96,384 80,472 55,350 52,148 50,001 Operating expenditure (79,873) (64,089) (51,610) (34,679) (26,126) Net income from operations 16,511 16,383 3,740 17,469 23,875 Share of (losses)/profits of associates and joint venture (757) (2,966) 2,281 337 540 Profit before taxation 15,754 13,417 6,021 17,806 24,415 Taxation (2,924) (3,314) 2,225 (4,905) (3,417) Profit for the year 12,830 10,103 8,246 12,901 20,998 Attributable to   Equity holders of parent 12,143 9,827 8,202 12,592 20,174   Minority interests 687 276 44 309 824 Profit for the year 12,830 10,103 8,246 12,901 20,998 Balance sheet Cash and cash equivalents 166,122 154,997 132,194 68,056 87,832 Financial assets held for trading 86,980 173,375 134,707 90,956 143,642 Financial assets designated at fair value 24,771 12,274 – – – Derivative assets held for risk management 4,320 6,516 1,195 5,891 – Loans and advances to customers 811,940 477,415 299,099 298,450 207,372 Investments 11,513 8,224 7,387 8,988 11,795 Investment in associates and joint venture 2,343 5,405 6,138 5,471 5,064 Other assets and investment property 32,773 34,048 32,123 14,101 16,426 Property and equipment 68,788 51,217 41,818 28,776 9,178 Intangible assets 17,417 8,903 7,558 5,653 5,824 1,226,968 932,374 662,219 526,342 487,133 Shareholders’ equity 81,839 67,911 62,325 60,572 54,230 Deposits 985,260 761,083 502,932 374,385 326,096 Derivative liabilities held for risk management 6,288 162 293 294 849 Borrowed funds 131,167 89,868 81,519 79,565 96,855 Other liabilities and taxation 22,414 13,350 15,151 11,526 9,103 1,226,968 932,374 662,219 526,342 487,133 Shares in issue 149,472,131 146,419,524 146,419,524 146,419,524 132,568,680 Cost to income ratio (%) 74 77 82 59 47 Average shareholders’ equity 74,875 65,118 61,449 57,401 50,456 Return on average shareholders’ equity (Headline) 16% 15% 13% 23% 42% Net asset value per share (cents) 54.8 44.7 40.9 39.7 39.4 Closing exchange rates to US$ Botswana Pula 7.49 6.45 6.67 7.54 6.02 Euro 0.77 0.75 0.69 0.72 0.68 Mozambican Metical 27.31 32.58 29.19 25.50 25.86 Tanzanian Shilling 1,590.01 1,505.01 1,339.51 1,315.02 1,146.01 Zambian Kwacha 5,110.01 4,800.00 4,650.00 4,795.00 3,850.00 Zimbabwe Dollar (dropped 10 zeros in 2008)   – official – – – 5,059,942.76 30,000.00   – calculated – – – 642,901,315.78 4,948,961.54 on a historical cost basis in US$’000s five-year financial highlights ABC Holdings Limited ANNUAL REPORT 20112
  • 7.
    salient features 2011 2010% change Income statement (BWP’000s) Profit attributable to ordinary shareholders 83,002 66,710 24% Balance sheet (BWP’000s) Total assets (attributable) 9,183,888 6,011,439 53% Loans and advances 6,077,399 3,078,110 97% Deposits 7,374,700 4,907,045 50% Net asset value 596,811 422,336 41% Financial performance (%) Return on average equity 16% 16% Return on average assets 1.2% 1.3% Operating performance (%) Non-interest income to total income 49% 48% Cost to income ratio 74% 77% Impairment losses on loans and advances to gross average loans and advances 1.7% 0.6% Effective tax rate 19% 25% Share statistics (000’s) Number of shares in issue 149,473 146,420 2% Weighted average number of shares 146,760 143,956 2% Share statistics (thebe) Earnings per share 56.6 46.3 22% Dividend per share 17.5 10.0 75% Net asset value per share 3.99 2.93 36% 3
  • 8.
    GloBAl AnD reGionAleConoMiC DeveloPMents The V-shaped economic recovery experienced in 2010 and early 2011 was spearheaded by China and India before quickly spreading to other emerging and developing markets and to a lesser extent developed economies. Any hope of a sustained economic recovery, however, suffered a major setback following the re-emergence of the Euro-debt crisis which entered a perilous new phase. The adverse spill- over effects of the Euro-debt crisis led to high risk aversion and tight financial conditions, triggering a considerable slow- down in economic activities in most advanced economies. Emerging and developing economies have not been spared from the contagion effect as witnessed by the downturn in economic growth. eConoMiC Growth PerforMAnCe in ABC MArkets Recovery from the global crisis is, however, well underway in the Sub-Saharan Africa (SSA) with most countries now fairly close to the mid 2000s GDP growth levels of between 5% and 6%. Average economic growth in Mozambique, Tanzania and Zambia has been well above the regional average. On a brighter note, Zimbabwe’s performance over the last three (3) years has also shown that the country has immense potential to surpass the regional average growth rate, albeit coming off a low base. In Botswana, although economic growth has been commendable, the country is more prone to negative external shocks. Nonetheless, in 2011, economic growth momentum in most regional economies was not affected by the evolving Euro-debt crisis. In 2012, considerable headwinds from slower growth in global economy, lower commodity prices, heightened uncertainty in global financial markets and monetary policy tightening pose significant downside risks to growth prospects. Group underlying performance during 2011 was strong despite a tough business environment. The Group continued its Retail Banking expansion with significant investment made in expanding the branch network as well as the underlying systems to effectively serve customers in this market segment. Business growth was phenomenal and this lays a strong foundation for the future. Retail Banking is expected to start contributing a greater portion of revenue and profitability going forward, which bodes well for the Group. grOUP chairMan’s rePOrtgrOUP chairMan’s rePOrt ABC Holdings Limited ANNUAL REPORT 20114
  • 9.
    GDP Growth Trendin ABC Markets The Botswana economy is estimated to have grown by 6.2% in 2011, largely due to strong performance in construction, mining and manufacturing sectors. Botswana’s economic growth remains inextricably linked to global developments particularly via diamonds exports which are highly dependent on the global economic performance. Despite the weakening global economic prospects, Mozambique remained resilient. The economy is estimated to have grown by 7.2% in 2011 and it is projected to register a stronger growth of 7.5% in 2012. An acceleration of both megaprojects and traditional exports helped offset the increase in the import bill for fuel products and mega­ projects investments during 2011. Economic growth in Tanzania is estimated to have slowed down from 7.0% in 2010 to 6.1% in 2011 largely due to the negative impact of power shortages. The country’s power generating capacity was affected by the less than normal rainfall for 2011. Efforts to restore power generation are underway but will take time to be implemented. Zambia is one of the most stable countries in the Southern African Development Community (SADC) and Africa as a whole. Despite being home to a more competitive political landscape, Zambia has enjoyed political stability for the past two decades with no major conflict. The country has been able to hold successful elections for the past two decades with smooth changeover of power from one political party to another. The Zambian economy has over the years performed very well due to strong macroeconomic policies, favourable external environment in some years 5
  • 10.
    Chairman’s report continued InBotswana, average annual inflation increased by 1.6 percentage points from 6.9% in 2010 to 8.5% in 2011. During the year, inflation was well above the Central Bank’s medium-term range of 3 – 6%. Higher inflation from South Africa, the country’s major import source accounting for 70% of total imports has also been transmitted to Botswana’s domestic prices through increased imported inflation. Mozambique witnessed a dramatic collapse in inflation that stood at 16.5% in January 2011 and receded remarkably to end the year at 5.5%. Average inflation for the year was 10.5%, which compared favourably to 12.7% in 2010. In addition to targeting the stock of base money, and hence money supply, the Central Bank has been using the exchange rate as a tool to fight inflation. East African countries suffered from similar exogenous shocks including a drought induced spiral in food prices that pushed headline inflation higher. However, the accelera­ tion in inflation in Tanzania came considerably later, relative to the experience of Uganda and Kenya. In Tanzania, annual inflation which stood at 6.4% in January was relentlessly on the rise, surging for consecutive months to end the year on a high of 19.8%. Average annual inflation stood at 12.7%, which was significantly higher than 7.2% in 2010. and extensive debt relief. Over the years spanning from 2001 to 2011, average economic growth has been 5.7%, whichisalmostinlinewithSSAgrowthaverage.Importantly, economic growth has been broad-based and less dependent on mining as was the case in the past. In Zimbabwe, the country has immensely benefited from the use of the multicurrency system, which has brought the much needed economic stability. Having emerged from 10 years of uninterrupted depression, the economy is estimated to have posted a positive growth for the third consecutive year. Albeit coming from a low base, the economy grew by 5.7% in 2009, 8.1% in 2010 and 9.3% in 2011. Good economic growth has largely been under­ pinned by strong growth in agriculture, mining, and tele­ communications sectors. Inflation Rate Developments During 2011, inflation surged in a number of SSA countries with East African countries experiencing precipitous increases towards the end of the year. Elevated inflation pressures were mainly emanating from higher food and fuel prices, particularly in non-oil exporting countries. ABC Holdings Limited ANNUAL REPORT 20116
  • 11.
    7-year bond auctionthat was planned for end of August. Correspondingly, for the first time since mid 2009, the weighted interbank rate increased to double digit levels in October and peaked at above 30% in December in sympathy with the tight liquidity conditions. In Zambia, the central bank significantly reduced the utilisation of open market operations (OMOs) to drain liquidity. Rates fell accordingly, with the overnight lending facility rate falling to 7.5% in mid November, from a high of 18% in the third quarter of the year. Yields on Government securities also fell in line with the increased liquidity. In October, 91-day and 364-day yields which stood at 8.6% and 15.3% respectively, fell by 150bps and 190bps to end the year at 7.1% and 13.4%. Since dollarisation, Zimbabwe’s central bank has played a peripheral role following its loss of the lender of last resort function. As a result, there is no benchmark policy rate to guide the market. This notwithstanding, lending and investment rates firmed in the last quarter of 2011 on the back of persistent liquidity challenges and high credit demand. During the fourth quarter of 2011, nominal lending rates of corporate loans for banks ranged between 8% and 30%, with the majority of banks hovering around the 20% mark. Time deposits, which constitute less than 10% of total bank deposits, attracted rates in the range of 15% to 20%. Smaller financial institutions that were hard hit by the liquidity crunch were offering higher returns on time deposits. In 2011, Zambian Authorities managed to contain annual inflation within single digit levels, ending the year at 7.2%. Average inflation for the year stood at 8.7%, marginally higher than 8.5% in 2010. Food inflation was relatively low, benefiting from a record high maize harvest for the past two seasons. Non-food price inflation surged during the first quarter of the year largely driven by firm international oil prices. Zimbabwe, having suffered from the debilitating effects of hyperinflation, enjoyed the benefits of operating under the multicurrency system. It recorded relatively low levels of inflation. Average annual inflation for 2011 was 3.5% compared to 3.1% in 2010. The economy also benefited from a significantly weaker Rand in the second half of 2011 as this dampened imported inflation. Interest Rates Developments Despite a relatively high inflationary environment in 2011, a number of countries did not tighten their monetary policies. Interest rates have not materially changed from the low levels that prevailed during the 2008/09 global financial crisis. In 2010, Botswana’s Bank Rate remained unchanged at 10% until mid-December 2010 when it was lowered by 50 basis points to 9.5%. Since then, the bank rate remained flat at 9.5% throughout 2011, mimicking South Africa’s prime rate which was fixed at 9%. However, the real bank rate was low in 2011, at an average of 1% compared to a long-term average of 3.7%, suggesting some degree of monetary accommodation. The Bank of Mozambique (BoM) was more concerned with economic growth as well as the risks posed by the global financial markets to Mozambique. This contributed to the MPC’s decision to cut the Standing Lending Facility (SLF) rate by 50bps in August 2011 to 16%, while also loosening themonetaryconditionsbyreducingthereserverequirement ratio by 25bps from 9% to 8.75%. In November, BoM further reduced the SLF by 100bps to 15%, taking advantage of decelerating inflation. Elsewhere in Tanzania, the overnight and T-bill rates, which were 8.0% and 6.4% respectively at the beginning of the year, gradually softened during the year before firming up towards the end of the year as liquidity conditions tightened. The tight liquidity conditions may have led to a failure of a 7
  • 12.
    Chairman’s report continued ExchangeRate Developments Generally, for many economies in the region that operate flexible exchange rate regime, adverse terms of trade often translate to depreciation of their currencies. Likewise, the World Bank noted that during the downturn of 2009, a third of local currencies in the region depreciated by over 10%. The Rand weakened considerably during the second half of the year, largely as a result of investor concerns about the pace of global recovery. South Africa, together with Nigeria and Kenya, have the most liquid financial markets and are therefore prone to global shocks. Concomitantly, heightened uncertainty in the global financial markets in the wake of Euro zone crisis adversely impacted on short- term portfolio equity and investment in bonds, thereby affecting the Rand. To the extent that the Rand has a dominant weight in the Pula basket of currencies, the Rand weaknesses appear to be transmitted to the Pula. As of end of 2011, the Pula was trading at BWP7.52/US$ compared to BWP6.44/US$ in December 2010, reflecting that the Pula depreciated against the US$ by 16.9%. Similarly, on a year on year basis, the Pula depreciated against the EUR (13.1%), GBP (16.5%) and Yen (22.6%) but appreciated against the ZAR (5.5%). In addition to targeting the stock of base money, and hence money supply, the central bank of Mozambique has been using the exchange rate as a tool to fight inflation. The Metical thus appreciated considerably by 18% against the US$, from MZN32.89/US$ in December 2010 to MZN27.13/US$ in December 2011. The Metical was generally stable against the Rand during the first half of 2011 before strengthening considerably from MZN4.20/ZAR in June to MZN3.32/ZAR in December. Against this back­ ground, the relatively stronger Metical helped to dampen imported inflation from SA. During the first ten months of the year, the Tanzanian Shilling was under consistent pressure against the US dollar. The weighted average exchange rate, which stood at TZS1,470/ US$ in December 2010, progressively depreciated by nearly 15% to TZS1,688/US$ in October before reversing the trend during the remainder of the year. The Shilling also recovered well against the Rand during the second half of the year to reverse its earlier losses. The Zambian Kwacha was broadly stable during the first half of the year, trading at an average of ZMK4,761/US$. During the second half of the year, the Kwacha came under pressure on the back of concerns regarding the political landscape as well as deteriorating external factors. As a result, the Kwacha was relatively weak, trading at an average of ZMK4,962/US$. The Kwacha, however, appreciated by 12.7% against the ZAR, from ZMK723/ZAR in December 2010 to ZMK632/ZAR in December 2011. ABC Holdings Limited ANNUAL REPORT 20118
  • 13.
    Financial Sector Developments Althoughthe banking sector in most African countries was not directly exposed to the toxic banking assets and financial turmoil in the developed world, the spillover effects were seen through reduced lending activity, deterioration in the quality of loans resulting in precipitous increase in the level of non-performing loans (NPLs), drying up of lines of credits as well as a decline in the level of deposits. Nevertheless, the banking sector in many African countries appears to have weathered the negative effects of the global financial turmoil. In an attempt to prevent any slip-ups, most Central Banks stepped up enforcements to ensure compliance with regulations while, in some cases, they raised the minimum capital requirements. The banking sector in Botswana is regulated and supervised by the Bank of Botswana. The sector can broadly be divided into two main segments: the banking sector and the non- banking financial sector. The banking sector is mainly comprised of commercial banks while the non-banking financial sector is mainly comprised of insurers, pension funds, asset managers, microfinance institutions and other credit institutions. The negative impact of the global financial crisis was felt through a decline in both Pula and foreign currency denominated deposits while the level of non- performing loans edged up slightly in 2010. However, banking sector deposits continue to increase, having fully recovered from the indirect effects of financial crisis. Total deposits that stood at BWP37,572 million (US$5,632 million) in December 2009 marginally improved to BWP41,619 million (US$6,463 million) in December 2010 and stood at BWP44,221 million (US$6,120 million in September 2011. The share of foreign currency denomi­ nated deposits (FCAs) has however not recovered from the levels that prevailed prior to the global recession. As of September 2011, the share of short-dated deposits accounted for 62% of total deposits (i.e. call, 38%; current, 17%; and savings, 7%). The savings accounts are considered short-term since they are mostly used as transactional accounts. The balance of 38% of total deposits is considered time deposits, consisting of 88-day (14%), 6 months (20%) and over 12 months (4%) deposits. As of September 2011, total bank loans to the private sector amounted to BWP26,053 million (US$3,606 million), having increased by BWP4,348 million (US$311 million) from BWP21,706 million (US$3,295 million) in September 2010. Mozambique’s domestic banking system is dominated by high foreign ownership and most banks are adequately capitalised. The number of banks operating in the market has increased from 14 in 2008 to 16 from December 2010. The Mozambican banking system remains highly con­ centrated with the three largest banks, which are all foreign owned, accounting for 80% of the system’s assets. 9
  • 14.
    Chairman’s report continued Authoritieshave also lowered reserve requirements for banks to 8.5% in an attempt to allow more room for credit creation by banks in light of the unfolding current international crisis and uncertainty. Total bank deposits improved from MZN114 billion (US$3,468 million) in December 2010 to MZN120 billion (US$4,478 million) in November 2011 largely reflecting full scale banking sector recovery and increasing confidence. In 2011, due to a con­ tinuously strengthening Metical, businesses appear to be relinquishing their FCAs deposits in preference to the Metical denominated deposits. Consequently, the ratio of FCAs to total deposits declined from 43% in September 2010 to 40% in March 2011 and further to 31% in November 2011. Out­standing private sector credit stood at MZN96 billion (US$3,576 million) in November 2011 compared to MZN93 billion (US$2,626 million) in November 2010. This represents an annual increase of MZN3 billion or a growth rate of 3.4%. However, the concentration of loans on single borrowers and tight liquidity conditions remain major concerns for the banking sector. In Tanzania, the banking sector experienced a significant increase in NPLs largely due to the lagged impact of the global financial crisis in some sectors as well as high delinquency in household loans. However, the level of NPLs has started to decline. The NPLs were 8% of total loans at the end of September 2011, down from nearly 10% at the beginning of the year, reflecting efforts to strengthen loan collection, follow-up and tightened under- writing standards. Total bank deposits increased by US$933 million from US$5,816 million in October 2010 to US$6,750 million in October 2011. As of October 2011, foreign currency deposits accounted for about 37% of total deposits. Annual growth in private sector credit also improved to 31% in October 2011 compared to 20.3% during the same month in 2010. In nominal terms credit to the private sector grew by US$731 million from US$3,884 million in October 2010 to US$4,615 million in October 2011. ABC Holdings Limited ANNUAL REPORT 201110
  • 15.
    The Zambian bankingsector experienced a decline in deposit levels in the last quarter of the year. In January 2011, total bank deposits at US$3,607 million steadily increased to their highest level of US$3,966 million in October before retreating to US$3,786 million – possibly due to the impact of the depreciating Kwacha during this period. Private sector creditincreasedby29%fromK8,298 billion(US$1,683 million) in November 2010 to K10,702 billion (US$2,100 million) in November 2011. Household loans account for about 34% of total loan portfolio. InJanuary2012,theZambianMinisterofFinanceannounced a radical change in the minimum capital requirements for banks. By 31 December 2012, foreign owned banks are required to have minimum tier I capital of US$100 million and locally owned banks are required to have US$20 million as minimum tier I capital. There are some interim mile-stones that banks should meet in as far as minimum capital is concerned before the final deadline of 31 December 2012. Until recently, Zimbabwe’s banking sector recovery had been relatively smooth, with Government projecting strong growth rate of 24% and 23% in 2011 and 2012, respectively. During the second half of 2011, the banking sector was trapped in a liquidity squeeze that potentially threatened to cause irreparable damage to some banks. The liquidity challenges intensified during the festive season on the backdrop of: • overly high import bill compared to exports receipts – partly triggered by a surge in second hand car imports following a threat to ban used cars that are older than five years; • government expenditure overruns since August 2011 that saw the fiscal surplus being depleted from US$220 million to US$30 million by year end; and • high value cash withdrawals during the festive season This notwithstanding, Zimbabwe’s banking sector deposits have grown in leaps and bounds on the back of increasing confidence. Against this background, deposits held by banks grew by over US$900 million from US$2,328 million in December 2010 to US$3,300 million in December 2011. Deceleration in the deposit growth during the second half of 2011 was largely attributable to persistent liquidity challenges during this period. Total credit advanced by banks continued on an upward trend, increasing by 163% from US$636 million in December 2009 to US$1 677 million in December 2010 and by 69% to US$2,838 million in December 2011. However, most banks deliberately reduced lending on the back of tight liquidity conditions that prevailed during the second half of 2011. 11
  • 16.
    Chairman’s report continued Outlook Theglobal economy is going through a difficult patch due to the adverse impact of the worsening Euro-debt problems. According to the World Bank and the IMF, capital inflows to the developing countries declined by almost halfcompared to 2010, while growth in several major developing countries (Brazil, India, and to a lesser extent, Russia, South Africa and Turkey) has slowed down partly in reaction to domestic policy tightening. Elsewhere, the Euro area could enter into a mild recession in 2012 as a result of the rise in sovereign yields, the effects of bank deleveraging on the real economy and the effect of fiscal consolidation. Despite the existence of multiple shocks such as heightened uncertainty and slowdown in the global economy, volatile and high fuel and food prices, SSA continued its post-crisis recovery trajectory. According to the World Bank, over a third of countries in the region attained GDP growth rate of at least 6%. Strong economic growth has been supported by both domestic and external demand – supported by higher commodity prices. There are, however, growing fears that if the Euro-debt crisis evolves into a major crisis, the global downturn may be longer than it was in 2008/09. This is due to the fact that high-income countries do not have the fiscal or monetary space to bail out banking systems or stimulate demand. The risks of a global downturn could severely harm SSA’s growth prospects. As in the 2008/09 global crisis, a reduction in global demand for the region’s exports could lead to sharp declines in commodity prices and hence export and government revenues. Economic growth in the ABC markets is expected to remain on a positive trajectory, although the downside risks of a possible global downturn could be damaging. In Zimbabwe, investors and businesses alike remain wary of a possible election later on during the year. As a result, the country will continue to find it difficult to shake off its high political risk tag that has made it difficult for banks to access the much needed external lines of credit. Staff share purchase allocation During the year, 3.1 million new shares together with 2.3 million treasury shares, were issued to staff at a discount of 15% on the share price as at 14th March 2011. This brings the total number of issued shares to 149,472,131 out of an authorised number of shares of 150 million. Governance The Board was further strengthened by the appointment of Mr Mark M Schneiders, the Chief Development Officer of African Development Corporation in December 2011. I would like to welcome Mr Schneiders to the Board. Mr Schneiders brings a wealth of international banking Regional Economic Outlook World Bank Outlook IMF Outlook 2011 2012 2013 2011 2012 2013 World Economy 2.7 2.5 3.1 3.8 3.3 3.9 Euro Area 1.6 (0.3) 1.1 1.6 (0.5) 0.8 Developing Asia n/a n/a n/a 7.9 7.3 7.8 Sub-Saharan Africa 4.9 5.3 5.6 4.9 5.5 5.3 experience accumulated over many years in the financial services sector. Rights issue The balance sheet of the Group has significantly increased over the last couple of years. As a result, it would not be possible to grow any further without additional capital being sourced. BancABC Botswana, BancABC Tanzania and BancABC Zimbabwe are now at a stage where their capital adequacy levels are very close to regulatory minimums. ABC Holdings Limited ANNUAL REPORT 201112
  • 17.
    At the sametime BancABC Mozambique is no longer able to fully support its very good clients as they have grown faster than the bank. In 2008 the bank took a strategic decision to expand its product offering to include Retail Banking. This growth has been funded entirely from internally generated funds. This line of business is now showing lots of potential and indications are that it should make profits in 2012. However, it is very capital, systems and people intensive. In view thereof, the Board has recommended that US$50 million be raised immediately by way of a rights issue inordertoensurethattheGroupdoesnotlosethemomentum that has been created. African Development Corporation, a 23.2% shareholder in the Group, has agreed to underwrite the entire issue. Further details are contained in the circular to shareholders that will be released shortly after the publication of this report. As alluded to earlier in this report, the Bank of Zambia has increased the minimum level of capital from some US$2 million to US$100 million. The Board is currently evaluating all the options to address this new requirement. Shareholders will be advised of any new developments in this regard as necessary. DiviDenD In line with the Group dividend policy, a final dividend of 10.5 Thebe in respect of the year ended 31 December 2011 is being proposed by the Board. This will bring the full year dividend to 17.5 thebe per share. The final dividend will be paid on 4 May 2012 to shareholders on the register at the close of business on 13 April 2012. ACknowleDGeMents I would like to thank my fellow directors, management and staff for the strong results posted by the Group. This positions the Group well for growth in future. HJ Buttery Group Chairman HJ Buttery 13
  • 18.
    The rest ofthe operations delivered pleasing performance punctuatedbyincreasedrevenueanddisparatebutincreased activity in the retail business, which continued to improve from strength to strength. Staff numbers have swelled from 668 in December 2010 to 1,008 in December 2011 even though a significant number are on short-term contracts. Total assets grew from BWP6 billion in December 2010 to BWP9 billion by December 2011, total deposits from BWP5 billion to BWP7 billion and total loans from BWP3 billion to BWP6 billion. This growth is a reflection of many years of dedication and systematic execution by the Group and its subsidiaries. Operations are getting close to critical mass and I am pleased by the subsidiaries’ performance in 2011. We ended 2011 with Botswana, Mozambique, Zambia and Zimbabwe producing increased year-on-year profits averaging about US$5 million each. This is a giant leap from the results these subsidiaries have been posting in the past. The expansion the Group is undertaking has necessitated the need to raise more capital by way of a rights issue. Market Analysis Some very positive developments have taken place within the Southern African Development Community (SADC) regionintheenergysector.Texas-basedAnadarkoPetroleum Corporation (Anadarko) recently announced a large natural gas find off the northern Mozambican coast in the Rovuma Basin increasing its estimated recoverable resources from 15 to 30 trillion cubic feet of gas. Anadarko has awarded a contract to a US based company KBR, Inc. to design a liquefied natural gas (LNG) plant for Mozambique. Anadarko co-owners are Mitsui of Japan (20 per cent), BPRL Ventures and Videocon (both of India, with 10 per cent each) and Cove Energy of Britain (8.5 per cent). The Mozambican government is represented by Empresa Nacional de Hidro- carbonetos which holds a 15 per cent interest in the fields. Inaddition,ENIandAnadarkohavemadeasizeablepetroleum discovery off Mozambique’s coast. During 2011, the Group performed satisfactorily ending the year stronger than the 2010 financial year. This progressively brighter picture was spoiled by high NPLs and market risk in Tanzania. grOUP ceO’s rePOrt ABC Holdings Limited ANNUAL REPORT 201114
  • 19.
    year. The profitabilityachieved is particularly pleasing when viewed against the background of the Group’s ongoing massive investment in the Retail Banking business, which continued despite the mixed economic conditions that were a dominant characteristic of the banking sector during the reporting period. The Group balance sheet increased by 53% from BWP6 billion to BWP9.2 billion. Loans and advances were up almost two fold from BWP3.1 billion to BWP6.1 billion. This was largely funded by deposits that increased by 50% from BWP4.9 billion to BWP7.4 billion. All major lines of business recorded significant growth during the year. The Group now has 49 Retail branches including consumer lending branches, up significantly from 31 branches in 2010. Rapid expansion of retail banking operations continued, with BWP177 million being spent on essential hardware and software during the last 24 months. As was to be expected, staff numbers continued to grow. By the end of the reporting year staff numbers, including temporary and contract workers, stood at 1,008, compared to 668 at the end of December 2010. Whilst the Retail Banking business is still recording losses, excluding Zimbabwe, where it is already profitable, we are happy with the progress made to date in Botswana and Zambia. OVERVIEW On the other hand, Tanzania is predicted to become an important gas producer by the end of the decade. Significant natural gas discoveries have also been made off the coast of Tanzania. The country is expected to receive FDI in excess of US$7 billion from Ophir Energy and its partner British Gas. Combined with Angola, these finds in Mozambique and Tanzania will introduce a new dimension in the oil and gas sector and put the SADC on the global energy map. The upstream and downstream effects will feed into our businesses in these key markets and position us for accelerated growth in the coming years. The Botswana Democratic Party celebrates its 50th year anniversary in 2012. This democratic milestone is coming soon after the ANC of South Africa celebrated 100 years in 2012. This is a positive development in the interests of democracy. In Zambia, the election of President Michael Sata introduced a new dimension to politics in that country. The transition was peaceful. The recent victory of the Zambian national team at the continental soccer tournament AFCON was a great unifying event that lifted the spirits of all Zambians and extends to the whole SADC region. The Zimbabwean political landscape is still governed by the Government of National Unity between ZANU-PF and the two MDCpoliticalparties.Theenactmentofthenewconstitution, whose review is currently in process, should pave way for elections. However, the timing for the enactment of the new constitution and the eventual elections is currently unknown. FINANCIAL REVIEW The Group posted a strong set of results for the period with all the banking subsidiaries, with the exception of Tanzania, reportingexcellentresults.AttributableprofitatBWP83million, is 24% higher than the BWP67 million achieved in the previous 15
  • 20.
    Net interest income Netinterest income of BWP412 million was 38% ahead of the BWP298 million achieved in 2010. All entities recorded an increase in net interest income on the back of significant growth in balance sheet sizes. Net interest margin declined slightly from 6.6% to 6.3%. However, this is expected to increase in the coming periods as the Retail Banking loan book grows. As at 31 December 2011, the Retail Banking loan book constituted 20% of the total loan book compared to 8% in 2010. Impairment losses on loans and advances Net impairments of BWP80 million were about five times up on the BWP16 million prior year net charge. The increase was partly due to portfolio impairments that increased in line with the growth in the loan book, doubling from BWP3.1 billion to BWP6.1 billion. The credit loss ratio deteriorated from 0.6% in 2010 to 1.7% at the end of 2011. It should be noted, however, that the quality of the book continues to improve with gross non-performing loans down from 8.3% to 6.7%. Net non-performing loans also reduced markedly and are now down to 3.3% from 4.2% in the previous year. The largest contributor to the impairment charges were BancABC Tanzania and BancABC Zimbabwe, which had net impairments of BWP33 million and BWP32 million respectively. Fifty percent (50%) of the impairment in Tanzania is in respect of a loan which was guaranteed by the Government of Tanzania (GoT). Unfortunately, a lower balance was signed off owing to the protracted time it took to conclude this issue. Consequently, a decision was taken to write-off interest that accrued to December 2012. In addition, a lower negotiated interest rate was applied when the GoT took over the loan and therefore gave rise to a loss on derecognition of the old loan and recognition of the new loan to the GoT. The increase in BancABC Zimbabwe impairments was due to a combination of portfolio impairments and down-grading of a few loans granted to a number of small and medium sized companies. The liquidity situation in Zimbabwe had an adverse impact on the cash flows of the bank’s small to medium-sized customers, which has affected their ability to service their loans as they fall due. Non-interest income Non-interest income of BWP326 million was ahead of the prior year by 23%. This income is net of BWP27 million relating to the fair value loss on the IFC loan conversion option. This loss is largely as a result of the significant increase in the Company’s share price but does not have any impact on the cashflows of the business. This amount will be transferred to equity on conversion or reversed to income if IFC does not convert the loan to equity by 13 May 2013. Excluding this amount, non-interest income increased by 34%. BancABC Zimbabwe performed strongly when compared to prior year as fees, commissions and trading income improved. Following the introduction of Retail Banking and the increased market penetration achieved through additional outlets created during the year, all subsidiaries with the exception of BancABC Tanzania saw an increase in business volumes, reflected in higher transaction and trading income. Money market interest rates moved up significantly, between September 2011 and year-end, in Tanzania. For example, the inter-bank rates moved from around 4% at the beginning of 2011 and peaked at 33% by year-end. As a result, the Group had to book huge mark-to-market losses on its trading book. Owing to the above, BancABC Tanzania’s non-interest income was lower than the previous year. Operating expenditure Operating expenses at BWP546 million were 25% ahead of the BWP435 million recorded in 2010. Expansion of the Retail Banking products and the increasing retail branch footprint resulted in higher costs across the network. These costs are expected to increase further in 2012, but stabilise thereafter as the business achieves critical mass. Notwith­ standing the above, the cost to income ratio reduced from 77% to 74%. The cost to income ratio is expected to continue on a downward trend as revenue is expected to increase more rapidly than costs. The cost to income ratio should CEO’s report continued ABC Holdings Limited ANNUAL REPORT 201116
  • 21.
    This was largelydue to an increase in business volumes in both Retail and Wholesale banking divisions. We expect Botswana to record phenomenal growth in 2012. BancABC Mozambique experienced a surge in net interest income resulting from better margins compared to prior year. This drove the 26% increase in attributable profits. BancABC Zambia had a phenomenal 184% increase in attributable profit due to the growth in the consumer lending book, coupled with the BWP10 million deferred tax asset recognisedduringtheyear.BancABCZimbabwe’sattributable profit of BWP55 million was 106% up on the BWP27 million recorded in 2010. The deteriorating liquidity situation in Zimbabwe affected this growth in the second half of the year. The loss in head office entities, together with con­solidation adjustments, increased by 92% from BWP30 million in the previous year to BWP58 million in the current year. This was largely due to a fair value loss and additional interest expense on the IFC convertible loan of BWP35 million. Operational performance Botswana BancABC Botswana grew its market share significantly during the year under review. This was through the in-roads made in the Retail segment in that market. The bank intro­ duced new innovative lending products which enabled it to acquire a number of Retail customers within a relatively short period. The bank was the pioneer in offering the prepaid “chip and pin” cards and demand for this service is growing exponentially. BancABC Botswana’s attributable profit of BWP28 million was 40% ahead of the prior year. Total income improved by 37% from BWP85 million to BWP116 million on the decline and move closer to the Group’s medium-term target of 50% within the next 24 months. Taxation The Group had a net tax charge of BWP20 million compared to a tax charge of BWP22 million in the previous year. The effective tax rate is 19% compared to 25% in the previous year, when the Group incurred higher losses in its share of associate results where no tax benefit could be derived. Current year effective tax rate is also lower, due to BancABC Zambia recognising a deferred tax asset that had previously not been recognised. BancABC Zambia is now highly profitable and the tax losses will all be utilised. Balance sheet The balance sheet increased by 53% from BWP6.0 billion (US$0.9 billion) in 2010 to BWP9.2 billion (US$1.2 billion) as at 31 December 2011, a major milestone, with the thres­ hold of US$1 billion being crossed for the first time in the Group’s history. Loans and advances increased to BWP6.1 billion from BWP3.1 billion in December 2010. BancABC Zimbabwe loanbookofBWP2billionconstitutesthelargestcontribution of 33%. Deposits increased to BWP7.4 billion from BWP4.9 billion in December 2010. The full impact of the massive growth in the balance sheet will be felt in subsequent reporting periods through increased income. Attributable profit Banking subsidiaries achieved attributable profits of BWP141 million, compared to the BWP97 million registered in the previous year. All subsidiaries produced substantial double-digit growth in attributable profit with the exception of BancABC Tanzania, which recorded a loss for the year. BancABC Botswana’s net profit after tax of BWP28 million was 40% higher than BWP20 million recorded in 2010. 17
  • 22.
    Going forward, BancABCMozambique will build on the success achieved in raising retail deposits to grow consumer finance loans. The operation is also pursuing opportunities available through payroll deduction schemes. Tanzania BancABC Tanzania had a twin-setback in the form of impair­ ments and interest rate risk, both of which increased during the fourth quarter. The rapid increase in market interest rates resulted in higher mark-to-market losses for the trading book in a market where the secondary market is under- developed. Inter-bank interest rates moved from 4% to peak at 33% in December 2011. All the other rates moved in tandem with the increase in inter-bank rates. Rates on the operation’s 5 and 10 year Government bond portfolio moved from 11% and 13% to 13% and 15% respectively. Owing to these factors, the bank suffered a mark-to-market loss of BWP13 million. In addition, the GoT decided to take over one of the BancABC Tanzania loans that it had guaranteed. Unfortunately, there was a discrepancy between what GoT approved and the carrying amount in BancABC Tanzania’s books, due to the GoT taking over six months to make a decision. As a result, the bank suffered a loss of BWP17 million through the reduction in interest rate and the impairment of the loan. Total impairments for the operation at BWP33 million were82%higherthanBWP18 millionrecordedintheprevious year. The high impairments coupled with mark-to-market losses resulted in the operation recording an attributable loss of BWP3 million for the year. TotalincomeatBWP56millionwaslowerthanBWP68 million achieved in 2010. On the other hand, operating expenses increased by 30% to BWP62 million due to the expansion in Retail Banking activities. We expect the difficult trading environment to continue into the first quarter of 2012 and gradually improve as the year progresses. Zambia BancABCZambiawassuccessfulinexpandingtheconsumer lending business during the year. At BWP32 million, BancABC Zambia’s attributable profit was three-times that achieved in the previous year. back of an increase in both volumes and margins. Net interest income improved by 54% to BWP79 million mainly due to improved margins and a substantial increase in the balance sheet size. The loan portfolio increased by 109% from BWP795 million to BWP1.6 billion. As a result, portfolio impairments increased during the year. Non-performing loans continue to decline and reduced to 2.2% from 9% in the previous year. Non-interest income increased by 36% to BWP45 million, due to increased transaction volumes. Operating expenses increased by 41% due to an increase in activity as the entity made inroads into the Retail Banking market. BancABC successfully signed a number of agree- ments with Government unions for consumer lending business. This lucrative business is highly competitive in Botswana, with a number of institutions operating in this space. Cost to income ratio improved marginally from 70% to 67% in 2011. The bank is well positioned for significant growth going forward. The income stream is now well diversified with Retail Banking projected to contribute significantly to income in the coming year. Mozambique BancABC Mozambique achieved strong growth in the Whole­sale business as well as in growing Retail deposits. Attributable profit of BWP29 million was 26% ahead of the previous year. This was driven by the high growth in net interest income, which increased by 109% to BWP61 million following improvements in margins, as well as growth in the interest earning assets. Loans and advances increased by 80% to BWP762 million and deposits increased by 45% to BWP1.2 billion. Interest margins steadily improved during the year as the interest rate shocks experienced in the previous year dissipated. Non-interest income increased by 12% to BWP65 million despite the decline in foreign exchange trading margins following increased intervention from the central bank during the year. The fall in margins was offset by an increase in trading volumes. NetimpairmentsincreasedfromBWP2milliontoBWP5 million largely due to growth in the loan book. Operating expenses increased by 43% to BWP81 million from increased activity levels in line with the current drive to make inroads into the retail space. CEO’s report continued ABC Holdings Limited ANNUAL REPORT 201118
  • 23.
    of Retail customershas enabled the bank to build critical mass and compete at the same level as the more established commercial banks. BancABC Zimbabwe’s attributable profit of BWP55 million was 106% higher than that recorded in the prior year. The increase in attributable profit was due to the strong business growth during the year, which gave rise to higher net interest and non-interest income which increased by 137% and 51% to BWP136 million and BWP129 million respectively. Loans and advances increased by 132% to BWP2 billion and deposits increased by 88% to BWP2 billion. Growth in loans and advances had an adverse impact on impair- ments, which increased from BWP2 million in 2010 to BWP32 million in the period under review. While gross  non-performing loans remained low at 5.87%, the impair­ ments emanated from an increased loan book and a deteriora­ tion of the quality of loans in the SME sector. Operating expenses increased by 39% to BWP149 million due to the increase in the number of branches as a result of the Retail Banking roll out. The liquidity situation in Zimbabwe deteriorated in the second half of the year. This is expected to continue in the foreseeable future as there is no interbank market and lender of last resort. This situation is further exacerbated by the fact that imports currently significantly exceed exports in a currency that the central bank does not print. The bank has therefore deliberately undertaken to improve liquidity at the expense of profitability. As a result, while the business is projected to register significant growth, profitability will not grow by the same magnitude. Business Segments Treasury The division had an excellent year with wholesale deposits increasing by 42% from BWP4.75 billion to BWP6.76 billion. At US$985 million, the total deposits were just shy of a major milestone of US$1 billion. Indications are that this should be attained earlier in the first quarter of 2012. All subsidiaries had substantial growth in customer deposits which helped fund the growth in the balance sheet which increased by 53%. Growth in profits emanated from the significant increase registered in the consumer banking segment where business underwritten in­ creased substantially leading to an increase in revenues. In addition, BWP10 million was recognised as a deferred tax asset as the business is now on a solid footing. This tax asset will be fully utilised within the next 18 months. Loans and advances in the consumer lending division increased by 242% from BWP92 million to BWP314 million. Whilst the bank gained some traction in its wholesale banking activities during the fourth quarter, the results from this segment are still regarded as unsatisfactory. Both wholesale loans and deposits are still way below the optimal levels required to ensure sustainable revenues. The Wholesale Banking Division saw loans and advances grow by 87% to BWP263 million, while deposits increased by 116%, as market confidence in the bank continued to improve. Total income increased by 10% from BWP92 million to BWP101 million on the back of a 63% increase in non- interest income as fees from consumer lending increased significantly during the year. Operating expenses remained largely unchanged despite the increase in business activity. This was largely due to realisation of the full benefits of the merger of the two businesses (the bank and the microfinance entity) that was embarked on in 2009/2010. The subsidiary is on a strong footing for growth in 2012 and beyond. Transaction volumes in the wholesale division are showing signs of improvement, but the majority of the growth in business volumes in the near future will be from the consumer lending division. The bank has embarked on an aggressive cross-selling exercise, as most of the consumer lending customers are currently using a single product and there are major opportunities to mine the relationships and increase product offerings and utilisation by a growing customer base. Zimbabwe BancABC Zimbabwe continued the growth pattern experienced in the recent past and has become one of the leading banks in that market. The continued acquisition 19
  • 24.
    and advances islargely on the back of consumer loans from our corporate clients and government employees. The rollout of additional products helped increase the division’s total income, with total revenue up five-fold from BWP27 million in prior year to BWP160 million in the current year. Operating expenses were BWP174 million (2010: BWP105 million) and it is evident that though the division is still loss-making, it is closer to breaking even and it is expected to be profitable during 2012. A number of products were initiated during the year prime among which were VISA prepaid, VISA debit and VISA credit cards. Internet banking is currently being tested and is expected to be rolled out throughout the entire platform by end of the first half of 2012. Human Capital The Group’s staff compliment continued to increase with the number of staff increasing from 668 in 2010 to 1,008 in 2011. During the year, the division continued with its Leadership Development Programme in partnership with University of Pretoria’s Gordon Institute of Business Science (GIBS). This was a three-year programme whose objective was to raise the leadership capacity of the Group’s managers at all levels. The programme was a success and it came to an end in 2011. Related to the GIBS programme is the Executive Coaching programme with Landelhani. This is an on-going programme which was put in place for the bank’s senior managers with a view to broadening their leadership capability. The programme will continue in 2012. The Group also runs an on-going Mentorship Programme for its managers to complement the abovementioned pro­grammes. Overall the output of all these initiatives has been enthusiastic support from the participants and enhanced leadership skills across the whole Group. This will remain a major thrust of human investment in the Group for the future. Money market and foreign exchange trading income also increased with the latter growing by 9% from BWP106 million to BWP116 million and the former by 8% to BWP48 million. Trading activities remained high during the year leading to growth in income. However, during the fourth quarter, Tanzania suffered higher volatility in money market interest rates which resulted in mark-to-market losses that wiped out trading gains the entity had achieved earlier during the year. Zimbabwe experienced serious liquidity challenges in the fourth quarter. This situation is expected to improve in the first quarter of 2012 with the opening of tobacco auction floors and increased activity by the diamond traders. Liquidity management has become a major focus area for the Group. On the trading front, treasury will focus on customer flows rather than proprietary trading. Corporate banking and structured finance The division’s loan book grew by 63% from BWP3 billion to BWP4.9 billion on the back of increased market penetration across the footprint. This had a positive impact on interest income from loans and advances which increased by 48% to BWP666 million and on arrangement fees which increased by 29% to BWP79 million. Despite higher impairments on a large corporate client in Tanzania, the quality of the loan book continued to improve with gross non-performing loans (NPLs) declining to 7.4% from 8.6% and net NPLs to 3.6% from 4.6% in the previous year. The largest contributor to the division’s loan assets was Zimbabwe, which contributed 33% followed closely by Botswana at 27%. Given the tight liquidity conditions in Zambia and Zimbabwe, the division is increasingly focusing on non-funded trans­ actions and has made significant progress particularly in Zambia where this business now accounts for 50% of the corporate banking business. Retail and SME banking The retail banking division achieved phenomenal growth during the year, albeit from a low base. It continued rolling out products across the Group’s footprint and these have been well received. The number of branches and consumer lending outlets increased from 31 to 49 as at 31 December 2011. Customer deposits almost quadrupled from BWP153 million in 2010 to BWP610 million in 2011. Loans and advances increased eleven-fold from BWP109 million in 2010 to BWP1.2 billion in the current year. The increase in loans CEO’s report continued ABC Holdings Limited ANNUAL REPORT 201120
  • 25.
    expansion,mostlyontheRetailbankingfront.Thedepartment was bolstered withadditional staff who have brought much needed skills internally to service internal and external customers more efficiently and effectively. The core banking software for the Group was successfully upgraded during the year and this puts the Group in a better position to be able to seamlessly interface the core system with other support systems that are utilised within the Group. Over the last couple of years, we have had challenges in IT due to the fact that we have been building multiple plat­forms within the division. Consequently the major area of focus in the first half of 2012 would be to stabilise the core banking system and improve connectivity by ensuring that wherever possible we use fibre optic networks as opposed to the current scenario where VSAT is still dominant. The Group’s Banking Operations department supports various revenue-generating departments. The department continuously looks for new and better ways of servicing the customer and at the same time reduce the error rate to negligible figures. The department also ensures that all processes are relevant, documented and up-to-date. During the year, reviews of various processes were done with a view to improving transaction handling capability and where possible to automate these processes. Straight- through processing will also be implemented in the back office area to ensure that the error rate is reduced and also improve on our speed of processing transactions. The Group continued its ever popular Graduate Management Development Programme with the recruitment of 28 new graduates for 2012. These are specially selected graduates who are taken through an accelerated programme on various facets of banking to enable them to join at a relatively senior levelwithintheGroupassoonastheycompletethe18months programme. The Balanced Scorecard (BSC) is the Group’s chosen strategic management and performance monitoring tool. In 2011 the Group was able to cascade it down to the individual level. All employees regardless of rank now have their individual BSC scorecard and are now monitored and rewardedbasedontheattainmentoftheirKeyPerformance Indicators (KPIs). This has helped bring focus in the business and ensures that employees concentrate on activities that will bring the most value to the Group. Going forward, the human capital division will continue to entrench strategic human capital management practices, improve overall employee productivity, drive people costs down and drive a robust talent management system that includes succession planning. The overall objective is to attract, develop and retain highly skilled employees within the Group. Other supporting divisions The Group operates a centralised Information Technology (IT) function which is the key enabler to the business. The focus of IT during the year was to support business 21
  • 26.
    ceO’s report continued Outlook Theworld economic environment will remain challenging as we do not believe we have seen the last of the Euro zone debt crisis. Liquidity will in all likelihood continue to be a challenge and hence it is critical that liquidity management remains a key area of focus in 2012. Notwithstanding the above, we believe Africa is the next big economic frontier and there are huge opportunities in the markets in which we operate. Business growth in both retail and wholesale banking has been phenomenal and this lays a strong founda- tion for the future. Retail banking is expected to start contributing a greater portion of revenue and profitability going forward. We are reasonably optimistic that the Group is well positioned to deliver strong results in 2012 and beyond. Acknowledgements I would like to extend my sincere appreciation to the Board for its guidance and support, and management together with all BancABC staff for their support and commitment to The Big Push effort to achieve our BHAG by 2015. The 2011 instalment is a big investment in our quest to achieve our goal of being the preferred banking partner in Africa. After a few years of investing in the Retail expansion, staff are beginning to reap the rewards of their efforts and determination in ensuring that our strategy will be achieved. Douglas T Munatsi Group Chief Executive Officer Group Finance is responsible for financial management and reporting, regulatory reporting, budgeting and Group tax. A new management information system is in the process of being deployed, which will help in both the quality and timeous reporting of all key information. Group Risk manages all risks that the Group is exposed to from all its activities. The department has various committees that identify and manage various types of risks. The key committees are the Asset and Liability Management Committee and the Operational Risk Committee. The Legal and Compliance department is also charged with the day- to-day management of legal and compliance risks. To this end, the department developed standardised documents for wholesale and retail banking. It strengthened structures in the subsidiaries and established a centralised filing system for all legal documentation. In addition, the Legal and Compliance department advised management and the Board of Directors on various matters including corporate policiesinlinewiththenewcorporategovernancerecommen- dations made in the King III Report on corporate governance. The Group Legal Counsel, who heads this department, also provides legal services to the Group as required or in conjunction with external attorneys. Group Credit monitors the loan portfolio of the Group and ensures that the Group is not exposed to undue risk from new business that is underwritten. In addition, it also monitors existing customers who may be facing financial challenges that impact on their ability to meet their commitments. Group Internal Audit plays a key role in maintaining and improving the internal control environment within the Group. The Group Head of Internal Audit reports directly to the Risk and Audit Committee. ABC Holdings Limited ANNUAL REPORT 201122
  • 27.
    The key componentsof the ESRP are: • an assessment of potential and current environmental and social risks and impact arising out of the proposal; and • the commitment and capacity of the borrower to manage this impact. Against this background, the procedure ensures that projects financed by the Group are environmentally and socially sound and sustainable and that any potential environmental and social risks are identified, evaluated and where necessary, mitigated. In line with its policy, the Group will not finance any business activity that cannot reasonably be expected to meet the required environmental and social standards up front. Projects financed by the Group shall, at the minimum, comply with the national and/or local legislation and guidelines for environmental and social assessment and management. The Bank further conforms to the African Development Bank’s Environmental and Social Assessment Procedures (2001). Management ensures, through training and coaching, that there is an appropriate internal capacity to handle environ- mental and social issues. This is supplemented by external expertise, as the need arises. All the Bank’s employees in the Operations department are provided with a copy of the ESRP. The Group may finance projects for which no specific environ- mental or social guidelines exist. In such cases, general environmental and social considerations pertaining to emissions, liquid effluents, hazardous materials and wastes, solid wastes, ambient noise, occupational health and safety, life and fire safety and other hazards are borne in mind during the appraisal. BancABC recognises, that sustainable development is dependent upon a positive interaction between economic growth, social upliftment and environmental protection. As a responsible corporate citizen, the Group has a policy framework that is designed to ensure that all projects undertaken adhere to social and environmental regulations of the relevant local, national and international laws and standards. This policy framework commits the Group to: • provide in-house environmental education and support; • recognise the environmental burden caused by consump- tion of resources and release of waste from our own business activities and aim to protect the environment through resource recycling as well as efficient use of energy and resources; • support business activities that contribute to the protection and improvement of the environment; • monitor the effects of our activities on the environment and work towards continuous improvement and pollution prevention; • comply with all applicable laws and regulations related to environmental protection and other requirements to which BancABC Group companies are subject to and subscribe to; and • provide financing to projects with minimal adverse impact on the environment while ensuring that those having potentially major adverse environmental and social impact are accompanied by adequate mitigation measures. In order to ensure compliance with the last of these commit- ments, BancABC’s credit risk assessment seeks to ensure that the social and environmental effects of its financial support are assessed and monitored. This Environmental and Social Review Appraisal Procedure (ESRP) enables the integration of social and environmental safeguards in projects, to ensure that the potential risks associated with these issues are appropriately identified and mitigated. sOcial anD envirOnMental POlicy 23
  • 28.
    Botswana In Botswana, BancABCBotswana assisted a disabled wheelchair-bound artist, Ms Apeksha Bijoor to hold her first public art exhibition at the Maharaja Conference Centre during October 2011. The bank, the main sponsor of the event, contributed BWP50,000 towards the event. The art exhibition was a major success. However, it is with a great sense of sadness that we report that Ms Bijoor passed away on 17th January 2012, only a few months after this event. In December 2011, BancABC Botswana donated 65 wheel- chairs to His Excellency, The President of the Republic of Botswana, Lieutenant General Seretse Khama Ian Khama at the Tlokweng Main Kgotla. On the same day, bank staff spent the day at the “I Am Special Educational Society” in Tlokweng together with staff from the President’s Office to paint the centre and work on the vegetable garden. The bank contributed BWP200,000 towards these two initiatives. As an emerging Pan-African financial institution, BancABC recognises that it has a responsibility to uplift and play an active role in the communities in which it operates by supporting two pillars it has identified for action, namely: • Women and Children – by assisting with the economic upliftment of these groups, presently the most vulnerable groups on the African continent. • Arts and Culture – vibrant arts and culture are a vital expression of Africa’s identity and as such, deserve to be nurtured and celebrated. We strive to invest in sustainable projects and, through the involvement of our staff, actively demonstrate our goodwill and commitment to enhancing the lives of the disadvantaged through involvement in community-based initiatives. cOrPOrate sOcial resPOnsiBility rePOrt ABC Holdings Limited ANNUAL REPORT 201124
  • 29.
    Mozambique In 2011 acorporate social investment (CSI) committee was created in Mozambique to identify and contribute to worthwhile causes, while managing them and seeing them through to completion. Of the proposals and requests received in 2011, it was decided to sponsor the creation of a small library/reading room at a school for special needs children at one of the two existing schools for such children in Mozambique. The classroom selected for the transformation into a library was painted and refurbished. A computer, a TV, toys and an array of children’s books were also purchased for the facility. 25
  • 30.
    Corporate Social Responsibilityreport continued BancABC Tanzania also donated school items worth TZS2.5 million to children whose families were affected by the floods in the city of Dar es Salaam. The items included shoes, school uniforms, pens, exercise books, school bags, compasses and socks. We will continue to monitor the ongoing needs of communities and respond where we can. Zambia BancABC Zambia staff identified St. Martin’s orphanage as a worthy initiative during 2011. The home cares for 29 abandoned children, as well as children of parents who do not have the capacity to take care of their children due to a variety of causes. Staff members in our Kitwe Office contributed money from their thirteenth cheques, a donation that was matched by management. The contributions were used to buy an assortment of groceries and shoes for the orphans. Tanzania During 2011, BancABC Tanzania supported various initiatives, clearly demonstrating its commitment to Tanzania and its people. On 4 March 2011, an accidental bomb blast left hundreds of people in Gongo la Mboto homeless. To assist with immediate relief efforts, BancABC Tanzania donated 200 mosquito nets to help victims of the blast. BancABC Tanzania, participated as a co- sponsor of the Diplomatic Spouses Group (DSG) in its main Annual Charity fundraising bazaar. BancABC was the only bank to support this event. ABC Holdings Limited ANNUAL REPORT 201126
  • 31.
    BancABC Zambia isalso committed to Our Lady’s Hospice in Kalingalinga, Lusaka. The hospice provides day care, home- based care and hospital facilities to people suffering from HIV/AIDS. It also gives support in providing Anti-Retro Viral treatment to some patients. BancABC Zambia supports the hospice by providing a monthly donation to assist the lab to buy necessary supplies. During the year, BancABC Zambia also supported the Zambia Judo Association by sponsoring the tracksuits used at all international events, and the Zambia Cycling Union by sponsoring their cycling event to support healthy living in Zambia. Zimbabwe BancABC Zimbabwe has invested heavily in the Harare International Festival of The Arts (HIFA). The partnership with HIFA began in 2000 with BancABC sponsoring the opening day. Since then, HIFA has become one of the largest festivals of its type in Africa, attracting international artists and tourists, and promoting local arts and culture. Other CSR initiatives that the bank was involved in included: • Assisting a 26-year old woman with her medical costs. Her treatment is currently on-going and the bank continues to meet most of the medical expenses. • Assisting the Mutemwa Leprosy and Care Centre with the restoration of its electricitysupplyafteritwasdisconnected due to its inability to meet these costs. A monthly stipend continues to be made to cover these costs. • Paid the overdue school fees for the Fountain of Harare Shelter for Destitutes, a voluntary organisation that assists destitute women, orphans and vulnerable children. It trains women in sewing skills and pays school fees and buys uniforms for the children. • Paid a once-off amount to cover the travel expenses and learning materials for a deaf woman who had been accepted for tertiary education at the prestigious National Institute for the Deaf in Cape Town. • Adopting the Entembeni Old People’s Home for a year, donating a generator and providing a monthly donation to cover the purchase of groceries and fuel. 27
  • 32.
    accordance with establishedrisk management policies and procedures, most of which are discussed in the Financial Risk Management section. The Group’s primary risks are outlined below: Market risk The Group may be adversely impacted by global markets and economic conditions that can lead to fluctuations in interestandexchangerates,aswellasequityandcommodity prices. It may also be adversely impacted by significant holdings of financial assets, or significant loans or commit­ ments to extend loans. Risk management The directorate and management of ABC Holdings recognise that effective risk management is fundamental to the sus- tain­ability of its business. A strong risk management culture within the Group ensures an appropriate balance between the diverse risks and rewards inherent in any transaction and underpins sound decision making. Accordingly, a compre­hen­ sive risk management process is in place to evaluate, monitor and manage the principal risks the Group assumes in con-­ duc­ting its activities. In the course of conducting its business, the Group is exposed to various risks inherent in providing financial services. Some of these risks are managed in “Group Risk Management continually seeks to enhance its risk management techniques and provide assurance that risks are appropriately identified, monitored and controlled.” risk and governance report ABC Holdings Limited ANNUAL REPORT 201128
  • 33.
    mentactivitiesacrosstheGrouptoensurethatriskparameters are properly setand adhered to across all risk categories and in all Group companies. It also ensures that all risk exposures can be measured and monitored across the Group. Managing risk effectively is one of the key drivers of the Group’s con­ tinuous investment in technology. Group Risk Management continually seeks new ways to enhance its risk management techniques. It also updates the Group Risk Management Framework on a regular basis to reflect new policies adopted by the Board of Directors. Group Risk Management regularly reports to the Executive Committee and the Risk and Audit Committee, to provide the Board with assurance that risks are being appropriately identified, managed and controlled. Group Risk Management is headed by an executive manager who reports to the Group Chief Executive Officer (CEO). The Group’s Approach to Risk Management The Group’s approach to risk management involves a number of fundamental elements that drive its processes across the Group. The procedure and methodology is described in Group’s Enterprise-wide Risk Management Framework. The Group’s risk appetite sets out the level of risk that the Group is willing to take in pursuit of its business objectives. This risk appetite is calibrated against the Group’s broad financial targets in­ cluding profitability and impairment targets, dividend coverage and capital levels. The Group’s risk methodologies include systems that enable the Group to measure, aggregate and report risk for internal and regulatory purposes. As anexample, the Group’s credit grading models produce internal ratings through internally-derived estimates of default probabilities. This is discussed further under the Credit Risk Management section below. These measurements are used by manage- ment in an extensive range of activities, from credit grading, pricing and approval to portfolio management, economic capital allocation and capital adequacy processes. Credit risk The Group may be adversely impacted by an increase in its credit exposure related to trading, lending and other business activities. Potential credit related losses can result from an individual, counterparty or issuer being unable or unwilling to honour their contractual obligations. Liquidity risk The financial condition of the Group may be adversely impacted by an inability to borrow funds or sell assets to meet its obligations. Operational risk The Group may incur losses due to the failure of its people, internal processes or systems, or as a result of external events. Legal risk Legal proceedings against the Group or insufficient legal protection could adversely affect its operating results for a particular period and impact its credit ratings. Regulatory and legislative risks Many of the Group’s businesses are highly regulated and are subject to, and could be adversely impacted by, regulatory and legislative initiatives. Role of Group Risk Management Group Risk Management is responsible for maintaining a culture of risk awareness throughout the Group. While each business unit is primarily responsible for managing its own risks, Group Risk Management independently monitors, manages and reports on all risks facing the Group, as man­ dated by the Board of Directors. It coordinates risk manage­ 29
  • 34.
    The Board hasapproved the Group risk management frame­ work which applies to all Group companies and deals with enterprise-wide risk and governance protocol. Risk manage­ ment in the Group is underpinned by governance structures as well as risk ownership, identification and evaluation. Ownership and management of risks begin in the business units of each subsidiary, which identifies and evaluates risks particular to their function. Group Risk Management reviews actions taken by business units to mitigate identified risks. Group Risk Management Objectives The Group Risk Management function, as mandated by the Board of Directors is to: Approach to Risk Management The Board recognises that it is ultimately responsible and accountable to shareholders for: • the process of risk management and the systems of internal control; • identifying, evaluating and managing the significant risks faced by the Group; • ensuring that effective internal control systems are in place to mitigate significant risks faced; • ensuring that a documented and tested process is in place to allow the Group to continue its critical business in the event of a severe incident impacting its activities; and • reviewing the efficacy of the internal control system. Risk and governance report continued Operational Risk • Technology • Operational •  Compliance • Legal •  Regulatory • Reputational Credit • Credit Group Internal AuditALCO •  Interest rate • Liquidity •  Market • Currency •  Capital adequacy BOARD OF DIRECTORS Ultimately responsible for risk management Group ALCO Group ORCOManagement Credit Committee Specialised committees of the Board Responsible for enterprise-wide risk management across the Group Group Executive Committee Responsible for overseeing day-to-day risk management across the Group Audit and Risk Management Committee Board Credit Committee Loans Review Committee ABC Holdings Limited ANNUAL REPORT 201130
  • 35.
    • Assets andLiability Committee (ALCO) – responsible for interest rate, market, liquidity, counterparty, currency and capital adequacy risk; and • Operational Risk Committee (ORCO) – responsible for technology, compliance, legal, human resources, reputa­ tional, operational and regulatory risk. Reporting Each subsidiary or business unit produces risk reports which, along with the detailed risk information provided by Group Risk Management, is discussed by the Board. The risk reports present a balanced assessment of significant risks and the effectiveness of risk management procedures, and manage­ ment actions in mitigating those risks. Capital and Liquidity Risk Management ALCO reviews the capital status of the Group on a monthly basis. It also considers the activities of the treasury desk, which operates in terms of an approved treasury manage­ ment policy and in line with approved limits. ALCO reports to the Risk and Audit Committee in terms of the Group Risk Management Framework. Capital adequacy • Coordinate risk management activities across the organi­ sation, by ultimately becoming the custodian of BancABC’s risk management culture. • Analyse, monitor and manage all aspects of exposures across risk classes. • Ensure risk parameters and limits are set, approved and implemented and ensure that such risk parameters and limits are consistently adhered to. • Facilitate various risk management committees as part of the Group’s risk management process. Group Risk Management Framework The Group Risk Management Framework documents the risk management policies followed by the Group. These policies ensure that risks are consistently managed through­ out the Group through a set of internal controls. The policies also ensure that risk awareness filters down through every level of the Group, and that every employee understands their responsibility in managing risk. The following sub- commit­tees,comprisingexecutivesandseniormanagement, are responsible for dealing with the risks facing the Group in a structured manner: • Management Credit Committee (CREDCO) – responsible for credit risk; LIQUIDITY RISK MANAGEMENT STRUCTURE Short-term liquidity risk management Liquidity risk management committee •  Managing intra-day liquidity •  Managing short-term cash flows •  Managing interbank and repo levels Contingency liquidity risk management •  Establish and manage contingency funding plan •  Convene liquidity crisis management committee •  Assess regular liquidity stress testing and scenario analyses ALCO •  Managing long-term cash flows •  Identify and manage mismatches •  Establish liquidity risk appetite Long-term liquidity risk management 31
  • 36.
    Liquidity risk isbroadly managed by ALCO in terms of the Group risk management framework. A liquidity risk com­ mittee meets on a weekly basis to access and manage the overall liquidity of the Group. The Group approaches liquidity cautiously and conservatively by managing the liquidity profile with a preference for long-term, fixed rate funding. As such, the Group is exposed to funding liquidity risk. ALCO reviews a stress mismatch report monthly, which simulates stress scenarios based on the current asset and liability structure of the Group for the reporting month. The report also considers the available sources of stress funding to address any potential strain on the cash flows of the Group. In addition, the Group has a documented contingency funding plan (CFP) that specifies measures that must be monitored to identify indications of liquidity stress early. The plan provides management with a set of possible actions to address poten­ tial liquidity threats. The CFP operates in conjunction with the finance and treasury management policy and the assets and liabilities management (ALM) policy to ensure a coordinated approach to liquidity management. As part of its monthly meetings, ALCO considers the Group’s sensitivity to interest rate movements and reviews the results of management’s analysis of the impact of interest rate move­ments. ALCO also receives information on yield curve developments and money market interest rates, as well as analysis of the potential economic impact on interest rates and interest rate re-pricing. The Group strives to match asset and liability re-pricing positions as far as possible. There has been a refinement of the capital management framework, incorporating all the best practices in risk manage­ ment since the financial crisis happened. Implementation of the international accord on revised risk-based capital rules known as “Basel II” continues to progress. Our Capital manage­ment framework is for the most part guided by Basel II. In theory, Basel II attempts to accomplish this by setting up risk and capital management requirements designed to ensure that a bank has adequate capital for the risk the bank exposes itself to through its lending and invest­ ment practices. Generally speaking, these rules mean that the greater risk to which the bank is exposed, the greater the amount of capital the bank needs to hold to safeguard its solvency and overall economic stability. and the use of regulatory capital are reported periodically to the central banks of the Group’s operating countries, in line with respective regulatory requirements. ALCO comprises broadly representative executive and senior managers in­clud­ ­ing the Group CEO, Chief Operating Officer, Chief Financial Officer, Chief Risk Officer, Group Head of Corporate Banking, Group Head of Treasury, Group Head of Retail Banking and Country Managing directors. Liquidity is of critical importance to financial institutions as has been recently reminded by the recent failures of global financial institutions, in large partly due to insufficient liquidity. Our markets present larger challenges primarily due to an under-developed secondary securities market and illiquid government securities. As such, the bank has in place a com­prehensive liquidity and funding policy to address both firm-specific and market-wide liquidity events. Our primary objective is to be able to fund the bank and to enable our core businesses to continue to operate and meet their obligations under adverse circumstances. We have established liquidity guidelines that are intended to ensure that we have sufficient asset-based liquidity to with­ stand the potential impact of deposit attrition or diminished liquidity in the funding markets. Our guidelines include main­ taining an adequate liquidity reserve to cover our potential funding requirements and diversified funding sources to avoid over-dependence on volatile, less reliable funding markets. We seek to manage liquidity risk according to the following principles; • Excess liquidity – We seek to maintain excess liquidity to meet a broad and comprehensive range of potential cash outflows and collateral needs in a stressed environment. • Asset-Liability Management – Through ALCO, we assess anticipated holding periods for our assets and their poten­ tial illiquidity in a stressed environment. We manage maturity mismatches and level of funding diversification across markets, products and counter-parties and seek to maintain liabilities of appropriate tenor relative to our asset base. • Contingency Funding Plan – We seek to maintain a con­ tingency funding plan to provide a framework for analysing and responding to a liquidity crisis situation or periods of market stress. The framework sets the plan of action to fund normal business activity in emergency and stress situations. Risk and governance report continued ABC Holdings Limited ANNUAL REPORT 201132
  • 37.
    BancABC rating scale BancABC defaultsrates BancABC retail score Standard Poor’s ratings Grade quality A+ 0.10% 246 – 255 AAA – AA Investment Grade A 0.25% 236 – 245 AA+ A- 0.33% 226 – 235 AA B+ 0.40% 216 – 225 AA- B 0.50% 201 – 215 A+ B- 0.66% 191 – 200 A C+ 0.80% 181 – 190 A- C 0.96% 166 – 180 BBB+ C- 1.30% 156 – 165 BBB D+ 1.80% 146 – 155 BBB- D 2.65% 136 – 145 BB+ Sub-investment Grade D- 3.80% 126 – 135 BB E+ 7.85% 116 – 125 BB- E 12.90% 106 – 115 B+ E- 16.88% 96 – 105 B F+ 26.00% 86 – 95 B- F 38.67% 76 – 85 CCC+ F- 45.00% 61 – 75 CCC G Default 0 – 60 CCC- Default Credit Risk Management Independent credit risk committees in each of the Group’s operating countries are responsible for managing, measuring and mitigating credit risk. Credit risk management is overseen by the Group Credit Committee (CREDCO), a management committee that reports to the Board Credit Committee. There is a high level of executive involvement in the credit decision making team. The Group CREDCO includes the Chief Executive Officer, Chief Operating Officer, Chief Financial Officer, Chief Risk Officer, Chief Credit Officer and the Managing Director of BancABC Zimbabwe. The Group’s policy is that all sanctioning members of the CREDCO have voting powers. At Group CREDCO level, all decisions to enter a transaction are based on unanimous consent. The CREDCO formally meets on a weekly basis to consider the activities and operations of the credit division, to consider and debate results from new business, arrears and provisioning analyses, as well as to consider regulatory compliance and to set and amend credit policy where appropriate. Approach to Measuring Credit Risk The Group’s approach to measuring credit risk aims to align with international best practice and is, in all substantial aspects, aligned with the standard approach and methodology employed by international financial institutions. Credit risk is broken down into the common risk components of probability of default (PD), Exposure at Default (EAD) and Loss Given Default (LGD), modelled at a client, facility and portfolio level. These risk components are used in the calculation of a number of aggregate risk measures such as Expected Loss (EL). The models used by the Group are aimed to be compliant with Basel II and regulatory requirements. BancABC default probability table below shows the mapping of the corporate rating to retail credit scoring to align credit risk appetite assessment and tolerance across consumer and corporate businesses. 33
  • 38.
    general impairments raised.Any situations in which general impairments are insufficient to cover total EL in totality have a direct bearing on the Group’s capital requirement to ensure that these potential losses can be absorbed. Operational Risk Management Operational risk is defined as the risk of loss resulting from inadequate or failed internal processes, people and systems or from external events. Such operational risks may include exposure to theft and fraud, improper business practices, client suitability and servicing risks, unauthorised trans­actions, product complexity and pricing risk or from improper recording, evaluating or accounting of transactions. The Group could suffer financial loss, disruption to its business, liability to clients, regulatory intervention or reputational damage from such events, which could affect its business and financial condition. Managing operational risk requires timely and reliable as well as a strong control culture. We seek to manage our operational risk through: • active participation of all business units in identifying and mitigating key operational risks across the Group; • the training and development of the banks employees; • independent control and support functions that monitor operational risk periodically; and • a network of systems and tools throughout the bank to facilitate the collection of data used to analyse and assess our operational risk exposure. Operational risk is managed by ORCO in terms of the Group’s Operational Risk Framework (ORF), a subset of the Group Risk Management Framework. ORCO comprises executive and senior managers including the Chief Operating Officer, Chief Risk Officer, Chief Information Officer, Group Head of Retail Banking, Group Head of Market and Operational Risk, Group Head of Banking Operations, Group Chief Legal Counsel and Group Head of Human Capital. Our operational risk framework is in part designed to comply with operational risk measurement and assessment rules under Basel II. The Group’s operational risk management processes focus primarily on risk assessment, loss data col­lec­ tion and the tracking of key risk indicators. The results of these processes are used to raise awareness of operational risk man­agement and to enhance the internal control environ­ ment, with the ultimate aim of reducing losses. Risk and governance report continued BancABC default probabilities for each rating buckets are much more conservative, i.e., for the same rating BancABC implies a much higher likelihood of defaults than the cor­re­ sponding Standard Pour’s. The definition of default and the use of PD is standard as prescribed by the Basel II framework and regulation. Probability of Default (PD) The PD measures the likelihood of a client defaulting on its obligations within the next twelve months and is a primary component of the internal risk rating calculated for all clients. Exposure at Default (EAD) In general EAD can be defined as an estimation of the extent to which a bank may be exposed to a counterparty in the event of a counterparty’s default within a one-year period. The Group calculates EAD estimates for each facility through models developed and based on internal and external default data as well as credit experts’ experience with particular products or client groups. EAD estimates incorporate both on- and off-balance sheet exposures resulting in a capital requirement that incorporates existing exposures, as well as exposures that are contingent on a counterparty’s use of an available facility. Loss Given Default (LGD) The third major risk component measures the loss expected on a particular facility in the event of default and thus recog­ nises any credit risk mitigants employed by the bank, such ascollateral,thirdpartyguarantees,creditderivativeprotection or other credit hedges. LGD estimates are calculated through internally developed models, as well as a broad base of expert judgment from credit representatives and the results are primarily driven by the type and amount of collateral held. Expected Loss and Capital requirements The three components, PD, EAD and LGD, are building blocks used in a variety of measures of risk across the entire port­ folio. EL is the measurement of loss, which enables the application of consistent credit risk measurement across all retail and wholesale credit exposures. LGD, EAD and PD estimates are also used in a range of business applications, including pricing, customer and portfolio strategy and perfor­ mance measurement. EL estimates can be compared directly to portfolio impairment figures within the regulatory capital calculation to ensure that the organisation’s estimates of EL from doing business are sufficiently covered by the level of ABC Holdings Limited ANNUAL REPORT 201134
  • 39.
    made substantial commitmentthrough development of tools and systems to establish stress testing capabilities as a core business process. Compliance Risk Management Compliance risk is the risk of non-compliance with all relevant regulatory statutes, central bank supervisory requirements and industry codes of practice. The compliance function is an integral part of the overall Group Risk Management function. A decentralised compliance function has been im­ple­mented within business units and subsidiaries, and compliance officers have been appointed in each operating entity. Compliance risk is effectively managed through developing and implementing compliance processes, developing effective policies and procedures affecting the respective regulatory frameworks, and providing advice and training on the con­ stantly changing regulatory environment. A key role of com­ pliance officers in the Group is to develop and maintain sound working relationships with its various regulators in the Group’s operating countries. Legal risk management The Group Chief Legal Counsel is responsible for ensuring that legal risk is adequately managed. This is achieved through Legal and compliance risks are dealt with by ORCO, with the Group Chief Legal Counsel being a member of ORCO. Stress Testing As a part of our core risk management practices, we conduct enterprise-wide stress tests on a periodic basis to better understand earnings, capital and liquidity sensitivities to certain economic and business scenarios, including economic and market conditions that are more severe than anticipated. These enterprise-wide stress tests provide an under-standing of the potential impacts from our risk profile to earnings, capital and liquidity, and serve as a key component of our capital management practices. Scenarios are selected by senior management. Impacts to each line of business from each scenario are then determined and analysed, primarily leveraging the models and processes utilised in everyday management routines. Impacts are assessed along with potential mitigating actions that may be taken. Analysis from such stress scenarios is compiled for and reviewed through our weekly Liquidity Risk Management Committee, Asset Liability Market Risk Com- mit­­tee, Executive Management Committee and the Board’s Risk and Audit Committee, and serves to inform and be incorporated, along with other core business processes, into decision-making by management and the Board. We have 35
  • 40.
    Risk and governancereport continued Board of Directors The Board currently comprises nine directors, including four independent non-executive directors, two non-executive directors and three executive directors. This balanced repre­ sen­tation ensures that no one individual or small group can dominate decision making. The depth of experience and diversity of the Board ensures that robust and forthright debate on all issues of material importance to the Group can take place. Profiles of directors appear on pages 40 to 41 of this report. The roles of Chairman and CEO are separate and no indivi­ dualhasunfetteredcontroloverdecisionmaking.TheChairman is a non-executive director appointed by the Board. The Board is responsible to shareholders for setting the strategic direction of the Group, monitoring operational perfor­ mance and management, risk management processes and policies, compliance and setting authority levels, as well as selecting new directors. The Board is also responsible for the integrity and quality of communication with stakeholders, including employees, regulators and shareholders. The Board has adopted a risk management framework and has delegated responsibility for risk to the Risk and Audit Committee. This committee reviews risk management processes in the Group and ensures that Board policies and decisions on risk are properly implemented. The committee assessestheadequacyandeffectivenessofriskmanagement structures in the Group and reports to the Board on all risk related governance issues. All directors have direct access to information on the Group’s affairs, as well as the advice and services of the Group Chief Legal Counsel. A formal Board charter has been adopted which sets out the roles, responsibilities and procedures of the Board. Individual country operations have their own boards, with external representation and function as per the requirements of their respective jurisdictions. The Board meets at least four times annually. Additional telephonic meetings are also conducted during the year. The CEO and senior executives are available to brief directors when required. standard approved legal documentation wherever possible. However, specialised external legal advisers are used when required for non-standard transactions. The Group Chief Legal Counsel ensures that only approved legal advisers provide legal opinions or draw up specialised agreements for the Group. Group Internal Audit The primary function of internal audit is to give objective assurancetotheBoardthatadequatemanagementprocesses are in place to identify and monitor risks, and that effective internal controls are in place to manage those risks. Group Internal Audit independently audits and evaluates the effective­ ness of the Group’s risk management, internal controls and governance processes. Internal audit operates under terms of reference approved by the Risk and Audit Committee. The terms of reference define the role and objectives, authority and responsibility of the audit function. The Group’s reporting structures ensure that the Group Internal Auditor has unrestricted access to the Chairman of the Risk and Audit Committee and the Group CEO. At the outset of each financial year, Group Internal Audit carries out a risk assessment for all business units and subsidiaries. A comprehensive audit plan for the year that identifies specific areas of focus is then derived from this assessment. The audit plan is reviewed regularly and any changes must be approved by the Risk and Audit Committee. The areas of focus are confirmed with executive manage­ mentbeforebeingsubmittedtotheRiskandAuditCommittee for approval. Corporate governance The Group is committed to the principles of openness, integrity and accountability. In February 2003, the Board endorsed the adoption of the second King Report on Corporate Governance (King II). Since 2010 the board has incorporated some of the principles of King III and specifically has adopted a combined assurance model of reporting by the internal auditors, the risk officers and external auditors to its audit committee in order to promote a coordinated approach to all assurance reporting on the risk areas of the business. ABC Holdings Limited ANNUAL REPORT 201136
  • 41.
    Risk and AuditCommittee The Risk and Audit Committee is chaired by Mr N Kudenga who is an independent non-executive director. The committee adopted the terms of reference for both the Risk Committee and Audit Committee as detailed in the King Reports on Corporate Governance. In particular, it assists the Board in the discharge of its duties relating to financial reporting to all stakeholders,compliance,riskmanagementandtheeffective­ ness of accounting and management information systems. Meetings are held regularly throughout the year and are attended by external and internal auditors, as well as senior executive managers. The committee met four times in 2011. Issues addressed included reviewing accounting policies, implementing Basel II, disposing of certain Group assets, capital raising initiatives, the internal audit ratings policy, IT connectivity issues, business continuity planning, financial reporting, operational risks, capital adequacy and compliance, among others. The committee considered whether the Company and the Group are going concerns, recommending that the Board endorse a statement to this effect and that the financial statements prepared on this basis be approved. Loans Review Committee The Loans Review Committee comprises two non-executive directors and is chaired by Mrs D Khama. In accordance with its terms of reference, the committee’s principal function is to review and report to the Board on the Group’s loan port­folio at least quarterly. The committee places specific emphasis on ensuring conformity of the loan portfolio and lending function to a sound documented lending policy. It also periodically reviews the maximum loan authority limits for each Group lending authority as well as write-offs within the Group. The committee is further tasked with the quarterly review of the adequacy of provisions made with respect to loans and makes recommendations to the Board in this regard. The committee met four times in 2011 and issues addressed included the review of Group and country credit policies and guidelines to ensure that these meet best international banking practice, as well as the delinquent loan recovery strategy and adequacy of Group provisions. Four Board meetings were conducted during the year. Directors’ attendance of these meetings was as follows: Director March June Aug Dec Buttery P P P P Khama P P P P Kudenga P P P P Munatsi P P P P Wasmus P P P P Ipe P P * * Shyam-Sunder P P P P Moyo P P P P Dzanya P P P P Schneiders n/a n/a n/a P P: Present A: Absent *: Resigned Board committees The Board is assisted in discharging its responsibilities by a number of sub-committees. Sub-committees are accountable to the Board, with minutes of sub-committee meetings circu­ lated and reported on at the following Board meeting. Senior executives are invited to attend meetings as appropriate. Board committees may make use of external professional advisers when necessary to discharge specific tasks. Executive Committee The Executive Committee (EXCO) assists the CEO in man­ aging the Group and implementing strategy, policies and procedures, subject to the Board’s limitations on delegation to the CEO. The CEO’s authority in managing the Group is unrestricted. EXCO assists the CEO in managing the Group and setting the overall direction of the business of the Group, and acts as a medium for communication and coordination between business units and Group companies, and the Board. EXCO meetings are conducted monthly. The following divisional and functional heads comprise EXCO: CEO (Chairman), Chief Operating Officer, Chief Financial Officer, Chief Risk Officer and the Managing Director of BancABC Zimbabwe. EXCO also considers non-remuneration aspects of human resources management such as succession planning and skills development. 37
  • 42.
    Health and safetypolicy The Group seeks to ensure that it engages in activities which do not jeopardise the health and safety of its employees, taking into account the industrial sectors concerned. The Group encourages the businesses it supports to adopt appropriate health and safety measures and to comply, withinareasonableperiod,withlocallegislativerequirements concerning occupational health and safety. Environmental policy The Group’s directorate and management recognise that sustainable development depends on a positive balance between economic development and environmental pro­ tection. The Group believes that conserving the global environment is the responsibility of every individual, and as a good corporate citizen it strives to fulfil its responsibility to society by working towards realising a sustainable environ­ ment. Accordingly, the Group will endeavour to pursue best practice in environmental management and will put in place guidelines and procedures to ensure that projects are under­ taken in accordance with the relevant local, national and international standards with regard to environmental and social regulations. Risk and governance report continued Credit Committee The committee was established in 2010. It is chaired by Mr Buttery and has a mandate to approve loans above the internal management limit of US$7 million. The committee meets when required to approve loans. Remuneration Committee The Remuneration Committee is chaired by Mr H Buttery, a non-executive director and Chairman of the Board. The CEO attends committee meetings by invitation, but does not participate in any discussions on his own remuneration. The committee is responsible for the senior executive remune­ ration policy. It fixes the remuneration packages of individual directors within agreed terms of reference, to avoid potential conflicts of interest. The Remuneration Committee is also responsible for setting the remuneration policy of the Group. It aims to ensure that the financial rewards offered by the Group to employees are sufficient to attract people of the calibre required for effective running of the Group and to produce the required returns to its shareholders. The committee reviews the profit sharing scheme annually, which is based on achieving a specified return on equity for the period. The committee met four times during the year under review. Nominations Committee The Nominations Committee comprises two non-executive directors and is responsible for making recommendations to the Board on all new board appointments. A formal process is in place in terms of which the skills needed are identified and those individuals who might best assist the Board in their endeavours are recruited. Dealing on stock exchanges As part of its commitment to conducting business in a pro­ fessional and ethical manner at all times, the Group follows strict guidelines with respect to dealing of its shares on stock exchanges by employees and directors. A policy is in place prohibiting directors and employees in dealing in the Group’s shares when they are in possession of price sensitive information, which may generally not be available to the public. Dealing in ABCH shares is further restricted during defined periods, generally six weeks prior to the publication of the interim and final results. ABC Holdings Limited ANNUAL REPORT 201138
  • 43.
    ABC Holdings Limited Boardof Directors *Non-executive **Independent non-executive • Howard J Buttery** • Doreen Khama** • Ngoni Kudenga** • Mark Schneiders* • Johannes Wasmus** • Lakshmi Shyam-Sunder* • Douglas T Munatsi • Bekithemba Moyo • Francis Dzanya Chairman Group Chief Executive Officer Remuneration Committee • Howard J Buttery • Ngoni Kudenga Chairman Loans Review Committee • Doreen Khama • Lakshmi Shyam-Sunder Chairperson Credit Committee • Howard J Buttery • Johannes Wasmus • Douglas T Munatsi Chairman Nominations Committee • Howard J Buttery • Ngoni Kudenga Chairman Risk and Audit Committee • Ngoni Kudenga • Johannes Wasmus • Lakshmi Shyam-Sunder Chairman Executive Committee • Douglas T Munatsi • Francis Dzanya • Beki Moyo • Hashmon Matemera • Dr Blessing Mudavanhu Chairman Group Management • Nagarajan Santhanam • Bruce Jonker • Cornelius Munyurwa • Leah Banda • Andrea Prazakova • Johan Testa • Melanie Vogt • Paul Westraadt • Andre Willemse • Wallace Siakachoma • Dana Botha Chief Information Officer Group Internal Auditor Group Head Banking Operations Group Head Marketing Group Head Retail Banking Group Head Treasury Chief Legal Officer and Secretary to the Board Chief Credit Officer Group Head Human Capital Group Finance Executive Group Head of Corporate Banking directors and group management 39
  • 44.
    1 Howard JButtery (South African) Board Chairman Non-Executive Director Howard Buttery was born in South Africa in 1946. He has served as a director since 2003 and on the Remuneration and Nominations Committee. Howard was appointed non-executiveChairmanofABCHoldingsLimited(BancABC) in June 2010. He recently retired from the position of Executive Chairman of Bell Equipment Ltd, a listed South African company. His current focus is on developing a strategic alliance of three international companies: John Deer (United States), Liebher (Germany) and Hitachi (Japan). Howard has extensive knowledge of business across the African continent offering key in-sight to the organisation. He holds a certificate in theory of accounting from the University of Natal. 4 Doreen Khama (Motswana) Board Member Non-Executive Director Doreen Khama was born in Botswana in 1949. Doreen has been a director since 2007 and a member of our Loans Review Committee. She is founder and senior partner of the law firm Doreen Khama Attorneys, a reputable legal firm in operation for over 20 years. She is also the Honorary Consul for Austria in Botswana. Doreen is active in business initiatives in Africa and inter­ nationally, and has earned a high standing of professional prominence through her international affiliations. She serves as a director and board member for several organisations across various industries, including Botswana Savings Bank, Lengao Holdings and PEP Holdings. Doreen holds a Bachelor’s Degree in Law from the Uni­ver­ sity of Botswana, Lesotho and Swaziland. 3 Dr Lakshmi Shyam-Sunder (American) Board Member Non-Executive Director Lakshmi Shyam-Sunder was born in America in 1956. Lakshmi is CFO and Director, Finance and Risk Multilateral Investment Guarantee Agency at the World Bank Group. She has wide-ranging financial experience, which includes a period on the Finance Faculty of the MIT Sloan School of Management in the USA and at the Tuck School of Business Administration, Dartmouth College. She joined the IFC in 1994 and prior to being appointed a Director held a number of positions within the institution working in treasury and portfolio management before being named Director of Risk Management and Financial Policy for IFC. Lakshmi holds a Ph.D in Finance from the MIT Sloan School of Management and an MBA from the Indian Institute of Management, Ahmedabad, India. 2 Douglas T Munatsi (Zimbabwean) Group Chief Executive Officer Board Member Douglas “Doug” Munatsi was born in Zimbabwe in 1962. He has been the CEO of BancABC since its formation in 2000 and was Managing Director of its predecessors, First Merchant Bank and Heritage Investment Bank (Heritage). Doug founded Heritage in 1995. He later successfully negotiated Heritage’s merger with First Merchant Bank Ltd, then controlled by Anglo American Corporation. Prior to setting up Heritage, he was an executive with the International Finance Corporation (IFC), the private sector arm of the World Bank. Doug holds a Bachelor of Business Studies degree from the University of Zimbabwe, a Master of Business Admini­ stration (Finance) from the American University, Washington DC and completed the Harvard Business School’s Advanced Management Programme. Directors and Group management continued ABC Holdings Limited ANNUAL REPORT 201140
  • 45.
    6 Johannes Wasmus (Dutch) Board Member Non-ExecutiveDirector Hans Wasmus was born in Holland in 1941. Hans has been a director since 2003, and has served as Chairman of the Loans Review Committee. He currently is a member of the Risk and Audit Committee. Hans previously served as Chief Financial Officer and Regional Manager for Africa at FMO, a Netherlands- based development finance institution. He holds a Diploma in Accountancy from the Netherlands Institute for Chartered Accountants and a Diploma in Economics. 8 Francis Dzanya (Zimbabwean) Group Chief Operating Officer Board Member Francis Dzanya was born in Zimbabwe in 1960. Mr Dzanya has been Chief Operating Officer since April 2008 and Chief Banking Officer before that. He has also been a member of the Executive Committee since 2006. Francis joined Heritage at its formation in 1995 having spent over ten years with other banking institutions in the region. Francis holds a Bachelor of Arts (Honours) degree in Banking, Insurance and Finance from Sheffield Hallam University in the United Kingdom (UK) and a Higher National Diploma in Banking and Finance from John Moores University, also in the UK and is an Associate of the Chartered Institute of Bankers, UK. 9 Beki Moyo (Zimbabwean) Group Chief Financial Officer Board Member Beki Moyo was born in Zimbabwe in 1967. Mr Moyo has been the Chief Financial Officer since 2005. In the course of his banking career spanning over fifteen years, Beki has held various senior positions within ABC Holdings. Beki trained and qualified as a Chartered Accountant with Deloitte and Touché and quickly rose to Audit Manager. He then joined the banking world in 1994 as Chief Accountant at Stanbic Zimbabwe. He holds a Bachelor of Accountancy (Honours) degree from the University of Zimbabwe, a Master of Business Admini­ stration degree in Banking and Finance from Manchester University and com­ple­ tedtheHarvardBusinessSchool’sAdvanced Management Programme. 7 Mark M Schneiders (Dutch) Board Member Mark Schneiders was born in The Nether­ lands in 1956. Mark has more than 27 years of banking sector experience in various wholesale and private banks within Africa and around the globe serving as an entre­ preneurial finance professional. He has held various positions that include Managing Director with ING Financial Institutions in Amsterdam. Mark has extensive experience with com­ pany mergers, building new markets and setting up retail banking businesses in a variety of countries including Switzerland, TheNetherlands,Spain,Curaçao,Argentina, Venezuela, Hong Kong and USA. He was appointed to the Board on 9th December 2011. Mark holds a Bachelor’s and Master’s degree in law from the University of Leiden, The Netherlands, and completed the Advanced Management Program at Harvard Business School and various banking management programs at INSEAD (Cedep). 5 Ngoni Kudenga (Zimbabwean) Board Member Non-Executive Director Ngoni Kudenga was born in Zimbabwe in 1952. Mr Kudenga has been a director since 2000, chairman of the Risk and Audit Committee since 2000, a member of the Remuneration and Nominations Commit­ tees since 2007. He is currently the Managing Partner of BDO Zimbabwe (Chartered Accountants) and serves on the boards of listed com­pa­ nies Bindura Nickel Corporation and Hippo Valley Estates, Anglo American Corporation Zimbabwe and several other private com­ panies. Ngoni is past president of the Institute of Chartered Accountants in Zimbabwe and a fellow of the Chartered Institute of Management Accountants in the United Kingdom. He holds a Bachelor of Accountancy degree from the University of Zimbabwe. 41
  • 46.
    executive management committee 2 DrBlessing Mudavanhu (Zimbabwean) Group Chief Risk Officer Blessing Mudavanhu was born in Zimbabwe in 1971. Dr Mudavanhu was appointed Group Risk Officer in February 2009. Blessing spent many years working on Wall Street in New York, where most recently he was a director in Global Risk Management at Bank of America Merrill Lynch. He has published many research papers in the Journal of Investment Manage- ment and in many mathematics journals. He is also listed in the Who’s Who in America and is a recipient of the Fulbright Scholarship. He holds a Bachelor of Science (Honours) degree in Mathematics from the University of Zimbabwe, a Master of Science degree and a Doctorate in Mathematics from the University of Washington as well as a Master of Science in Financial Engineering from the Hass School of Business, University of California at Berkeley. Directors and Group management continued 1 Hashmon Matemera (Zimbabwean) Managing Director BancABC Zimbabwe Hashmon Matemera was born in Zim­babwe in 1964. Hashmon has been a member of the Executive Committee since 2006. He was the Group Head of Whole­sale Banking from 2007 before becoming Managing Director of BancABC Zim­babwe in 2011. Mr Matemera has over 17 years banking experience in merchant and commercial banking and as a central banker. He has held several positions including Executive Director of Banking Services at BancABC Zimbabwe and Group Head of Treasury and Structured Finance. Hashmon spent ten years at the Reserve Bank of Zim­babwe, mostly in the Supervision and Surveillance Division. Hashmon holds a Bachelor of Science (Honours) degree in Economics as well as a Master of Science in Economics both from the University of Zimbabwe. 3 Douglas T Munatsi (Zimbabwean) Group Chief Executive Officer 4 Beki Moyo (Zimbabwean) Group Chief Financial Officer 5 Francis Dzanya (Zimbabwean) Group Chief Operating Officer ABC Holdings Limited ANNUAL REPORT 201142
  • 47.
    ResponsiBility foR theannual finanCial statements The directors are responsible for the preparation, integrity and objectivity of the financial statements that fairly present the state of the affairs of the Group at the end of the financial year and the net income and cash flow for the year, and other information contained in this annual report. To enable the directors to meet these responsibilities: • the Board and management set standards and manage ­ ment implements systems of internal control and accounting and information systems aimed at providing reasonable assurance that assets are safeguarded and the risk of error, fraud or loss is reduced in a cost effective manner – these controls, contained in established policies and procedures, include the proper delegation of responsi­ bilities and authorities, effective accounting procedures and adequate segregation of duties; • the Group’s internal audit function, which operates inde­ pendently from operational management and has un­ restricted access to the Group Audit and Risk Committee, appraises, evaluates and, when necessary, recommends improvements in the systems of internal control and accounting practices, based on audit plans that take cognisance of the relative degrees of risk of each function and internal control, accounting policies, reporting and disclosure; and • the Group Audit and Risk Committee plays an integral role in matters relating to financial and internal control, accounting policies, reporting and disclosure. The annual financial statements have been prepared in accordance with the provisions of the Botswana Companies Act, the Botswana Stock Exchange Regulations and Inter­ national Financial Reporting Standards relating to companies and banks. The directors have no reason to believe that the Group or any subsidiary company within the Group will not be going concerns in the year ahead, based on the forecasts and available cash resource. These financial statements have accordingly been prepared on that basis. It is the responsibility of the independent auditors to report on financial statements. Their report to the members of the Company is set out on page 48 of this annual report. appRoval of the annual finanCial statements The directors’ report and the annual financial statements, which appear on pages 49 to 147, were approved by the Board of directors on 22 March 2012 and are signed by: H Buttery D T Munatsi Chairman Group Chief Executive Officer 27 March 2012 directors’ responsiBiLitY H Buttery D T Munatsi 43
  • 48.
    Nature of business ABCHoldings Limited is listed on the Botswana and Zimbabwe Stock exchanges and is the holding company of the African Banking Corporation group of companies (trading under the brand name BancABC) which comprise diverse financial services activities in the areas of corporate banking, treasury services, Retail and SME Banking, asset management, and stockbroking among other banking services. African Banking Corporation aims to deliver world-class financial solutions to the Sub-Saharan African region. Authorised share capital There was no change in the authorised or issued share capital of the Company during the year. Group results The Group posted a strong set of results for the period with all the banking subsidiaries, with the exception of Tanzania, reporting excellent results. Attributable profit at BWP83 million, is 24% higher than the BWP67 million achieved in the previous year. The profitability achieved was despite the Group’s on­ going massive investment in the Retail Banking business, which continued in the midst of mixed economic conditions that were a dominant characteristic of the banking sector during the reporting period. The Group balance sheet increased by 53% from BWP6 billion to BWP9.2 billion. Loans and advances were up almost two fold from BWP3.1 billion to BWP6.1 billion. This was largely funded by deposits that increased by 50% from BWP4.9 billion to BWP7.4 billion. All major lines of business recorded significant growth during the year. The Group now has 49 Retail branches including con­sumer lending branches, up significantly from 31 retail branches in 2010. Rapid expansion of retail banking operations continued, with BWP177 million being spent on essential hardware and software during the last 24 months. As was to be expected, staff numbers continued to grow. By the end of the reporting year staff numbers, including temporary and contract workers, stood at 1,008, compared to 668 at the end of December 2010. The financial statements have been prepared in accordance with International Financial Reporting Standards and the accounting policies of the Group, which are considered by the directors to be appropriate. Accounting policies have been applied in a manner consistent with that in the previous financial year and details of significant accounting policies can be found on pages 49 to 63. Subsidiary and associated companies Details of the Group’s subsidiaries are set out in note 15 of the separate Company financial statements. Details of the Groupassociatecompaniesareinnote13oftheconsolidated Group financial statements. Acquisitions and disposals There were no acquisitions or disposals of subsidiaries during the year. Directors’ interests in the shares of ABC Holdings Limited The following table depicts the interests of directors in the shares of ABC Holdings Limited: Number of shares Director 2011 2010 D T Munatsi 23,223,154 21,438,619 N Kudenga 366,814 365,947 F M Dzanya 3,094,774 2,765,583 B Moyo 7,119,958 7,099,957 Total 33,804,700 31,670,106 Directors’ interests in transactions In terms of ABC Holdings Limited policy, Directors are requiredtofurnishdetailsonanannualbasisoftheirrespective personal interests in business concerns which are recorded inaspecificregister.AnyinterestsbyDirectorsintransactions between the Company and third parties were disclosed to committees that were responsible for approval prior to such approval being granted and interested parties are required to recuse themselves from any approval process. Details of lending exposures are provided in note 25 on related party transactions. Directors Emoluments Directors’ emoluments in respect of the Group’s directors (Executive and Non-Executive) are shown in note 4 to the financial statements. The earnings and perquisites of the Group Chief Executive Officer and executive management are approved by the Remuneration Committee of the Board. directors’ report ABC Holdings Limited ANNUAL REPORT 201144
  • 49.
    Directors and Secretaries Fulldetails of the directorate are shown on pages 40 and 41. Details of the secretary are given on page 39. Brief CVs of directors eligible and available for re-election at the Annual General Meeting are included in the Notice to Shareholders. Dividends The Directors have declared a final dividend of BWP0.105 (10.5 Thebe) per share in respect of the year ended 31 December 2011. This brings the full year dividend to 17.5 Thebe. The dividend will be paid on 4th May 2012 to shareholders registered in the books of the Company at the close of business on Friday, 13th April 2012. Insurance ABC Holdings Limited and its subsidiaries are insured against banking risks, asset losses, professional indemnity and directors’ and officers’ claims at a level of cover, which is considered to be adequate by the directors. events after the reporting date There were no significant events after the reporting date. 45
  • 50.
    BancABC Botswana headofficeBancABC Zimbabwe head office ABC Holdings Limited ANNUAL REPORT 201146
  • 51.
    ANNUAL FINANCIAL STATEMENTS 48 Independentauditor’s report 49 Significant accounting policies 64 Financial risk management 91 Consolidated Group financial statements 115 Company separate financial statements 47
  • 52.
    for the yearended 31 December 2011 FIvE-yEAr FINANCIAL hIghLIghTS Chairman’s report continued PricewaterhouseCoopers, Plot 50371, Fairground Office Park, Gaborone, P O Box 294, Gaborone, Botswana T: (267) 395 2011, F: (267) 397 3901, www.pwc.com/bw Senior Partner: B D Phirie Partners: R Binedell, R P De Silva, A S Edirisinghe, N B Soni Associates: M Lalithkumar, M Ramdas, S Sinha, S K K Wijesena. INDEPENDENT AUDITOR’S REPORT TO THE MEMBERS OF ABC HOLDINGS LIMITED Report on the financial statements We have audited the accompanying consolidated annual financial statements and annual financial statements of ABC Holdings Limited, which comprise the consolidated and separate balance sheets as at 31 December 2011, and the consolidated and separate income statements, the consolidated and separate statements of comprehensive income, changes in equity and cash flows for the year then ended, and a summary of significant accounting policies and other explanatory information, as set out on pages 49 to 147. Directors’ Responsibility for the Financial Statements The company’s directors are responsible for the preparation and fair presentation of these financial statements in accordance with International Financial Reporting Standards, and for such internal control as the directors determine is necessary to enable the preparation of financial statements that are free from material misstatements, whether due to fraud or error. Auditor’s Responsibility Our responsibility is to express an opinion on these financial statements based on our audit. We conducted our audit in accordance with International Standards on Auditing. Those standards require that we comply with ethical requirements and plan and perform the audit to obtain reasonable assurance about whether the financial statements are free from material misstatement. An audit involves performing procedures to obtain audit evidence about the amounts and disclosures in the financial statements. The procedures selected depend on the auditor’s judgement, including the assessment of the risks of material misstatement of the financial statements, whether due to fraud or error. In making those risk assessments, the auditor considers internal control relevant to the entity’s preparation and fair presentation of the financial statements in order to design audit procedures that are appropriate in the circumstances, but not for the purpose of expressing an opinion on the effectiveness of the entity’s internal control. An audit also includes evaluating the appropriateness of accounting policies used and the reasonableness of accounting estimates made by management, as well as evaluating the overall presentation of the financial statements. We believe that the audit evidence we have obtained is sufficient and appropriate to provide a basis for our audit opinion. Opinion In our opinion, the financial statements give a true and fair view of, the consolidated and separate financial position of ABC Holdings Limited as at 31 December 2011, and its consolidated and separate financial performance and its consolidated and separate cash flows for the year then ended in accordance with International Financial Reporting Standards. PricewaterhouseCoopers 27 March 2012 Certified Auditors Gaborone Practicing member: Rudi Binedell (20040091.18) ABC Holdings Limited ANNUAL REPORT 201148
  • 53.
    Reporting entity ABC HoldingsLimited (the “Company”) is domiciled in Botswana. The consolidated financial statements of the Company for the year ended 31 December 2011 include the Company and its subsidiaries (together referred to as the “Group”) and the Group’s interest in associates and its jointly controlled entities. Statement of compliance The consolidated financial statements have been prepared in accordance with International Financial Reporting Standards (IFRS) as issued by the International Accounting Standards Board. In preparing these financial statements, the Group adopted the following interpretations effective in 2011, that are relevant to the Group: • Amendment to IAS 24, ‘Related Party Disclosures’, pro­ vides partial relief from the requirement for government related entities to disclose details of all transactions with the government and other government-related entities. It also clarifies and simplifies the definition of a related party. The adoption of the standard has no impact to the Group in the current year. • IFRIC 19, ‘Extinguishing Financial Liabilities with Equity Instruments’ clarifies the accounting when an entity re- ne­gotiates the terms of its debt with the result that the liability is extinguished through the debtor issuing its own equity instruments to the creditor. A gain or loss is recognised in the profit and loss account based on the fair value of the equity instruments compared to the carrying amount of the debt. The adoption of the standard has no impact to the Group in the current year. • Improvements to IFRSs, This is a collection of amend­ ments to IFRSs. These amendments are the result of conclusions the IASB reached on proposals made in its annual improvements project. The annual improvements project provides a vehicle for making non-urgent but necessary amendments to IFRSs. Some amendments involve consequential amendments to other IFRSs. Group has chosen not to early adopt the following standards and interpretations that were issued but not yet effective for accounting periods beginning on 1 January 2011: • Amendment to IFRS 7, ‘Financial Instruments: Disclosures’ – Transfer of financial assets (effective from 1 July 2011) • Amendment to IFRS 7, ‘Financial Instruments: Disclosure’ (effective from 1 January 2013) • Amendment to IAS 12, ‘Income taxes’ on deferred tax (effective from 1 January 2012) • Amendments to IAS 1, ‘Presentation of Financial Statements’, on presentation of items of OCI (effective from 1 July 2012) • Amendments to IAS 19, ‘Employee benefits’ (effective from 1 January 2013) • IFRS 9, ‘Financial Instruments’ (effective from 1 January 2013) • Amendments to IFRS 9, ‘Financial Instruments’ (effective from 1 January 2013) • IFRS 10, ‘Consolidated financial statements’ (effective from 1 January 2013) • IFRS 11, ‘Joint arrangements’ (effective from 1 January 2013) • IFRS 12, ‘Disclosures of interests in other entities’ (effective from 1 January 2013) • IFRS 13, ‘Fair value measurement’ (effective from 1 January 2013) • IAS 27 (revised 2011), ‘Separate financial statements’ (effective from 1 January 2013) • IAS 28 (revised 2011), ‘Associates and joint ventures’ (effective from 1 January 2013) • Amendments to IAS 32, ‘Financial Instruments: Presentation’ (effective from 1 January 2014) The Group is yet to assess the full impact of the above standards and interpretations. Basis of preparation The Group presents accounts in accordance with IFRS. The consolidated financial statements are prepared in accordance with the going concern principle under the historical cost basis as modified by the revaluation of financial instruments classified as available-for-sale, financial assets and liabilities held “at fair value through profit or loss”, land and buildings and investment properties. The consolidated financial statements comprise the con­ solidated income statement and statement of compre­ hensive income shown as two statements, the balance sheet, the statement of changes in equity, the cash flow statement and the notes. The Group classifies its expenses for the year ended 31 December 2011 significant accounting policies 49
  • 54.
    Significant accounting policiescontinued • Impairment of loans and advances The Group reviews its loan portfolios to assess impair- ment at least on a monthly basis. In determining whether an impairment loss should be recorded in the income statement, the Group makes judgements as to whether there is any observable data indicating that there is a measurable decrease in the estimated future cash flows from a portfolio of loans before the decrease can be iden­ tified with an individual loan in that portfolio. This evidence may include observable data indicating that there has been an adverse change in the payment status of borrowers in a group, or national or local economic conditions that correlate with defaults on assets in the Group. Manage- ment uses estimates based on historical loss experience for assets with credit risk characteristics and objective evidence of impairment similar to those in the portfolio when scheduling its future cash flows. The methodology and assumptions used for estimating both the amount and timing of future cash flows are reviewed monthly to reduce any differences between loss estimates and actual loss experience. • Fair value of derivatives The fair value of financial instruments that are not quoted in active markets is determined by using valuation tech­ niques. Where valuation techniques (for example, models) are used to determine fair values, they are validated and periodically reviewed by qualified personnel independent of the area that created them. All models are certified before they are used, and models are calibrated to ensure that outputs reflect actual data and comparative market prices. To the extent practical, models use only observable data; however, areas such as credit risk (both own and counterparty), volatilities and correlations require manage­ ment to make estimates. Changes in assumptions about these factors could affect reported fair value of financial instruments. • Held-to-maturity investments The Group follows the IAS 39 guidance on classifying non-derivative financial assets with fixed or determinable payments and fixed maturity, as held-to-maturity. This classification requires significant judgement. In making this judgement, the Group evaluates its intention and ability to hold such investments to maturity. If the Group fails to keep these investments to maturity other than by the nature of expense method, and presents its cash flows using the indirect method. The preparation of consolidated financial statements in con­ formity with IFRS requires management to make judgements, estimates and assumptions that affect the application of policies and reported amounts of assets and liabilities, income and expenses. These estimates and associated assumptions are based on historical experience and various other factors that are believed to be reasonable under the circumstances, the results of which form the basis for making the judgements about carrying values of assets and liabilities that are not readily apparent from other sources. Actual results may differ from these estimates. The estimates and underlying assumptions are reviewed on an ongoing basis. Revisions to accounting estimates are recognised in the period in which the estimate is revised if the revision affects only that period, or in the period of the revision and future periods if the revision affects both current and future periods. Judgements made by management in the application of IFRS that have a significant effect on the financial statements and estimates with a significant risk of material adjustment in the next year are discussed below: • Fair value of financial instruments Many of the Group’s financial instruments are measured at fair value on the balance sheet and it is usually possible to determine their fair values within a reasonable range of estimates. Fair value estimates are made at a specific point in time, based on market conditions and information about the financial instrument. These estimates are sub­ jective in nature and involve uncertainties and matters of judgement, (e.g. interest rates, volatility and estimated cash flows) and therefore cannot be determined with precision. • Deferred tax assets The recognition of deferred tax assets is based on profit forecasts made by management of the particular Group Company where the asset has arisen. These forecasts are based on the Group’s re-capitalisation plans of the subsidiary and market conditions prevailing in the economy in which the Company operates. ABC Holdings Limited ANNUAL REPORT 201150
  • 55.
    Basis of consolidation Subsidiaries Subsidiariesare those enterprises controlled by the Company. Control is defined as the power to govern the financial and operating policies of the entity so as to obtain benefits from its activities. The existence and effect of potential voting rights that are currently exercisable or convertible are con­ sidered when assessing whether the Group controls another entity. Subsidiaries are fully consolidated from the date that control commences until the date that control ceases. Accounting policies of subsidiaries conform to the policies adopted by the Group for its banking and investment manage­ ment activities. Investments in subsidiaries are accounted for at cost less impairment losses in the Company accounts. The carrying amounts of these investments are reviewed annually and written down for impairment where considered necessary. Associates Associates are those enterprises in which the Group has significant influence, but not control, generally accompanying a shareholding of between 20% and 50% of the voting rights over the financial and operating policies. The con­ solidated financial statements include the Group’s share of the total gains and losses of associates on an equityaccounted basis, from the date significant influence commences until the date that significant influence ceases. The Group’s share of its associates’ post-acquisition profits or losses is recognised in the income statement; its share of post-acquisition move­ ments in reserves is recognised in reserves. The cumulative post-acquisition movements are adjusted against the carrying amount of the investment. Goodwill arising on acquisition is included in the carrying amount of the investment. Investments in associates and joint ventures are accounted for at cost less impairment losses in the Company’s separate financial statements. Jointly controlled entities Jointly controlled entities are those enterprises over whose activities the Group has joint control established by contractual agreement. The consolidated financial statements include the Group’s share of the total gains or losses of the entity on an equity accounted basis from the date that joint control commences, until the date joint control ceases. for the specific circumstances – for example, selling an insignificant amount close to maturity – it will be required to reclassify the entire category as available-for-sale. The investments would therefore be measured at fair value, not amortised cost. • Income taxes The Group is subject to income taxes in numerous juris­ dictions. Significant estimates are required in determining the worldwide provision for income taxes. There are many transactions and calculations for which the ultimate tax determination is uncertain during the ordinary course of business. The Group recognises liabilities for anticipated tax audit issues based on estimates of whether additional taxes will be due. Where the final tax outcome of these matters is different from the amounts that were initially recorded, such differences will impact the income tax and deferred tax provisions in the period in which such determination is made. • Goodwill impairment The Group assesses goodwill for impairment on an annual basis based on value in use calculations. Significant esti­ mates and judgements are applied in projecting the future pre-tax cash flows, the appropriate growth and discount rates. The assumptions applied in testing goodwill for impair­ments at year end are discussed in note 17. • Impairment of associates The Group determines at each reporting date whether there is any objective evidence that the investment in the associate is impaired. If this is the case, the Group calculates the amount of impairment as the difference between the recoverable amount of the associate and its carrying value and recognises the amount in the income statement. Functional and presentation currency The financial statements are presented in Botswana Pula (BWP), which is the Company’s functional currency and the Group’s presentation currency. Except as indicated, financial information presented in BWP has been rounded off to the nearest thousand. 51
  • 56.
    irrespective of theextent of any minority interest. Goodwill is carried at cost less accumulated impairment losses. Goodwill is allocated to cash generating units and is not amortised but is tested annually for impairment. Impairment losses are recognised in the income statement. The excess of the fair value of the Group’s share of the identifiable net assets acquired over the cost of the acquisition is recorded immediately in the income statement. Business combinations The acquisition method of accounting is used to account for the acquisition of subsidiaries by the Group. The cost of an acquisition is measured as the sum of the fair value of the assets given, equity instruments issued and liabilities incurred or assumed at the acquisition date. Transaction costs for any business combinations prior to 1 January 2010 are capitalised as part of the cost of an acquisition. Trans­ action costs on or after 1 January 2010 are recognised within profit and loss as and when they are incurred. Identifiable assets acquired and liabilities and contingent liabilities assumed in a business combination are measured initially at their fair values at the acquisition date, irrespective of the extent of any non-controlling interest. The excess of the cost of an acqui­sition over the Group’s share of the fair value of identifiable net assets acquired is recorded as goodwill and accounted for in terms of accounting policy, Intangible assets. The Group elects to measure non-controlling interests on the acquisition date at either fair value or at the non-controlling interest’s proportionate share of the subsidiary’s identifiable net assets. If the cost of the acquisition is less than the fair value of the net assets of the subsidiary acquired, the difference is recognised directly in profit or loss. Transactions with non-controlling interests Transactions, including partial disposals, with minority non- controlling interests shareholders that do not result in the gain or loss of control, are accounted for as transactions with equity holders of the Group. For purchases of additional interests from non-controlling interests, the excess of the purchase consideration over the Group’s proportionate share of the subsidiary’s additional net asset value of the subsidiary acquired is accounted for directly in equity. For disposals to non-controlling shareholders, the profit or losses on the partial disposal of the Group’s interest in a subsidiary to non- controlling interests is also accounted for directly in equity. All acquisition-related costs are expensed. Special purpose entities Special purpose entities (SPEs) are entities that are created to accomplish a narrow and well-defined objective. An SPE is consolidated if, based on an evaluation of the substance of its relationship with the Group and the SPE’s risks and rewards, the Group concludes that it controls the SPE. The assessment of whether the Group has control over an SPE is carried out at inception and normally no further reassessment of control is carried out in the absence of changes in the structure or terms of the SPE, or additional transactions between the Group and the SPE. Day-to-day changes in market conditions normally do not lead to a reassessment of control. However, sometimes changes in market conditions may alter the substance of the relationship between the Group and the SPE and in such instances the Group determines whether the change warrants a reassess­ ment of control based on the specific facts and circum­ stances. Where the Group’s voluntary actions, such as lending amounts in excess of existing liquidity facilities or extending terms beyond those established originally, change the relation­ ­ship between the Group and an SPE, the Group performs a reassessment of control over the SPE. Transactions eliminated on consolidation Intra-group balances and transactions, and any unrealised gains arising from intra-group transactions, are eliminated in preparing the consolidated financial statements. Unrealised gains arising from transactions with associates and jointly controlled entities are eliminated to the extent of the Group’s interest in the enterprise. Unrealised gains arising from trans­ actions with associates and joint ventures are eliminated against the investment in the associate. Unrealised losses are eliminated in the same way as unrealised gains, but only to the extent that there is no evidence of impairment. Goodwill All business combinations are accounted for by applying the purchase method. Goodwill is any excess of the cost of an acquisition over the Group’s interest in the fair value of the identifiable assets and liabilities acquired. The cost of an acquisition is measured as the fair value of the assets given, equity instruments issued and liabilities incurred or assumed at the date of exchange, plus costs directly attributable to the acquisition. Identifiable assets acquired and liabilities and contingent liabilities assumed in a business combination are measured initially at their fair values at the acquisition date, Significant accounting policies continued ABC Holdings Limited ANNUAL REPORT 201152
  • 57.
    in the fairvalue of monetary securities denominated in foreign currency classified as available-for-sale are analysed between translationdifferencesresultingfromchangesintheamortised cost of the security and other changes in the carrying amount of the security. Translation differences related to changes in the amortised cost are recognised in the income statement, and other changes in the carrying amount are recognised in equity. Recognition of assets and liabilities Assets are recognised when the Group irrevocably gains control of a resource from which future economic benefits are expected to flow to the Group. Liabilities are recognised when the Group has a legal or constructive obligation as a result of past events and a reliable estimate of the amount of the obligation, or outflow of resources from the Group can be made. If there is a possible obligation or outflow of resources from the Group or where a reliable estimate is not available, a contingent liability is disclosed. Derecognition of assets and liabilities An asset is derecognised when the Group loses control over the contractual rights that comprise the asset. A liability is derecognised when it is extinguished. Cash and cash equivalents Cash and cash equivalents comprise cash balances on hand; cash deposited with banks and short-term highly liquid invest­ mentswithmaturitiesofthreemonthsorlesswhenpurchased. For cash flow purposes cash and cash equivalents include bank overdrafts. Financial assets Initial recognition The Group classifies its financial assets in the following cate­ gories: financial assets at fair value through profit or loss; loans and receivables; held-to-maturity investments; and available-for-sale financial assets. Management determines the classification of its investments at initial recognition. Regular-way purchases and sales of financial assets at fair value through profit or loss, held-to-maturity and available- for-sale are recognised on trade date; the date on which the Group commits to purchase or sell the asset. Financial assets are initially recognised at fair value plus transaction costs for all financial assets not carried at fair value through profit or loss. Financial assets carried at fair value through profit and Common control transactions Entities are under common control when the combining entities or businesses are ultimately controlled by the same party or parties both before and after the combination and where control is not transitory. The acquirer in a business combination under common control does not restate any assets and liabilities to their fair values. Instead, the acquirer incorporates the assets and liabilities at their pre-combination carrying amounts without fair value uplift. No goodwill is recorded. Any difference between the cost of investment and the carrying value of the net assets is recorded in equity, which could impact on distributable profits, depending on local legislation. This applies whether the consideration was for shares or cash. The acquirer’s financial statements include the acquired entity’s results from the date of the business combination. Foreign entities The assets and liabilities of foreign operations are translated to the Group’s presentation currency, Botswana Pula, from their respective measurement currencies at foreign exchange rates ruling at the balance sheet date. The revenues and expenses of foreign operations are translated to Botswana Pula at the average exchange rate for the year. Foreign exchange differences arising on translation are recognised as foreign currency translation reserve in equity. When a foreign operation is disposed of, or partially disposed of, such exchange differences are recognised in the income statement as part of the gain or loss on sale. Foreign currency transactions Foreign currency transactions are translated at the foreign exchange rates ruling at the date of the transaction. Monetary assets and liabilities denominated in foreign currencies at the balance sheet date are translated at the foreign exchange rate ruling at that date. Foreign exchange gains and losses that relate to borrowings and cash and cash equivalents are presented in the income statement within finance income or cost. All other foreign exchange gains are presented within the income statements within “other net (losses)/gains”. Differences arising on translation are recognised in the income statement and shown under other income, except when deferred in equity as qualifying cash flow hedges and qualifying net investment hedges. Non-monetary assets and liabilities denominated in foreign currencies that are measured at fair value are translated to the functional currency at the exchange rate at the date that the fair value was determined. Changes 53
  • 58.
    Loans and receivables Loansand receivables are non-derivative financial assets with fixed or determinable payments that are not quoted in an active market, other than: • those that the entity intends to sell immediately or in the short-term, which are classified as held for trading, and those that the entity upon initial recognition designates as at fair value through profit or loss; • those that the entity upon initial recognition designates as available-for-sale; or • those for which the holder may not recover substantially all of its initial investment, other than because of credit deterioration. Loans and advances are accounted for on an amortised cost basis using the effective interest rate. Origination transaction costs and origination fees received that are integral to the effective rate are capitalised to the value of the loan and amortised through interest income as part of the effective interest rate. The majority of the Group’s advances are included in the loans and receivables category. They are statednetofallowancesforspecificandportfolioimpairment. Included in loans and advances are finance lease receivables. Finance lease receivables are those leases where the Group transfers substantially all the risk and reward incidental to ownership of an asset. Finance lease charges are recognised in income using the effective interest rate method. Held-to-maturity investments Held-to-maturity investments are non-derivative financial assets with fixed or determinable payments and fixed maturities that the Group’s management has the positive intention and ability to hold to maturity. If the Group were to sell other than an insignificant amount of held-to maturity assets, the entire category would be reclassified as available- for-sale. Held-to-maturity fixed interest instruments, held in investment portfolios, are stated at cost, less any impairment losses. Available-for-sale financial assets Available-for-sale investments are those intended to be held for an indefinite period of time, which may be sold in response to needs for liquidity or changes in interest rates, exchange rates or equity prices or financial assets that are not designated as another category of financial assets. Available-for-sale quoted investments are valued at market loss are initially recognised at fair value, and transaction costs are expensed in the income statement. Financial assets at fair value through profit or loss This category has two subcategories: financial assets held for trading, and those designated at fair value through profit or loss at inception. A financial asset is classified as held for trading if it is acquired or incurred principally for the purpose of selling or repurchasing in the near term or if it is part of a portfolio of identified financial instruments that are managed together and for which there is evidence of a recent actual pattern of short-term profit taking. Derivatives are also cate­ gorised as held for trading, unless they are designated as hedging instruments. Financial assets and financial liabilities are designated at fair value through profit or loss when: • doing so significantly reduces measurement inconsis- tencies that would arise if the related derivatives were treated as held for trading and the underlying financial instruments were carried at amortised cost for loans and advances to customers or banks and debt securities in issue; • certain investments, such as equity investments, are managed and evaluated on a fair value basis in accordance with a documented risk management or investment strategy and reported to key management personnel on that basis are designated at fair value through profit or loss; or • financial instruments, such as debt securities held, con­ taining one or more embedded derivatives that could significantly modify the cash flows, are designated at fair value through profit or loss. The fair value designation, once made, is irrevocable. Sub­ sequent to initial recognition, the fair values are re-measured at each reporting date. Gains and losses arising from changes therein are recognised in interest income for all dated financial assets and in other revenue within non-interest revenue for all undated financial assets. Financial assets at fair value through profit or loss are measured at initial recognition and subsequently at fair value based on quoted market price using the bid/offer mid rate at the balance sheet date. If there is no quoted market price in an active market, the instru­ments are measured using valuation models. All changes in fair value are recognised in the income statement. Significant accounting policies continued ABC Holdings Limited ANNUAL REPORT 201154
  • 59.
    market transactions inthe same instrument, without modifi­ cation or repackaging, or based on discounted cash flow models and option pricing valuation techniques whose variables include only data from observable markets. When such valuation models, with only observable market data as input, indicate that the fair value differs from the transaction price, this initial difference, commonly referred to as day one profit or loss, is recognised in the income statement immediately. If non-observable market data is used as part of the input to the valuation models, any resulting difference between the transaction price and the model value is deferred. The timing of recognition of deferred day one profit or loss is determined individually. It is either amortised over the life of the transaction, deferred until the instrument’s fair value can be determined using market observable inputs, or realised through settlement. The deferral and unwind method is based on the nature of the instrument and availability of market observable inputs. Subsequent to initial recognition, the fair values of financial assets and liabilities are based on quoted market prices or dealer price quotations for financial instruments traded in active markets. A financial instrument is regarded as quoted in an active market if quoted prices are readily and regularly available from an exchange, dealer, broker, industry group, pricing service or regulatory agency, and those prices represent actual and regularly occurring market transactions on an arm’s length basis. If the above criteria are not met, the market is regarded as being inactive. Indications that a market is inactive are when there is a wide bid offer spread or significant increase in the bid offer spread or there are few recent transactions. If the market for a financial asset is not active or the instru­ ment is an unlisted instrument, the fair value is determined by using applicable valuation techniques. These include the use of recent arm’s length transactions, discounted cash flow analyses, pricing models and valuation techniques commonly used by market participants. Where discounted cash flow analyses are used, estimated future cash flows are based on management’s best estimates and the discount rate is a market related rate at the balance sheet date for a financial asset with similar terms and conditions. Where pricing models are used, inputs are based on observable market indicators at the balance sheet date and profits or losses are only recognised to the extent that they relate to changes in factors that market participants will consider in setting a price. value using the bid/offer mid rate. Unlisted equity invest­ ments and instruments for which there is no quoted market price are measured using valuation models. Where the valuation models may not produce reliable measurement, the unquoted investments are stated at cost. Available-for- sale investments are marked to market and any gains or losses arising from the revaluation of investments are shown in shareholders’ equity as available for-sale reserves. On realisation of the investment, the available-for-sale reserves are transferred to the income statement. Interest income, calculated using the effective interest method, is recognised in the income statement. Dividends received on available- for-sale instruments are recognised in the income statement when the Group’s right to receive payment has been esta­ blished. Foreign exchange gains or losses on available-for- sale debt investments are recognised in the income statement. Reclassification of financial assets The Group may choose to reclassify a non-derivative financial asset held for trading out of the held for trading category if the financial asset is no longer held for the purpose of selling it in the near term. Financial assets other than loans and receivables are permitted to be reclassified out of the held for trading category only in rare circumstances arising from a single event that is unusual and highly unlikely to recur in the near term. In addition, the Group may choose to reclassify financial assets that would meet the definition of loans and receivables out of the held for trading or available-for-sale categories if the Group has the intention and ability to hold these financial assets for the foreseeable future or until maturity at the date of reclassification. Reclassifications are made at fair value as of the reclassification date. Fair value becomes the new cost or amortised cost as applicable, and no reversals of fair value gains or losses recorded before reclassification date are subsequently made. Effective interest rates for financial assets reclassified to loans and receivables and held-to-maturity categories are determined at the reclas­ sification date. Further increases in estimates of cash flows adjust effective interest rates prospectively. On reclas­sification of a financial asset out of the “at fair value through profit or loss” category, all embedded derivatives are re-assessed and, if necessary, accounted for separately. Fair value The best evidence of the fair value of a financial instrument on initial recognition is the transaction price, i.e. the fair value of the consideration given or received, unless the fair value is evidenced by comparison with other observable current 55
  • 60.
    The amount ofthe loss is measured as the difference between theasset’scarryingamountandthepresentvalueofestimated future cash flows (excluding future credit losses that have not been incurred) discounted at the financial asset’s original effective interest rate. The carrying amount of the asset is reduced through the use of an allowance account and the amount of the loss is recognised in the income statement. If a loan or held-to-maturity investment has a variable interest rate, the discount rate for measuring any impairment loss is the current effective interest rate determined under the contract. As a practical expedient, the Group may measure impairment on the basis of an instrument’s fair value using an observable market price. The calculation of the present value of the estimated future cash flows of a collateralised financial asset reflects the cash flows that may result from foreclosure less costs for obtaining andsellingthecollateral,whether or not foreclosureisprobable. For the purposes of a collective evaluation of impairment, financial assets are grouped on the basis of similar credit risk characteristics (i.e. on the basis of the Group’s grading process that considers asset type, industry, geographical location, collateral type, past due status and other relevant factors). Those characteristics are relevant to the estimation of future cash flows for groups of such assets by being indicative of the debtors’ ability to pay all amounts due according to the contractual terms of the assets being evaluated. Future cash flows in a group of financial assets that are collectively evaluated for impairment are estimated on the basis of the contractual cash flows of the assets in the Group and historical loss experience for assets with credit risk characteristics similar to those in the Group. Historical loss experience is adjusted on the basis of current observable data to reflect the effects of current conditions that did not affect the period on which the historical loss experience is based and to remove the effects of conditions in the historical period that do not currently exist. Estimates of changes in future cash flows for groups of assets should reflect and be directionally consistent with changes in related observable data from period to period (for example, changes in unemployment rates, property prices, payment status, or other factors indicative of changes in the probability of losses in the Group and their magnitude). The methodology and assumptions used for estimating future cash flows are reviewed regularly by the Group to reduce any differences between loss estimates and actual loss experience. When a loan is uncollectible, it is written off In cases where the fair value of unlisted equity instruments cannot be determined reliably, the instruments are carried at cost less impairment. The fair value for loans and advances as well as liabilities to banks and customers are determined using a present value model on the basis of contractually agreed cash flows, taking into account credit quality, liquidity and costs. Impairment of financial assets a) Assets carried at amortised cost The Group assesses at each balance sheet date whether there is objective evidence that a financial asset or group of financial assets is impaired. A financial asset or a group of financial assets is impaired and impairment losses are incurred only if there is objective evidence of impairment as a result of one or more events that occurred after the initial recognition of the asset (a “loss event”) and that loss event (or events) has an impact on the estimated future cash flows of the financial asset or group of financial assets that can be reliably estimated. The criteria that the Group uses to determine that there is objective evidence of an impairment loss include: • delinquency in contractual payments of principal or interest; • cash flow difficulties experienced by the borrower (for example, equity ratio, net income percentage of sales); • breach of loan covenants or conditions; • initiation of bankruptcy proceedings; • deterioration of the borrower’s competitive position; • deterioration in the value of collateral; and • downgrading below investment grade level. The Group first assesses whether objective evidence of impair­ ­ment exists individually for financial assets that are individually significant, and individually or collectively for financial assets that are not individually significant. If the Group determines that no objective evidence of impairment exists for an indivi­ dually assessed financial asset, whether significant or not, it includes the asset in a group of financial assets with similar credit risk characteristics and collectively assesses them for impairment. Assets that are individually assessed for impair­ ment and for which an impairment loss is or continues to be recognised are not included in a collective assessment of impairment. Significant accounting policies continued ABC Holdings Limited ANNUAL REPORT 201156
  • 61.
    Derivative financial instruments andhedging activities A derivative is a financial instrument whose value changes in response to an underlying variable, that requires little or no initial investment and that is settled at a future date. Derivatives are initially recognised at fair value on the date on which a derivative contract is entered into and are sub­ sequently re-measured at their fair value. Fair values are obtained from quoted market prices in active markets, including recent market transactions, and valuation techniques, including discounted cash flow models and options pricing models, as appropriate. Where fair value is determined using valuation techniques whose variables include non- observable market data, the difference between the fair value and the transaction price (“the day one profit or loss”) is not recognised in the statement of financial position. These differences are however kept track of for disclosure purposes. However, where observable market factors that market parti­ ci­pants would consider in setting a price subsequently become available, the balance of the deferred day one profit or loss is released to profit or loss. All derivatives are carried as assets when fair value is positive and as liabilities when fair value is negative. Certain derivatives embedded in other financial instruments, are treated as sepa­ rate derivatives when their economic characteristics and risks are not closely related to those of the host contract and the host contract is not carried at fair value through profit or loss. These embedded derivatives are measured at fair value with changes in fair value recognised in the income statement unless the Group chooses to designate the hybrid contracts at fair value through profit or loss. The method of recognising the resulting fair value gain or loss depends on whether the derivative is designated as a hedging instrument, and if so, the nature of the item being hedged. The Group designates certain derivatives as either: a) hedges of the fair value of recognised assets or liabilities or firm commitments (fair value hedge); b) hedges of highly probable future cash flows attributable to a recognised asset or liability, or a forecasted transaction (cash flow hedge); c) hedges of a net investment in a foreign operation (net investment hedge); or d) derivatives that do not qualify for hedge accounting. against the related provision for loan impairment. Such loans are written off after all the necessary procedures have been completed and the amount of the loss has been determined. If, in a subsequent period, the amount of the impairment loss decreases and the decrease can be related objectively to an event occurring after the impairment was recognised (such as an improvement in the debtor’s credit rating), the previously recognised impairment loss is reversed by adjusting the allowance account. The amount of the reversal is recog­ nised in the income statement in impairment charge for credit losses. Subsequent to impairment, the effects of discounting unwind over time as interest income. b) Assets classified as available-for-sale The Group assesses at each balance sheet date whether there is objective evidence that a financial asset or a group of financial assets is impaired. In the case of equity investments classified as available-for-sale, a significant or prolonged decline in the fair value of the security below its cost is considered in determining whether the assets are impaired. If any such evidence exists for available-for-sale financial assets, the cumulative loss – measured as the difference between the acquisition cost and the current fair value, less any impair­ ment loss on that financial asset previously recognised in the income statement – is removed from equity and recognised in the income statement. Impairment losses recognised in the income statement on equity instruments are not reversed through the income statement. If, in a subsequent period, the fair value of a debt instrument classified as available-for- sale increases and the increase can be objectively related to an event occurring after the impairment loss was recognised in profit or loss, the impairment loss is reversed through the income statement. c) Renegotiated loans Loans that are either subject to collective impairment assess­ ment or individually significant and whose terms have been renegotiated are no longer considered to be past due but are treated as new loans. Offsetting financial instruments Financial assets and liabilities are offset and the net amount reported in the balance sheet when there is a legally enforce­ able right to offset the recognised amounts and there is an intention to settle on a net basis, or realise the asset and settle the liability simultaneously. 57
  • 62.
    to occur, thecumulative gain or loss that was reported in equity is immediately transferred to the income statement. c) Net investment hedge Hedgesofnetinvestmentsinforeignoperationsareaccounted for similarly to cash flow hedges. Any gain or loss on the hedging instrument relating to the effective portion of the hedge is recognised in equity; the gain or loss relating to the ineffective portion is recognised immediately in the income statement. Gains and losses accumulated in equity are included in the income statement when the foreign operation is disposed of. d) Derivatives that do not qualify for hedge accounting Certain derivative instruments do not qualify for hedge accoun­ ting. Changes in the fair value of any derivative instrument that does not qualify for hedge accounting are recognised immediately in the income statement under net trading income. However, the gains and losses arising from changes in the fair value of derivatives that are managed in conjunction with designated financial assets or financial liabilities are included in “net income from financial instruments desig­ nated at fair value”. Financial guarantees Financial guarantee contracts are contracts that require the issuer to make specified payments to reimburse the holder for a loss it incurs because a specified debtor fails to make payments when due, in accordance with the terms of a debt instrument. Such financial guarantees are given to banks, financial institutions and other bodies on behalf of customers to secure loans, overdrafts and other banking facilities. Financial guarantees are initially recognised in the financial statements at fair value on the date the guarantee was given. Subsequent to initial recognition, the Group liabilities under such guarantees are measured at the higher of the initial measurement, less amortisation calculated to recognise in the income statement the fee income earned on a straight- line basis over the life of the guarantee and the best estimate of the expenditure required to settle any financial obligation arising at the balance sheet date. These estimates are determined based on experience of similar transactions and history of past losses, supplemented by the judgement of management. Any increase in the liability relating to guaran­ tees is taken to the income statement under other operating expenses. Hedge accounting is used for derivatives designated in this way provided certain criteria are met. The Group documents atinceptionofthetransaction,therelationshipbetweenhedged items and hedging instruments, as well as its risk management objective and strategy for undertaking various hedge trans­ actions. The Group also documents its assessment, both at hedge inception and on an ongoing basis, of whether the derivatives that are used in hedging transactions are highly effective in offsetting changes in fair values or cash flows of hedged items. a) Fair value hedge Changes in the fair value of derivatives that are designated and qualify as fair value hedges are recorded in the income statement, together with any changes in the fair value of the hedged asset or liability that are attributable to the hedged risk. Effective changes in fair value of interest rate swaps and related hedged items are reflected in “net interest income – net gains/losses on hedging instruments”. Effective changes in fair value of currency futures are reflected in “net trading income – foreign exchange – transaction gains less losses”. Any ineffectiveness is recorded in “net trading income”. If the hedge no longer meets the criteria for hedge accounting, the adjustment to the carrying amount of a hedged item for which the effective interest method is used is amortised to the income statement over the period to maturity. The adjustment to the carrying amount of a hedged equity security remains in retained earnings until the disposal of the equity security. b) Cash flow hedge The effective portion of changes in the fair value of deri­ vatives that are designated and qualify as cash flow hedges are recognised in equity. The gain or loss relating to the ineffective portion is recognised immediately in the income statement – “net trading income – transaction gains less losses”. Amounts accumulated in equity are recycled to the income statement in the periods when the hedged item affects profit or loss. The gain or loss relating to the effective portion of currency swaps and options are recorded in “net trading income – foreign exchange – transaction gains less losses”. When a hedging instrument expires or is sold, or when a hedge no longer meets the criteria for hedge accounting, any cumulative gain or loss existing in equity at that time remains in equity and is recognised when the forecast transaction is ultimately recognised in the income statement. When a forecast transaction is no longer expected Significant accounting policies continued ABC Holdings Limited ANNUAL REPORT 201158
  • 63.
    in the financialstatements and are classified and measured in accordance with the accounting policy on financial instru­ ments. Securities borrowed are not recognised in the financial statements unless these are sold to third parties. In these cases, the obligation to return the securities borrowed is recorded at fair value as a trading liability. Income and expenses arising from the securities borrowing and lending business are recognised on an accrual basis over the period of the transactions. Property and equipment Land and buildings are shown at fair value based on annual valuations by external independent valuers under hyper­infla­ tionary economies, otherwise at least once every three years. All other items of property and equipment are stated at cost less accumulated depreciation and impairment losses. Where parts of an item of property and equipment have different useful lives, they are accounted for as separate items of propertyandequipment.Surplusesanddeficitsarisingthereon are transferred to the property revaluation reserve in equity. The revaluation surplus or deficit is reversed when the asset is disposed of. Owner-occupied properties are held for use in the supply of services or for administrative purposes. Depreciation is charged to the income statement on a straight- line basis over the estimated useful life of the property and equipment. Land is not depreciated. The estimated useful lives are as follows: • Buildings 40 – 50 years • Bank premises and renovations 20 years • Computer equipment 3 – 5 years • Office equipment 3 – 5 years • Furniture and fittings 5 – 10 years • Vehicles 4 – 5 years The assets’ residual values, depreciation methods and useful lives are reviewed, and adjusted if appropriate, at each balance sheet date. Subsequent costs are included in the asset’s carrying amount or are recognised as a separate asset, as appropriate only when it is probable that future economic benefits associated with the item will flow to the Group. The cost of day-to-day servicing of property and equipment are recognised in the income statement as incurred. Derecognition of financial instruments Financial assets are derecognised when the contractual rights to receive cash flows from the financial assets have expired, or where the Group has transferred its contractual rights to receive cash flows on the financial asset such that it has transferred substantially all the risks and rewards of ownership of the financial asset. Any interest in transferred financial assets that is created or retained by the Group is recognised as a separate asset or liability. Financial liabilities are derecognised when they are extinguished, that is when the obligation is discharged, cancelled or expires. The Group enters into transactions whereby it transfers assets recog­ nised on its balance sheet, but retains either all risks and rewards of the transferred assets or a portion of them. If all or substantially all risks and rewards are retained, then the transferred assets are not derecognised from the balance sheet. Transfers of assets with retention of all or substantially all risks and rewards include securities lending and repurchase agreements. When assets are sold to a third party with a concurrent total rate of return swap on the transferred assets, the transaction is accounted for as a secured financing trans­ action similar to repurchase transactions. In transactions where the Group neither retains nor transfers substantially all the risks and rewards of ownership of a financial asset, it derecognises the asset if control over the asset is lost. The rights and obligations retained in the transfer are recognised separately as assets and liabilities as appropriate. In transfers where control over the asset is retained, the Group continues to recognise the asset to the extent of its continuing involve­ ment, determined by the extent to which it is exposed to changes in the value of the transferred asset. Repurchase agreements Securities sold subject to linked repurchase agreements (repos) are reclassified in the financial statements as pledged assets when the transferee has the right by contract or custom to sell or re-pledge the collateral. The liability to the counterparty is included under deposit and current accounts. Securities purchased under agreements to resell (reverse repos) are recorded as loans granted under resale agree­ ments and included under loans and advances to other banks or customers as appropriate. The difference between the sale and repurchase price is treated as interest and amortised over the life of the repurchase agreement using the effective interest method. Securities lent to counterparties are retained 59
  • 64.
    separately identifiable cashflows (cash generating units). Non-financial assets other than goodwill that suffered an impairment are reviewed for possible reversal of the impair­ ment at each reporting date. Financial liabilities Financial liabilities include deposits and other borrowed funds. Deposits and other borrowed funds are initially measured at fair value plus transaction costs and subsequently measured at their amortised cost, using the effective interest method. TheGroupderecognisesa financialliabilitywhenitscontractual obligations are discharged or cancelled or expire. Derivative financial instruments are dealt with in terms of specific policy specified above. Provisions and contingent liabilities Provisions are recognised when the Group has a present legal or constructive obligation as a result of past events and it is probable that an outflow of resources embodying economic benefits will be required to settle the obligation and a reliable estimate of the amount of the obligation can be made. Provisions are determined by discounting the expected future cash flows using a pre-tax discount rate that reflects current market assessments of the time value of money and, where appropriate, the risks specific to the liability. A provision for restructuring is recognised when the Group has approved a detailed formal plan, and the restruc­ turing either has commenced or has been announced publicly. Future operating costs or losses are not provided for. A provision for onerous contracts is recognised when the expected benefits to be derived by the Group from a contract are lower than the unavoidable cost of meeting its obligations under the contract. The provision is measured at the present value of the lower of the expected cost of terminating the contract and the expected net cost of continuing with the contract. Before a provision is established, the Group recog­ nises any impairment loss on the assets associated with that contract. Contingent liabilities, which include certain guaran­ tees other than financial guarantees, and letters of credit pledged as collateral security, are possible obligations that arise from past events whose existence will be confirmed only by the occurrence, or non-occurrence, of one or more uncertain future events not wholly within the Group’s control. Contingent liabilities are not recognised in the financial Investment property Investment properties are properties which are held by the Group either to earn rental income or for capital appreciation or for both. Investment property is stated at fair value determined annually by an independent registered valuer under hyper-inflationary economies, otherwise at least once every three years. Fair value is based on open market value and any gain or loss arising is recognised in the income statement. Fair value adjustments on investment properties are included in the income statement as investment gains or losses in the period in which these gains or losses arise and are adjusted for any double counting arising from the recog­ nition of lease income on the straight-line basis compared to the accrual basis normally assumed in the fair value deter­ mination. The deemed cost for any reclassification between investment properties and owner occupied properties is its fair value, at the date of reclassification. Other intangible assets Software Software acquired by the Group is stated at cost less accu­ mulated amortisation and accumulated impairment losses. Subsequent expenditure on computer software is capitalised onlywhenitincreasesthefutureeconomicbenefitsembodied in the specific asset to which it relates. Amortisation is recog­nised in the income statement on a straight-line basis over the estimated useful life of the software, from the date that it is available for use. The estimated useful life is three to five years. Amortisation methods, useful lives and residual values are reviewed at each financial year end and adjusted, if necessary. There have been no changes in the estimated useful lives from those applied in the previous financial year. Impairment of non-financial assets Assets that have an indefinite useful life are not subject to amortisation and are tested annually for impairment. Assets that are subject to amortisation are reviewed for impairment whenever events or changes in circumstances indicate that the carrying amount may not be recoverable. An impairment loss is recognised for the amount by which the asset’s carrying amount exceeds its recoverable amount. The recover­able amount is the higher of an asset’s fair value less costs to sell and value in use. For the purposes of assessing impairment, assets are grouped at the lowest levels for which there are Significant accounting policies continued ABC Holdings Limited ANNUAL REPORT 201160
  • 65.
    Operating income Income suchas revenue derived from service fees, net interest income, commissions, net surplus arising from trading activities and other income are included in operating income. Interest Interest income and interest expense are recognised in the income statement for all interest-bearing financial instruments on an accruals basis using the effective yield method except for those classified as held for trading based on the original settlement amount. The effective interest method is a method of calculating the amortised cost of a financial asset or a financial liability and of allocating the interest income or interest expense over the relevant period. The effective interest rate is the rate that exactly discounts estimated future cash payments or receipts through the expected life of the financial instrument or, when appropriate, a shorter period to the net carrying amount of the financial asset or financial liability. When calculating the effective interest rate, the Group estimates cash flows considering all contractual terms of the financial instrument (for example, prepayment options) but does not consider future credit losses. The calcu­ lation includes all fees and points paid or received between parties to the contract that are an integral part of the effective interest rate, transaction costs and all other premiums or discounts. Once a financial asset or a group of similar financial assets has been written down as a result of an impairment loss, interest income is recognised using the rate of interest used to discount the future cash flows for the purpose of measuring the impairment loss. Interest earned on accounts, which have been in arrears for three months or more is credited to an interest in suspense account. This interest is only recognised in the income statement when the account is no longer in arrears. Fee and commission income Fee and commission income arises from services provided by the Group, including cash management, project and struc­ tured trade finance transactions. Fee and commission income is recognised when the corresponding service is provided and receipt of the fee is certain. Loan commitment fees for loans that are not expected to be drawn down are recognised on a straight-line basis over the commitment period. statements but are disclosed in the notes to the financial statements. Managed funds and trust activities Certain companies in the Group operate unit trusts, hold and invest funds on behalf of clients and act as trustees and in other fiduciary capacities. Assets and liabilities representing such activities are not included on the balance sheet, as these relate directly to clients. Income from these activities is brought into account over the period to which the service relates. Share capital Preference share capital Preference share capital is classified as equity if it is non­ redeemable and any dividends are discretionary at the option of the directors. Preference share capital is classified as a liability if it is redeemable on a specific date or at the option of the shareholders and dividends thereon are recognised in the income statement as an interest expense. Repurchase of share capital Shares repurchased by Group companies are classified as treasury shares, and held at cost. These shares are treated as a deduction from the issued share capital and the cost price of the shares is presented as a deduction from total equity. Fair value changes recognised in the subsidiary’s financial statements on equity investments in the holding entity’s shares, are reversed on consolidation and dividends received are eliminated against dividends paid. Where such shares are subsequently sold or re-issued, any consideration received is included in shareholders’ equity. Dividends Dividends are recognised as a liability in the period in which they are declared. Share issue costs Incremental costs directly attributable to the issue of new shares or options or to the acquisition of a business are shown in equity as a deduction, net of tax, from the proceeds. 61
  • 66.
    the value ofthe lease amount receivable and accounted for over the lease term as an adjustment to the effective rate of return. The benefits arising from investment allowances on assets leased to clients are accounted for in tax. Leases of assets under which the lessor effectively retains all the risks and benefits of ownership are classified as operating leases. Receipts of operating leases from properties held as invest­ ment properties in investment management net of any incen­ tives given to lessees, are accounted for as rental income on the straight-line basis over the period of the lease. When an operating lease is terminated before the lease period has expired, any payment required by the lessee by way of penalty is recognised as income in the period in which termination takes place. Repossessed assets Repossessed assets are not brought on balance sheet until they are sold off to extinguish or reduce the outstanding debt. Employee benefits Defined contribution plans In terms of certain employment contracts, the Group provides for medical aid contributions to qualifying employees beyond the date of normal retirement. Although these benefits are a defined benefit plan, the full liability has not been recognised as the number of employees affected is very small. The contributions are recognised as an expense in the income statement as incurred. Termination benefits The Group recognises gratuity and other termination benefits in the financial statements when it has a present obligation relating to termination. Leave pay accrual The Group’s obligation in respect of accumulated leave days is recognised in full in the financial statements, on an undis­ counted basis and is expensed as the related services are provided. Taxation Income tax on the profit or loss for the year comprises current and deferred tax. Current tax is the expected tax payable on the taxable income for the year, using tax rates Net trading income Net trading income includes realised gains and losses arising from trading in financial assets and liabilities and unrealised changes in fair value of these instruments. Dividends Dividend income is recognised in the income statement on the date that the dividend is declared. Rental income Rental income from investment property is recognised in the income statement on a straight-line basis over the term of the lease. Lease incentives granted are recognised as an integral part of total rental income. Leases Group as lessee Leases where the Group assumes substantially all the risks and rewards of ownership are classified as finance leases. Finance leases are capitalised at the leases’ inception at the lower of the fair value of the leased asset and the present value of the minimum lease payments. Lease payments are separated using the interest rate implicit in the lease to identify the finance cost, which is charged against income overtheleaseperiod,andthecapitalrepayment,whichreduces the liability to the lessor. Leases of assets are classified as operating leases if the lessor effectively retains all the risks and rewards of ownership. Payments made under operating leases, net of any incentives received from the lessor are charged to the income statement on a straight-line basis over the period of the lease. When an operating lease is terminated before the lease period has expired, any payment required to be made to the lessor by way of penalty is recognised as an expense in the period in which termination takes place. Group as lessor Lease and instalment sale contracts are primarily financing transactions in banking activities, with rentals and instal­ments receivable, less unearned finance charges, being included in loans and advances on the balance sheet. Finance charges earned are computed using the effective interest method, which reflects a constant periodic return on the investment in the finance lease. Initial direct costs paid are capitalised to Significant accounting policies continued ABC Holdings Limited ANNUAL REPORT 201162
  • 67.
    reduced to theextent that it is no longer probable that the related tax benefit will be realised. Current and deferred tax relating to items that are charged or credited directly to equity, are also charged or credited directly to equity and are subsequently recognised in the income statement when the related deferred gain or loss is recognised. Segmental reporting Operating segments are reported in a manner consistent with the internal reporting provided to the chief operating decision maker. The chief operating decision maker is the person or group that allocates resources to and assesses the performance of the operating segments of an entity. The Group has determined the Group Executive Committee as its chief operating decision maker. All transactions between business segments are conducted on an arm´s length basis, with intra-segment revenue and costs being eliminated in head office. Income and expenses directly associated with each segment are included in determining business segment performance. In accordance with IFRS  8, the Group has the following business segments: Banking operations in Botswana, Mozambique, Tanzania, Zambia and Zimbabwe and non­-banking operations arising from ABCH and non- banking subsidiaries. enacted or substantively enacted at the balance sheet date, and any adjustment to tax payable in respect of previous years. Additional income taxes that arise from the distribution of dividend are recognised at the same time as the liability to pay the related dividend is recognised. Deferred tax is provided using the balance sheet liability method, providing for temporary differences between the carrying amounts of assets and liabilities for financial reporting purposes and the amounts used for taxation purposes. Deferred tax assets or liabilities are measured using tax rates enacted or substan­ tively enacted at the balance sheet date. Deferred tax is not recognised for the following temporary differences: • the initial recognition of goodwill; • the initial recognition of assets and liabilities, in a trans­ action that is not a business combination, which affects neither accounting nor taxable profits or losses; and • investments in subsidiaries and joint ventures (excluding mutual funds) where the Group controls the timing of the reversal of temporary differences and it is probable that these differences will not reverse in the foreseeable future. A deferred tax asset is recognised only to the extent that it is probable that future taxable profits will be available against which the asset can be utilised. Deferred tax assets are 63
  • 68.
    power to authorisecredit exposures. Each subsidiary has a credit committee which operates within the defined limits set by the Board. These committees are responsible for the management of credit risk within their country including, credit decisions, processes, legal and documentation risk and compliance with impairment policies. TheGroupRiskdepartmentregularlyreviewseachsubsidiary’s adherence to required standards. The Executive Committee reports to the Board and is respon­ sible for approval of credit decisions that are above country limits, recommendations on exposure limits and impairment policies. The Group has adopted standard impairment policies which at a minimum comply with the prudential guidelines of the respective countries’ central banks. Impairments are deter­ mined monthly at subsidiary level and are subject to regular review by Group Risk. Credit risk management Loans and advances In measuring credit risk of loans and advances to customers and to banks at a counterparty level, the Group considers three components: the probability of default by the client or counterparty on its contractual obligations; the current exposures to the counterparty and its likely future develop­ ment; and the likely recovery on the defaulted obligations. These credit risk measurements, which reflect expected loss, are embedded in the Group’s daily operational manage­ ment. The operational measurements are contrasted with impairment allowances required under IAS 39, which are based on losses that have been incurred at the balance sheet date. The Group assesses the probability of default of individual counterparties using internal rating tools tailored to the various categories of counterparties. They have been developed inter­nally and combine statistical analysis for certain cate­ gories, as well as credit officer judgement. Clients of the Group are segmented into five rating classes. The Group’s rating scale, which is shown below, reflects the range of default probabilities defined for each rating class. This means that, in principle, exposures migrate between classes as the assessment of their probability of default changes. The rating tools are kept under review and upgraded as necessary. The Group regularly validates the performance of the rating and their predictive power with regard to default events. financial risk management The Group’s activities exposes it to a variety of financial risks and those activities involve the analysis, evaluation, accept­ anceandmanagementofsomedegreeofriskoracombination of risks. Taking risk is core to the financial business, and the operational risks are an inevitable consequence of being in business. The Group’s aim is therefore to achieve an appro­ priate balance between risk and return and minimise potential adverse effects on the Group’s financial performance. The Group’s risk management policies are designed to identify and analyse these risks, to set appropriate risk limits and controls, and to monitor the risks and adherence to limits by means of reliable and up-to-date information systems. The Group regularly reviews its risk management policies and systemstoreflectchangesinmarkets,productsandemerging best practice. Risk management is carried out by Group Risk, under policies approved by the Board of Directors. The Board approves principles for overall risk management as well as policies covering specific areas, such as foreign exchange risk, interest rate risk, credit risk, use of derivative financial instruments and non-derivative financial instruments. In addition, internal audit is responsible for the independent review of risk man­ age­ment and the control environment. The most important types of risk are credit risk, liquidity risk, market risk and operational risk. Market risk includes currency risk, interest rate and price risk. Credit risk The Group takes on exposure to credit risk, which is the risk that a counterparty will cause a financial loss for the Group by failing to discharge an obligation. Significant changes in the economy, or in the health of a particular industry segment that represents a concentration in the Group’s portfolio, could result in losses that are different from those provided for at the balance sheet date. Country (or Sovereign) risk is part of overall credit risk and is managed as part of the credit risk management function as it has a major impact on indi­vidual counterparties’ ability to perform. Management there­fore carefully manages its exposure to credit risk. Credit exposures arise principally in loans and advances, debt secu­ rities and other bills. There is also credit risk in off-balance sheet financial arrangements such as loan commitments. The Group Risk team reviews subsidiary risk exposures regularly, and reports to the Board of Directors. The Board has defined and documented a credit policy for the Group which forms the basis of credit decisions. This policy includes a framework of limits and delegation of credit approval authority that are strictly adhered to; refer to “Risk and Governance” – page 28. No one individual has the ABC Holdings Limited ANNUAL REPORT 201164
  • 69.
    Risk limit controland mitigation policies The Group manages, limits and controls concentrations of credit risk in respect of individual counterparties and groups, and to industries and countries. The Group structures the levels of credit risk it undertakes by placing limits on the amount of risk accepted in relation to one borrower, or groups of borrowers, and to geographical and industry segments. Such risks are monitored on a revolving basis and subject to an annual or more frequent review, when considered necessary. Limits on the level of credit risk by product, industry sector and by country are approved by the Board of Directors, and reviewed regularly. Exposure to credit risk is also managed through regular analysis of the ability of borrowers and potential borrowers to meet interest and capital repayment obligations and by changing these lending limits where appropriate. Some other specific control and mitigation measures are outlined below. (a) Collateral The Group employs a range of policies and practices to mitigate credit risk. The most traditional of these is the taking of security for funds advanced, which is common practice. The Group implements guidelines on the acceptability of specific classes of collateral for credit risk mitigation. The principal collateral types for loans and advances are: • cash collateral; • charges over assets financed; • mortgages over residential and commercial properties; Group’s internal rating scale Category Description Performing The credit appears satisfactory Special mention The credit appears satisfactory but exhibits potential or inherent weaknesses which, if not attended to, may weaken the asset or prospects of collection in full e.g. poor documentation or 30 days but less than 90 days in arrears Sub-standard The credit has defined weaknesses that may jeopardise liquidation of the debt i.e the paying capacity of the borrower is doubtful or inadequate, or more than 90 days but less than 180 days in arrears Doubtful Credit facilities with above weaknesses and has deteriorated further to the extent that even with the existing security, full recovery will not be possible, or 180 days but less than 12 months in arrears Loss Facilities considered impossible to collect with little or no realisable security, or more than 12 months in arrears • charges over business assets such as premises, inventory and accounts receivable; and • charges over financial instruments such as debt securities and equities. Loans and advances to corporates are generally secured. In addition, in order to minimise credit loss, the Group will seek additional collateral from the counterparty as soon as impair­ ment indicators are noticed for the relevant individual loans and advances. Collateral held as security for financial assets other than loans and advances is determined by the nature of the instrument. Debt securities, treasury and other eligible bills are generally unsecured, with the exception of asset- backed securities and similar instruments, which are secured by portfolios of financial instruments. (b) Master netting arrangements The Group further restricts its exposure to credit losses by entering into master netting arrangements with counter­ parties with which it undertakes a significant volume of transactions. Master netting arrangements do not generally result in an offset of balance sheet assets and liabilities, as transactions are usually settled on a gross basis. However, the credit risk associated with favourable contracts is reduced by a master netting arrangement to the extent that if a default occurs, all amounts with the counterparty are terminated and settled on a net basis. The Group’s overall exposure to credit risk on derivative instruments subject to master netting arrangements can change substantially within a short period, asitisaffectedbyeachtransactionsubjecttothearrangement. 65
  • 70.
    Financial risk managementcontinued (d) Derivatives The Group maintains strict control limits on net open derivative positions (that is, the difference between purchase and sale contracts) by both amount and term. The amount subject to credit risk is limited to expected future net cash inflows of instruments, which in relation to derivatives are only a fraction of the contract, or notional values used to express the volume of instruments outstanding. This credit risk exposure is managed as part of the overall lending limits with customers, together with potential exposures from market movements. Collateral or other security is not always obtained for credit risk exposures on these instruments, except where the Group requires margin deposits from counter­parties. Impairment policies The impairments shown in the balance sheet at year-end are derived from each of the five internal rating grades, adjusted for the provision of IAS 39. The table below shows the percentage of the Group’s on-and-off balance sheet items relating to loans and advances and the associated impairment for each of the Group’s internal rating categories. (c) Credit-related commitments The primary purpose of these instruments is to ensure that funds are available to a customer as required. Guarantees and standby letters of credit carry the same credit risk as loans. Documentary and commercial letters of credit – which are written undertakings by the Group on behalf of a customer authorising a third party to draw drafts on the Group up to a stipulated amount under specific terms and conditions – are collateralised by the underlying shipments of goods to which they relate and therefore carry less risk than a direct loan. Commitments to extend credit represent unused portions of authorisations to extend credit in the form of loans, guarantees or letters of credit. With respect to credit risk on commitments to extend credit, the Group is potentially exposed to loss in an amount equal to the total unused commitments. However, the likely amount of loss is less than the total unused commitments, as most commitments to extend credit are contingent upon customers maintaining specific credit standards. The Group monitors the term to  maturity of credit commitments because longer-term commitments generally have a greater degree of credit risk than shorter-term commitments. Impairments classification 2011 2010 Category Loans and advances (%) Impairments (%) Loans and advances (%) Impairments (%) Performing 87% 17% 86% 19% Special mention 6% 8% 6% 8% Sub-standard 4% 15% 3% 6% Doubtful 1% 7% 1% 12% Loss 2% 53% 4% 55% 100% 100% 100% 100% Impairments are managed on an expected loss basis, and are recorded on an actual loss basis. The internal rating tool assists management to determine whether objective evidence of impairment exists under IAS 39, based on the following criteria set out by the Group: • delinquency in contractual payments of principal or interest; • cash flow difficulties experienced by the borrower; • breach of loan covenants or conditions; • initiation of bankruptcy proceedings; • deterioration of the borrower’s competitive position; • deterioration in the value of collateral; and • downgrading below “Performing” level. ABC Holdings Limited ANNUAL REPORT 201166
  • 71.
    Maximum exposure tocredit risk before collateral held or other credit enhancements The following table presents the maximum exposure to credit risk of balance sheet and off-balance sheet financial instruments, before taking into account any collateral held or othercreditenhancementsunlesssuchcreditenhancements meet offsetting requirements. For financial assets recognised on the balance sheet, the exposure to credit risk equals their carrying amount before deducting impairments. For financial guarantees granted, the maximum exposure to credit risk is the maximum amount that ABC Holdings Limited would have to pay if the guarantees are called upon. For loan com­ mit­ments and other credit related commitments that are irrevocableoverthelifeoftherespectivefacilities,themaximum exposure to credit risk is the full amount of the committed facilities. Investment in associates and listed equities have been excluded as they are regarded as primarily exposing the Group to market risk. The Group’s policy requires the review of individual financial assets at least once a month, or more regularly when individual circumstances require. Impairment allowances on individually assessed accounts are determined by an evaluation of the incurred loss at balance-sheet date on a case-by-case basis, and are applied to all individually significantaccounts.Theassessmentnormallyencompasses collateral held (including re-confirmation of its enforceability) and the anticipated receipts for that individual account. Collectively assessed impairment allowances are provided for: (i) portfolios of homogenous assets that are individually below materiality thresholds; and (ii) losses that have been incurredbuthavenotyetbeenidentified,byusingtheavailable historical experience, experienced judgement and statistical techniques. Credit risk exposures relating to on-balance sheet assets are as follows: BWP‘000s 2011 2010 Placements with other banks 1,114,126 924,561 Derivative financial assets 32,337 42,012 Financial assets held for trading 651,049 1,117,827 –  Government bonds 52,747 102,766 –  Corporate bonds 26,709 5,677 –  Treasury bills 571,593 1,007,913 –  Bankers acceptances and commercial paper – 1,471 185,412 75,034 Financial assets designated at fair value 185,412 75,034 Loans and advances to customers at amortised cost 6,294,959 3,216,575 –  Mortgage lending 65,201 14,659 –  Instalment finance 331,826 320,602 –  Corporate lending 4,440,053 2,567,327 –  Commercial and property finance 169,531 45,151 –  Micro-finance lending 354,374 135,870 –  Consumer lending 933,974 132,966 Investment securities 42,172 38,502 –  Promissory notes 42,172 38,502 Prepayments and receivables 172,000 188,306 Current tax assets 8,458 6,388 8,500,513 5,609,205 Contingent liabilities Credit exposures relating to off-balance sheet items are as follows: Guarantees 337,516 210,146 Loan commitments and other credit related facilities 95,387 129,805 432,903 339,951 67
  • 72.
    74% (2010: 57%)of the total maximum exposure is derived from loans and advances, while 8% (2010: 20%) represents financial assets held for trading. Management is confident in its ability to continue to control and sustain minimal exposure of credit risk to the Group resulting from both its loans and advances portfolio and financial assets held for trading based on the following: • 93% (2010: 92%) of the gross loans and advances portfolio is categorised in the top two grades of the internal rating system; • 87% (2010: 86%) of the gross loans and advances portfolio is considered to be “neither past due nor impaired”; • 7% (2010: 8%) of gross loans and advances are “individually impaired”; • the Group continues to improve its credit selection and monitoring processes; and • loans and advances to corporates are generally backed by collateral. Nature of security held The nature of security held ranges from cash security, assets financed, bonds over residential and commercial property, shares and stock in trade. Credit quality Loans and advances The following tables reflect broadly, stable credit quality across the majority of the Group’s businesses. Distribution of loans and advances by credit quality: BWP‘000s 2011 2010 Neither past due nor impaired 5,472,461 2,765,645 Past due but not impaired 404,327 182,600 Individually impaired 418,171 268,330 Gross loans and advances 6,294,959 3,216,575 Less: Allowance for impairment (217,560) (138,465) Net loans and advances 6,077,399 3,078,110 The total impairment of loans and advances is BWP217.6 million (2010: BWP138.5 million). Further information on the impairment allowance for loans and advances to customers is provided in Notes 2 and 10. During the year ended 31 December 2011, the Group’s total gross loans and advances increased by 95% (2010: increased by 51%), attributable to improved economic activity in the markets the Group operates in. Loans and advances to the corporate sector continue to form the bulk of the Group’s lending portfolio, but consumer and micro-finance lending also grew strongly as the Group continues to expand in the Retail market segment. Financial risk management continued ABC Holdings Limited ANNUAL REPORT 201168
  • 73.
    (a) Distribution ofloans and advances neither past due nor impaired The credit quality of the portfolio of loans and advances that were neither past due nor impaired can be assessed by reference to the internal rating system adopted below: Internal Grade: Performing BWP’000s 2011 2010 Mortgage lending 56,973 14,659 Instalment finance 266,236 283,447 Corporate lending 3,791,223 2,192,573 Commercial and property finance 150,220 45,151 Micro-finance lending 354,374 103,231 Consumer lending 853,435 126,584 5,472,461 2,765,645 (b) Loans and advances past due but not impaired: age analysis Internal Grade: Special mention Late processing and other administrative delays on the side of the borrower can lead to a financial asset being past due but not impaired. Therefore, loans and advances less than 90 days past due are not usually considered impaired, unless other information is available to indicate the contrary. Gross amount of loans and advances by class to customers that were past due but not impaired were as follows: 2011 BWP’000s Days past due 1 – 30 days 31 – 60 days 61 – 90 days Total Internal Grade: Special mention Mortgage lending 3,095 3,047 – 6,142 Instalment finance 15,378 10,601 340 26,319 Corporate lending 140,865 143,776 49,682 334,323 Commercial and property finance 5,118 – – 5,118 Consumer lending 27,796 1,546 3,083 32,425 192,252 158,970 53,105 404,327 2010 BWP’000s Days past due 1 – 30 days 31 – 60 days 61 – 90 days Total Internal Grade: Special mention Instalment finance 439 697 3,379 4,515 Corporate lending 27,492 113,864 12,396 153,752 Micro-finance lending 24,333 – – 24,333 52,264 114,561 15,775 182,600 Upon initial recognition of loans and advances, the fair value of collateral is based on valuation techniques commonly used for the corresponding assets. In subsequent periods, the fair value is updated by reference to market price or indexes of similar assets. Collateral taken for this category includes cash, mortgages over residential properties, charges over business assets such as premises, inventory and accounts receivable, and charges over financial instruments such as debt securities and equities. All micro-finance lending past due in 2011 was categorised as “individually impaired” advances. 69
  • 74.
    (c) Loans andadvances individually impaired The individually impaired loans and advances before taking into consideration the cash flows from collateral held is BWP418.2 million (2010: BWP268.3 million). The breakdown of the gross amount of individually impaired loans and advances by class, along with the fair value of related collateral held by the Group as security, is as follows: 2011 2010 BWP’000s Gross loans Fair value collateral Under- collateral- isation* Gross loans Fair value collateral Under- collateral- isation* Mortgage lending 2,086 2,086 – – – – Instalment finance 39,271 17,890 21,381 32,640 8,458 24,182 Corporate lending 314,507 134,440 180,067 221,003 128,457 92,546 Micro-finance lending – – – 8,305 – 8,305 Commercial and property finance 14,193 14,193 – – – – Consumer lending 48,114 – 48,114 6,382 253 6,129 418,171 168,609 268,330 137,168 * The under-collateralisation amount is considered for impairment. It includes an exposure in the ABC Holdings Company stand-alone financial statements of BWP91.6 million. The exposure is meeting the terms of a repayment plan agreed to subsequent to the financial year-end. Interest of BWP28.2 million was not recognised on this exposure during the financial year. This interest amount is not recoverable in terms of the repayment plan. Collateral taken for this category includes cash, mortgages over residential properties, charges over business assets such as premises, inventory and accounts receivable, and charges over financial instruments such as debt securities and equities. (d) Loans and advances renegotiated Restructuring activities include extended payment arrangements, approved external management plans, modification and deferral of payments. Following restructuring, a previously overdue customer account is reset to a normal status, and managed together with other similar accounts. Restructuring policies and practices are based on indicators or criteria which, in the judgement of local management, indicate that payment will most likely continue. These policies are kept under continuous review. Renegotiated loans totalled BWP27.2 million at 31 December 2011 (2010: BWP179.2 million). BWP’000s 2011 2010 Mortgage lending 942 – Corporate lending 24,941 179,189 Consumer lending 1,324 – 27,207 179,189 Repossessed collateral During 2011, the Group obtained assets by taking possession of collateral held as security, as follows: Nature of assets 2011 2010 Property – 2,655 Cash security – 1,005 Motor vehicles 50 589 Carrying amount 50 4,249 Repossessed properties are sold as soon as practical, with the proceeds used to reduce the outstanding indebtedness. Repossessed property is classified in the balance sheet under prepayments and other receivables. Financial risk management continued ABC Holdings Limited ANNUAL REPORT 201170
  • 75.
    Other classes offinancial assets All other classes of financial assets are allocated the internal grade “performing” and are neither past due nor impaired. These classes of financial assets are subjected to the same credit processes as loans and advances. Concentration risk of financial assets with credit risk exposure (a) Geographical sectors The following table breaks down the Group’s main credit exposure at their carrying amounts, as categorised by geographical regions as of 31 December 2011. For this table, the Group has allocated exposures to regions based on the country of domicile of its counterparties. 2011 BWP’000s Botswana Mozam- bique Tanzania Zambia Zimbabwe Other Total Placements with other banks 286,932 198,364 235,938 167,552 114,457 110,883 1,114,126 Financial assets held for trading 418,406 119,904 49,073 36,957 26,709 – 651,049 Financial assets designated at fair value – – – – 110,421 74,991 185,412 Derivative financial assets 1,230 135 4,710 63 2 26,197 32,337 Loans and advances (net of impairments) 1,410,762 761,938 582,758 603,581 2,684,717 33,643 6,077,399 Investment securities 42,172 – – – – – 42,172 Prepayments and other receivables 3,868 4,467 15,286 10,166 134,835 3,378 172,000 Current tax asset – – 8,458 – – – 8,458 2,163,370 1,084,808 896,223 818,319 3,071,141 249,092 8,282,953 2010 BWP’000s Botswana Mozam- bique Tanzania Zambia Zimbabwe Other Total Placements with other banks 236,194 121,738 123,241 87,918 329,903 25,567 924,561 Financial assets held for trading 884,934 77,897 126,693 20,328 7,975 – 1,117,827 Financial assets designated at fair value – – – – 75,034 – 75,034 Derivative financial assets 4,683 13,811 4,054 – – 19,464 42,012 Loans and advances (net of impairments) 636,601 401,713 436,332 232,721 1,365,069 5,674 3,078,110 Investment securities 38,502 – – – – – 38,502 Prepayments and other receivables 6,084 16,417 21,924 15,033 122,811 6,037 188,306 Current tax asset 751 1,564 733 3,340 – – 6,388 1,807,749 633,140 712,977 359,340 1,900,792 56,742 5,470,740 71
  • 76.
    Market risk The Grouptakes on exposure to market risks, which is the risk that the fair value of future cash flows of a financial instrument will fluctuate because of changes in market prices. Market risks arise from open positions in interest rate, currency and equity products, all of which are exposed to general and specific market movements and changes in the level of volatility of market rates or prices such as interest rate, credit spreads, foreign exchange rates and equity prices. Market and foreign currency exposures related to dealing positions are housed and managed in the Treasury division within a framework of pre-approved dealer, currency and counterparty limits. All trading positions are marked to market as required by IAS 39. Group Risk is responsible for monitoring of limits and pricing, thereby ensuring that any errors or unauthorised transactions are promptly identified. The currency exposure that arises as a result of the Group’s continuing expansion and cross-border investment activities is managed through the Executive Committee and the Group Asset and Liability Committee. The following table breaks down the Group’s main credit exposure at their carrying amounts, as categorised by the industry sectors of the counterparties. 2011 BWP‘000s Agriculture Construction Wholesale, retail and trade Public sector Manufacturing Placements with other banks – – – – – Financial assets held for trading – 7,692 1,547 49,073 – Financial assets designated at fair value 77,125 – – – 14,390 Derivative financial assets – – 135 – – Loans and advances 520,430 349,656 1,137,253 130,781 574,760 Investment securities – – – – – Prepayments and other receivables – – 17,209 – – Current tax assets – – – 8,458 – 597,555 357,348 1,156,144 188,312 589,150 2010 BWP‘000s Agriculture Construction Wholesale, retail and trade Public Sector Manufacturing Placements with other banks – – – – – Financial assets held for trading – – – 126,693 – Financial assets designated at fair value 64,028 – – – 11,006 Derivative financial assets – – – – – Loans and advances 449,675 197,389 339,496 135,849 359,806 Investment securities – – – – – Prepayments and other receivables – 3,224 671 – – Current tax assets – – – – – 513,703 200,613 340,167 262,542 370,812 Financial risk management continued ABC Holdings Limited ANNUAL REPORT 201172
  • 77.
    Mining Financial services Transport energy IndividualsTourism Other Total – 1,114,126 – – – – 1,114,126 – 575,267 – – – 17,470 651,049 – 93,897 – – – – 185,412 – 32,202 – – – – 32,337 842,833 516,236 292,734 1,256,703 94,851 361,162 6,077,399 – 42,172 – – – – 42,172 – 116,803 – – – 37,988 172,000 – – – – – – 8,458 842,833 2,490,703 292,734 1,256,703 94,851 416,620 8,282,953 Mining Financial Services Transport energy Individuals Tourism Other Total – 924,561 – – – – 924,561 – 983,159 – – – 7,975 1,117,827 – – – – – – 75,034 – 42,012 – – – – 42,012 539,434 301,227 157,084 259,716 62,260 276,174 3,078,110 – 38,502 – – – – 38,502 4,462 121,460 – – – 58,489 188,306 – – – – – 6,388 6,388 543,896 2,410,921 157,084 259,716 62,260 349,026 5,470,740 Market risk measurement techniques The major measurement techniques used to measure and control market risk are outlined below. Foreign exchange risk The Group takes on exposure to the effects of fluctuations in the prevailing foreign currency exchange rates on its financial position and cash flows. Group Risk sets limits on the level of exposure by currency and in aggregate for both overnight and intra-day positions, which are monitored daily. The table below summarises the Group’s exposure to foreign currency exchange rate risk at 31 December 2011. Included in the table are the Group’s assets and liabilities at carrying amounts, categorised by currency. 73
  • 78.
    Concentration of currencyrisk: On-and-off balance sheet financial instruments At 31 December 2011 BWP’000s EUR USD BWP ZAR Cash and short-term funds 47,371 533,626 302,208 54,662 Financial assets held for trading 451 27,588 418,406 – Financial assets designated at fair value – 185,412 – – Derivative financial asset* – 4,594 6,091 1,327 Loans and advances 21,228 3,292,744 1,465,953 2,077 Investment securities – 9,266 42,172 – Prepayments and other receivables 1,527 150,478 1,986 1,277 Current tax asset – – – – Investment in associates – 4,472 11,275 – Property and equipment – 219,737 134,475 33,022 Investment property – 2,021 – – Intangible assets – 16,164 52,252 9 Deferred tax asset – 25,255 15,064 444 70,577 4,471,357 2,449,882 92,818 Deposits 70,909 3,216,730 2,255,519 50,026 Derivative financial liabilities* – 151,959 – – Creditors and accruals 100 61,549 24,746 10,813 Current tax liabilities – 17,250 5,322 – Deferred tax liabilities – 443 4,485 – Borrowed funds 4,942 573,220 275,540 – 75,951 4,021,151 2,565,612 60,839 Net on-balance sheet position (5,374) 525,336 (190,860) 31,979 Credit commitments 52,995 272,999 36,742 57,955 * Notional amounts have been reported in the currency columns and adjustments made in “Other” to arrive at the fair values. At 31 December 2010 BWP’000s EUR USD BWP ZAR Cash and short-term funds 51,299 566,303 153,555 32,363 Financial assets held for trading 402 7,573 884,934 – Financial assets designated at fair value – 79,139 – – Derivative financial asset* 26,375 129,202 19,283 55,224 Loans and advances 17,201 1,798,021 677,144 7,335 Investment securities – 5,576 38,502 – Prepayments and other receivables 5 136,290 2,463 415 Current tax asset – – 751 – Investment in associates – 16,551 15,370 – Property and equipment 242 111,338 116,860 37,241 Investment property – 3,878 – – Intangible assets – – 45,857 – Deferred tax asset – 15,618 (2,248) 468 95,524 2,869,489 1,952,471 133,046 Deposits 153,242 1,990,750 1,653,411 94,425 Derivative financial liabilities* 1,064 255,621 29,036 7,715 Creditors and accruals 91 25,656 11,763 6,919 Current tax liabilities – 15,846 (11,599) – Deferred tax liabilities – 5,678 6,622 – Borrowed funds 12,347 167,455 277,936 – 166,744 2,461,006 1,967,169 109,059 Net on-balance sheet position (71,220) 408,483 (14,698) 23,987 Credit commitments 24,853 17,535 31,182 60,405 * Notional amounts have been reported in the currency columns and adjustments made in “Other” to arrive at the fair values. Financial risk management continued ABC Holdings Limited ANNUAL REPORT 201174
  • 79.
    TZS ZMK MZNJPY Other Total 117,438 35,486 131,153 12,859 8,628 1,243,431 47,742 36,957 119,905 – – 651,049 – – – – – 185,412 – – 216 125,214 (105,105) 32,337 249,866 363,753 573,533 – 108,245 6,077,399 31,314 1,363 – – 2,059 86,174 6,376 4,424 1,793 – 4,139 172,000 – – – – 8,458 8,458 1,792 – – – – 17,539 23,859 34,796 68,991 – – 514,880 – – – – – 2,021 19,518 6,376 36,043 – – 130,362 6,200 15,863 – – – 62,826 504,105 499,018 931,634 138,073 26,424 9,183,888 583,897 358,311 789,209 14,013 36,086 7,374,700 – – 216 – (105,106) 47,069 7,442 11,321 10,266 – 4,190 130,427 – 1,612 3,433 – – 27,617 1,756 – 3,036 – – 9,720 742 – – 125,212 2,132 981,788 593,837 371,244 806,160 139,225 (62,698) 8,571,321 (89,732) 127,774 125,474 (1,152) 89,122 612,567 12,212 – – – – 432,903 TZS ZMK MZN JPY Other Total 86,179 8,921 78,530 13,149 9,039 999,338 126,693 20,328 77,897 – – 1,117,827 – – – – – 79,139 139,493 15,837 – 19,628 (363,030) 42,012 203,471 107,377 267,504 – 57 3,078,110 8,592 353 – – – 53,023 17,300 16,707 15,126 – – 188,306 733 3,339 1,565 – – 6,388 2,924 – – – – 34,845 13,971 9,987 40,579 – – 330,218 – – – – – 3,878 1,535 2,313 7,697 – – 57,402 2,890 4,225 – – – 20,953 603,781 189,387 488,898 32,777 (353,934) 6,011,439 384,341 174,286 437,463 11,281 7,846 4,907,045 53,426 4,841 13,023 2 (363,681) 1,047 4,629 6,195 – – 8,764 64,017 1,154 1,418 – – – 6,819 – – 2,933 – – 15,233 602 – – 121,080 – 579,420 444,152 186,740 453,419 132,363 (347,071) 5,573,581 159,629 2,647 35,479 (99,586) (6,863) 437,858 91,816 31,274 43,064 1,659 38,163 339,951 75
  • 80.
    Interest rate risk Cashflow interest rate risk is the risk that the future cash flows of a financial instrument will fluctuate because of changes in market interest rates. Fair value interest rate risk is the risk that the value of a financial instrument will fluctuate because of changes in market interest rates. The Group takes on exposure to the effects of fluctuations in the prevailing levels of market interest rates on both its fair value and cash flow risks. Interest margins may increase as a result of such changes but may reduce losses in the event that unexpected movements arise. The Asset and Liability Committee (ALCO) is responsible for managing interest rate and liquidity risk in the Group. Asset and Liability management committees have been established in each subsidiary and meet on a monthly basis. They operate within the prudential guidelines and policies established by Group ALCO. In order to reduce interest rate risk, the majority of the Group’s lending is on a variable interest rate with a term of less than one year. This approach has been adopted as a result of the scarcity of term deposits in the region that limits the Group’s ability to build a substantial, stable pool of fixed rate funding. The table below summarises the Group’s exposure to interest rate risks. It includes the Group’s financial instruments at carrying amounts, categorised by the earlier of contractual re-pricing or maturity dates. Variable rate financial instruments are categorised in the “up to 1 month” column. 2011 BWP’000s Up to 1 month 1 – 3 months 3 – 12 months 1 – 5 years Total interest sensitive Non- interest bearing Total Cash and short-term funds 506,658 184,439 – – 691,097 552,334 1,243,431 Financial assets held for trading 79,971 405,150 98,857 48,054 632,032 19,017 651,049 Financial assets designated at fair value 16,635 – – 149,869 166,504 18,908 185,412 Derivative financial assets – – – – – 32,337 32,337 Loans and advances 3,350,971 374,551 1,078,255 1,273,622 6,077,399 – 6,077,399 Investment securities – – – 43,599 43,599 42,575 86,174 Prepayments and other receivables – – – – – 172,000 172,000 Current tax asset – – – – – 8,458 8,458 Investment in associates – – – – – 17,539 17,539 Property and equipment – – – – – 514,880 514,880 Investment property – – – – – 2,021 2,021 Intangible assets – – – – – 130,362 130,362 Deferred tax asset – – – – – 62,826 62,826 Assets 3,954,235 964,140 1,177,112 1,515,144 7,610,631 1,573,257 9,183,888 Equity – – – – – 612,567 612,567 Deposits 4,781,494 1,677,412 857,957 301 7,317,164 57,536 7,374,700 Derivative financial liabilities – – – – – 47,069 47,069 Creditors and accruals – – – – – 130,427 130,427 Current tax liabilities – – – – – 27,617 27,617 Deferred tax liability – – – – – 9,720 9,720 Borrowed funds 24,262 228,704 222,818 506,004 981,788 – 981,788 Liabilities 4,805,756 1,906,116 1,080,775 506,305 8,298,952 272,369 8,571,321 Total interest repricing gap (851,521) (941,976) 96,337 1,008,839 (688,321) 688,321 – Financial risk management continued ABC Holdings Limited ANNUAL REPORT 201176
  • 81.
    2010 BWP’000s Up to 1 month 1– 3 months 3 – 12 months 1 – 5 years Total interest sensitive Non- interest bearing Total Cash and short-term funds 357,223 37,460 13,938 – 408,621 590,717 999,338 Financial assets held for trading 378,344 602,713 28,973 99,822 1,109,852 7,975 1,117,827 Financial assets designated at fair value – – – 64,028 64,028 15,111 79,139 Derivative financial assets – – – – – 42,012 42,012 Loans and advances 1,649,168 501,197 439,560 488,185 3,078,110 – 3,078,110 Investment securities – – – 38,502 38,502 14,521 53,023 Prepayments and other receivables – – – – – 188,306 188,306 Current tax asset – – – – – 6,388 6,388 Investment in associates – – – – – 34,845 34,845 Property and equipment – – – – – 330,218 330,218 Investment property – – – – – 3,878 3,878 Intangible assets – – – – – 57,402 57,402 Deferred tax asset – – – – – 20,953 20,953 Assets 2,384,735 1,141,370 482,471 690,537 4,699,113 1,312,326 6,011,439 Equity – – – – – 437,858 437,858 Deposits 2,719,674 1,535,951 627,545 23,875 4,907,045 – 4,907,045 Derivative financial liabilities – – – – – 1,047 1,047 Creditors and accruals – – – – – 64,017 64,017 Current tax liabilities – – – – – 6,819 6,819 Deferred tax liability – – – – – 15,233 15,233 Borrowed funds 20,607 96,721 4,331 457,761 579,420 – 579,420 Liabilities 2,740,281 1,632,672 631,876 481,636 5,486,465 87,116 5,573,581 Total interest repricing gap (355,546) (491,302) (149,405) 208,901 (787,352) 787,352 – 77
  • 82.
    The tables belowillustrates the impact of a possible 50 basis points interest rate movement for each banking subsidiary: 2011 2010 BWP’000s Pre-tax Post-tax Pre-tax Post-tax BancABC Botswana ABC Botswana constituted 28% of the Group’s total assets. Change in net interest income (+50 basis points) 761 593 278 209 As a percentage of total Shareholders equity 0.47% 0.36% 0.26% 0.20% Change in net interest income (-50 basis points) (761) (593) (278) (209) As a percentage of total Shareholders equity -0.47% -0.36% -0.26% -0.20% BancABC Zambia ABC Zambia constituted 10% of the Group’s total assets. Change in net interest income (+50 basis points) 322 193 65 39 As a percentage of total Shareholders equity 0.45% 0.27% 0.00% 0.00% Change in net interest income (-50 basis points) (322) (193) (65) (39) As a percentage of total Shareholders equity -0.45% -0.27% 0.00% 0.00% BancABC Mozambique ABC Mozambique constituted 13% of the Group’s total assets Change in net interest income (+50 basis points) (66) (45) 296 201 As a percentage of total Shareholders equity -0.04% -0.03% 0.22% 0.17% Change in net interest income (-50 basis points) 66 45 (296) (201) As a percentage of total Shareholders equity 0.04% 0.03% 0.22% -0.17% BancABC Tanzania ABC Tanzania constituted 10% of the Group’s total assets Change in net interest income (+50 basis points) 592 414 1,411 988 As a percentage of total Shareholders equity 0.60% 0.42% 1.45% 1.01% Change in net interest income (-50 basis points) (592) (414) (1,411) (988) As a percentage of total Shareholders equity -0.60% -0.42% -1.45% -1.01% BancABC Zimbabwe ABC Zimbabwe constituted 29% of the Group’s total assets Change in net interest income (+50 basis points) -797 -591 3,108 2,308 As a percentage of total Shareholders equity -0.28% -0.21% 1.13% 0.88% Change in net interest income (-50 basis points) 797 591 (3,108) (2,308) As a percentage of total Shareholders equity 0.28% 0.21% -1.13% -0.88% The interest rate sensitivity analyses set out in the table above are illustrative only and are based on simplified scenarios over a period of one year. Sensitivity analysis of market price The Group holds, directly or through its associates, listed equities with a fair value of BWP33.3 million (2010: BWP17.4 million). The Group is therefore exposed to gains or losses related to the variability in the market prices of the equities held. Liquidity risk Liquidity risk is the risk that the Group is unable to meet its obligations when they fall due as a result of customer deposits being withdrawn, cash requirements from contractual commitments, or other cash outflows, such as debt maturities or margin call for derivatives. Such outflows would deplete available cash resources for client lending, trading activities and investments. In extreme circumstances, lack of liquidity could result in reductions in the consolidated statement of financial position and sales of assets, or potentially an inability to fulfil lending commitments. The risk that the Group will be unable to do so is inherent in all banking operations and can be affected by a range of institution-specific and market-wide events including, but not limited to, credit events, merger and acquisition activity, systemic shocks and natural disasters. Financial risk management continued ABC Holdings Limited ANNUAL REPORT 201178
  • 83.
    Liquidity risk managementprocess The Group holds liquidity reserves in highly tradable instruments or money market placements which are immediately available if required. Liquidity is assessed by currency as well as by time bracket. Group liquidity management is dependent upon accurate cash flow projections and the monitoring of its future funding requirements. The Group’s liquidity management process is monitored by Group Treasury and includes: Day-to-day funding, managed by monitoring future cash flows to ensure that requirements can be met. This includes replenishment of funds as they mature or are borrowed by customers. The Group maintains an active presence in global money markets to enable this to happen; • maintaining a portfolio of highly marketable assets that can easily be liquidated as protection against any unforseen interruption to cash flow; • monitoring balance sheet liquidity ratios against internal and regulatory requirements; and • managing the concentration and profile of debt maturities. Monitoring and reporting take the form of cash flow measurement and projections for the next day, week and month respectively, as these are key periods for liquidity management. The starting point for those projections is an analysis of the contractual maturity of the financial liabilities and the expected collection date of the financial assets. Group Treasury also monitors unmatched medium-term assets, the level and type of undrawn lending commitments, the usage of overdraft facilities and the impact of contingent liabilities such as standby letters of credit and guarantees. The Group’s maturity analysis (on a discounted cash flow basis) as at 31 December 2011 was as follows: 2011 BWP’000s Up to 1 month 1 – 3 months 3 – 12 months Greater than 1 year Total Cash and short-term funds* 1,049,890 193,541 – – 1,243,431 Financial assets held for trading 87,545 423,413 112,098 27,993 651,049 Financial assets designated at fair value 8,616 – – 176,796 185,412 Derivative financial assets 6,139 – – 26,198 32,337 Loans and advances 1,234,660 442,777 1,757,424 2,642,538 6,077,399 Investment securities – – 1,363 84,811 86,174 Prepayments and other receivables 9,248 1,030 161,722 – 172,000 Current tax asset – 225 8,233 – 8,458 Investment in associates – – – 17,539 17,539 Property and equipment – – – 514,880 514,880 Investment property – – – 2,021 2,021 Intangible assets – – – 130,362 130,362 Deferred tax asset – – – 62,826 62,826 Total assets 2,396,098 1,060,986 2,040,840 3,685,964 9,183,888 Shareholders equity and liabilities Equity – – – 612,567 612,567 Liabilities Deposits 4,839,030 1,677,412 837,759 20,499 7,374,700 Derivative financial liabilities 216 – – 46,853 47,069 Creditors and accruals 81,995 9,945 38,487 – 130,427 Current tax liabilities 4,051 4,427 19,139 – 27,617 Deferred tax liabilities – – – 9,720 9,720 Borrowed funds 4,458 14,909 380,122 582,299 981,788 Total equity and liabilities 4,929,750 1,706,693 1,275,507 1,271,938 9,183,888 Net maturity gap (2,533,652) (645,707) 765,333 2,414,026 – Contingent liabilities 288,048 61,277 1,928 81,650 432,903 * Included in the ‘Up to 1 month’ bucket are statutory reserve balances of BWP378.7 million (2010: BWP211.3 million). 79
  • 84.
    2010 BWP’000s Up to 1 month 1– 3 months 3 – 12 months Greater than 1 year Total Cash and short-term funds* 999,338 – – – 999,338 Financial assets held for trading 314,329 665,496 37,628 100,374 1,117,827 Financial assets designated at fair value 15,111 – – 64,028 79,139 Derivative financial assets – – 42,012 – 42,012 Loans and advances 1,404,310 597,542 462,851 613,407 3,078,110 Investment securities – – 458 52,565 53,023 Prepayments and other receivables 152,789 – 14,405 21,112 188,306 Current tax asset – – 5,637 751 6,388 Investment in associates – – – 34,845 34,845 Property and equipment – – – 330,218 330,218 Investment property – – – 3,878 3,878 Intangible assets – – – 57,402 57,402 Deferred tax asset – – 3,406 17,547 20,953 Total assets 2,885,877 1,263,038 566,397 1,296,127 6,011,439 Shareholders equity and liabilities Equity – – – 437,858 437,858 Liabilities Deposits 2,719,674 1,535,951 544,913 106,507 4,907,045 Derivative financial liabilities – – 1,047 – 1,047 Creditors and accruals 51,766 – 6,104 6,147 64,017 Current tax liabilities 3,549 1,444 1,826 – 6,819 Deferred tax liabilities – – – 15,233 15,233 Borrowed funds 1,276 7,615 82,862 487,667 579,420 Total equity and liabilities 2,776,265 1,545,010 636,752 1,053,412 6,011,439 Net maturity gap 109,612 (281,972) (70,355) 242,715 – Contingent liabilities 16,998 118,983 131,833 72,137 339,951 * Included in the ‘Up to 1 month’ bucket are statutory reserve balances of BWP211.3 million. Funding approach Sources of liquidity are regularly reviewed by the Asset and Liability Committees to maintain a diversification by currency, geography, provider, product and term where possible. Financial risk management continued ABC Holdings Limited ANNUAL REPORT 201180
  • 85.
    Non-derivative cashflow The tablebelow presents the cash flows payable by the Group under non-derivative financial liabilities by remaining contractual maturities at the date of the consolidated statement of financial position. The amounts disclosed in the table are the contractual undiscounted cash flows, whereas the Group manages the inherent liquidity risk based on expected undiscounted cash inflows: 2011 BWP’000s Up to 1 month 1 – 3 months 3 – 12 months Greater than 1 year Total Effect of discount/ financing rates 31 Dec 2011 Deposits 4,872,611 1,689,052 843,573 20,642 7,425,878 (51,178) 7,374,700 Creditors and accruals 81,995 9,945 38,487 – 130,427 – 130,427 Current tax liabilities 4,051 4,427 19,139 – 27,617 – 27,617 Borrowed funds 6,347 24,075 598,430 942,192 1,571,044 (589,256) 981,788 Total liabilities 4,965,004 1,727,499 1,499,629 962,834 9,154,966 (640,434) 8,514,532 2010 BWP’000s Up to 1 month 1 – 3 months 3 – 12 months Greater than 1 year Total Effect of discount/ financing rates 31 Dec 2010 Deposits 2,725,150 1,554,271 568,656 110,518 4,958,595 (51,550) 4,907,045 Creditors and accruals 51,766 – 6,104 6,147 64,017 – 64,017 Current tax liabilities 3,549 1,445 1,825 – 6,819 – 6,819 Borrowed funds 1,722 8,947 85,604 510,764 607,037 (27,617) 579,420 Total liabilities 2,782,187 1,564,663 662,189 627,429 5,636,468 (79,167) 5,557,301 The Group principally uses cash and short-term funds together with financial assets held for trading to manage liquidity risk. Derivative financial liabilities cash flows The table below presents the cash flows payable by the Group for derivative financial liabilities by remaining contractual maturities at the date of the consolidated statement of financial position. The amounts disclosed in the table are the contractual undiscounted nominal currency swap cash flows for the liability leg of such swaps, whereas the Group manages the inherent liquidity risk based on expected undiscounted cash inflows: 2011 Up to 1 month 1 – 3 months 3 – 12 months Greater than 1 year Total Derivative financial liabilities 762,158 215,275 – – 977,433 2010 Up to 1 month 1 – 3 months 3 – 12 months Greater than 1 year Total Derivative financial liabilities 139,966 138,385 55,052 30,278 363,681 With the exception of swaps where on-going cashflows are settled on a gross basis, all derivative financial liabilities are settled on a net basis. 81
  • 86.
    Financial risk managementcontinued Financial assets and liabilities measured at fair value Effective 1 January 2009, the Group adopted the amendments to IFRS 7 for financial instruments that are measured in the balance sheet at fair value. This requires disclosure of fair value measurements by level of the following fair value measurement hierarchy: • quoted prices (unadjusted) in active markets for identical assets or liabilities (level 1); • inputs other than quoted prices included within level 1 that are observable for the asset or liability, either directly (that is as prices) or indirectly (that is, derived from prices) (level 2); or • inputs for the asset or liability that are not based on observable market data (that is, unobservable inputs) (level 3). The following table presents the Group’s assets and liabilities that are measured at fair value at 31 December 2011: 2011 2010 BWP‘000s Quoted prices Level 1 Ob- servable inputs Level 2 Unob- servable inputs Level 3 Total at fair value Quoted prices Level 1 Ob- servable inputs Level 2 Unob- servable inputs Level 3 Total at fair value Financial assets held for trading – 651,049 – 651,049 – 1,117,827 – 1,117,827 Financial assets designated at fair value* 33,297 – 152,115 185,412 15,111 – 64,028 79,139 Derivative financial assets – 32,337 – 32,337 – 42,012 – 42,012 Investment securities** – – 44,002 44,002 – – 14,521 14,521 Total assets at fair value 33,297 683,386 196,117 912,800 15,111 1,159,839 78,549 1,253,499 Derivative financial liabilities*** – – 47,069 47,069 – 1,047 – 1,047 Total liabilities at fair value – – 47,069 47,069 – 1,047 – 1,047 The fair value of financial instruments traded in active markets is based on quoted market prices at the balance sheet date. A market is regarded as active if quoted prices are readily available from an exchange, dealer, broker, industry group, pricing service or regulatory agency, and those prices represent actual and regularly occurring market transactions on an arm’s length basis. The quoted price used for financial assets held by the Group is the current bid price. These instruments are included in level 1. Instruments included in level 1 comprise primarily quoted equity investments classified as trading securities or available-for-sale. The fair value of financial instruments that are not traded in an active market (for example, over-the-counter derivatives) is determined by using valuation techniques. These valuation techniques maximise the use of observable market data where it is available and rely as little as possible on entity specific estimates. If all significant inputs required to fair value an instrument are observable, the instrument is included in level 2. Financial assets held for trading and derivatives under level 2 have been valued using market interest and exchange rates. If one or more of the significant inputs is not based on observable market data, the instrument is included in level 3. ABC Holdings Limited ANNUAL REPORT 201182
  • 87.
    Specific valuation techniquesused to value financial instruments include: • quoted market prices or dealer quotes for similar instruments; • the fair value of interest rate swaps is calculated as the present value of the estimated future cash flows based on observable yield curves; • the fair value of foreign exchange contracts is determined using forward exchange rates at the balance sheet date, with the resulting value discounted back to present value; and • other techniques, such as discounted cash flow analysis, are used to determine fair value for the remaining financial instruments. *  Level 3 input: In estimating the fair value of instruments under level 3 at 31 December 2011, the following assumptions were applied for investments in convertible debentures of BWP77 million (2010: BWP64 million) included in this category: • volatility in the price of the underlying equity instrument of 50% (2010: 50%); and • credit spread of 12.54% (2010: 12.54%). The balance included in this category at 31 December 2011 of BWP75 million comprises of an investment made in September 2011 in a Special Purpose Entity (SPE) which in turn is invested in another syndicated SPE which, with the funds of other investors, is held to invest in a foreign bank (refer to note 9). ** The investment securities comprise of unlisted equities. The unlisted equities have been valued based on the value of recent trades in these equities where available. They comprise of shareholdings smaller than 20% in a number of private companies. *** For the detailed assumptions relating to the valuation of level 3 derivative financial liabilities see note 21.2 The movement in instruments included in the level 3 analysis is as follows 2011 Trading securities Trading derivatives Debt or equity investments Total assets at fair value Derivative financial liabilities Total liabilities at fair value Opening balance – – 78,549 78,549 – – Total gains or losses –  in profit and loss – – 27,611 27,611 27,485 27,485 – in other comprehensive income – – – – – – Purchases – – 89,599 89,599 19,584 19,584 Issues – – – – – – Settlements – – – – – – Exchange rate adjustment – – 358 358 – – Transfers out of level 3 – – – – – – Closing balance – – 196,117 196,117 47,069 47,069 83
  • 88.
    2010 Trading securities Trading derivatives Debt or equity investments Total at fairvalue Derivative financial liabilities Total liabilities at fair value Opening balance – – 14,450 14,450 – – Total gains or losses –  in profit and loss – – – – – – – in other comprehensive income – – – – – – Purchases – – 65,543 65,543 – – Issues – – – – – – Settlements – – – – – – Exchange rate adjustment – – (1,444) (1,444) – – Transfers out of level 3 – – – – – – Closing balance – – 78,549 78,549 – – Financial instruments not measured at fair value The table below details the carrying amounts and fair values of those financial assets and liabilities not presented on the Group’s balance sheet at their fair value: 2011 2010 Carrying value Fair value Unrecognised profit/(loss) Carrying value Fair value Unrecognised profit/(loss) Borrowed funds 981,788 1,068,349 (86,561) 579,420 648,603 (69,183) Financial instruments not measured at fair value, where the carrying value is estimated to approximate the fair value of these instruments, were as follows: (i) Placements with other banks Placements with other banks includes inter-bank placements and items in the course of collection. The fair value of floating rate placements and overnight deposits is their carrying amount. The estimated fair value of fixed interest- bearing deposits is based on discounted cash flows using prevailing money-market interest rates for debts with similar credit risk and remaining maturity. (ii) Loans and advances Loans and advances are accounted for on an amortised cost basis using the effective interest rate. Origination transaction costs and origination fees received that are integral to the effective rate are capitalised to the value of the loans and amortised through interest income as part of the effective interest rate. Loans and advances are stated net of allowances for specific and portfolio impairment. (iii) Investment securities Investment securities include only interest-bearing assets held to maturity, and unlisted equities; assets classified as available for sale are measured at fair value. Fair value for held-to-maturity assets is based on market prices or broker/dealer price quotations. Where this information is not available, fair value is estimated using quoted market prices for securities with similar credit, maturity and yield characteristics. Financial risk management continued ABC Holdings Limited ANNUAL REPORT 201184
  • 89.
    (iv) Deposits The estimatedfair value of deposits with no stated maturity, which includes non-interest-bearing deposits, is the amount repayable on demand. The estimated fair value of fixed interest-bearing deposits and other borrowings not quoted in an active market is based on discounted cash flows using interest rates for new debts with similar remaining maturity. (v) Off-balance sheet financial instruments The estimated fair values of the off-balance sheet financial instruments are based on market prices for similar facilities. When this information is not available, fair value is estimated using discounted cash flow analysis. Off-balance sheet items BWP’000s 2011 2010 (a) Contingent liabilities Guarantees 337,516 210,146 Letters of credit, loan commitments and other contingent liabilities 95,387 129,805 432,903 339,951 The timing profile of the contractual amounts of the Group’s off-balance sheet financial instruments that commit it to extend credit to customers and other facilities as at 31 December 2011, are summarised below: Less than one year 351,253 267,814 Between one and five years 81,650 72,137 432,903 339,951 (b) Capital commitments Approved and contracted for 10,782 15,604 Approved but not contracted for 93,571 68,004 104,353 83,608 (c) Non-cancellable operating leases commitments Future minimum lease payments under non-cancelled operating leases are as follows: Office premises 64,353 36,285 Equipment and motor vehicles – 984 64,353 37,269 Non-cancellable operating leases are payable as follows: Less than one year 6,327 9,241 Between one and five years 33,403 22,649 Over five years 24,623 5,379 64,353 37,269 Capital management The Group’s objectives when managing capital, which is a broader concept than the ‘equity’ on the face of balance sheets, are: • to comply with the capital requirements set by the regulators of the banking markets where the entities within the Group operate; • to safeguard the Group’s ability to continue as a going concern so that it can continue to provide returns for shareholders and benefits for other stakeholders; and • to maintain a strong capital base to support the development of its business. 85
  • 90.
    Capital adequacy andthe use of regulatory capital are monitored daily by the Group’s management, employing techniques based on the guidelines developed by the Basel Committee and the relevant Central Bank Authorities. The required information is filed with the Authorities on a monthly basis. The Group’s policy is to maintain a strong capital base so as to maintain investor, creditor and market confidence and to sustain future developments of the business. At 31 December 2010 all regulated banking operations complied with all externally imposed capital requirements. There have been no material changes to the Group’s management of capital during the year. Regulatory minimum capital adequacy ratios for the Group’s banking operations based on December 2011 returns submitted to regulatory authorities, are summarised below: 2011 BWP’000s BancABC Botswana BancABC Zimbabwe BancABC Zambia BancABC Tanzania BancABC Mozambique Tier I Capital Share capital and premium 71,470 171,272 81,004 128,973 61,810 Capital reserves and retained earnings* 89,325 91,913 (3,297) (31,784) 58,041 Allocation for market and operational risk – (6,589) – – – Intangible assets (software)/deferred charges – – – – (20,754) Prepayments – – – (9,036) – Exposures to insiders – (5,219) – – Total qualifying for Tier I capital 160,795 251,377 77,707 88,153 99,097 Tier II capital Shareholder’s loan 68,439 – 54,304 – 52,415 General debt provision 5,523 14,924 – – – Current year’s unpublished profits – – – – – Fair value revaluation/available for sale reserve – 1,265 – – – Other – – – – – Revaluation reserves (limited to Tier I capital) 1,151 1,318 – – – Total qualifying for Tier II capital 75,113 17,507 54,304 – 52,415 Tier III capital – 6,589 – – – Total qualifying for Tier III capital – 6,589 – – – Total capital 235,908 275,473 132,011 88,153 151,512 Risk weighted assets** On balance sheet assets 1,471,292 2,508,637 620,270 682,417 958,287 Off balance sheet assets 29,653 19,485 207,135 43,371 25,571 Total risk weighted assets 1,500,945 2,528,122 827,405 725,788 983,858 Capital adequacy ratio 16% 11% 16% 12% 15% Minimum regulatory capital adequacy ratio 15% 10% 10% 12% 8% * Net of foreign currency translation reserve. Financial risk management continued ABC Holdings Limited ANNUAL REPORT 201186
  • 91.
    2010 BWP’000s BancABC Botswana BancABC Zimbabwe BancABC Zambia BancABC Tanzania BancABC Mozambique Tier I Capital Sharecapital and premium 34,070 67,913 81,004 128,973 61,810 Capital reserves and retained earnings* 57,750 78,075 (37,477) (31,541) 42,143 Intangible assets (software) – – – – (7,697) Allocation for market and operational risk – (6,965) – – – Prepayments – – – (11,429) – Exposures to insiders – (4,573) – – Total qualifying for Tier I capital 91,820 134,450 43,527 86,003 96,256 Tier II capital Shareholder’s loan 63,236 – 43,527 – 46,058 General debt provision 3,496 7,996 – – – Revaluation reserve 13,262 – – – – Revaluation reserves (limited to Tier I capital) – – – – – Total qualifying for Tier II capital 79,994 7,996 43,527 – 46,058 Tier III Capital – 6,965 – – – Total qualifying for Tier III capital – 6,965 – – – Total capital 171,814 149,411 87,054 86,003 142,314 Risk weighted assets** On-balance sheet assets 889,642 769,958 298,545 476,251 21,178 Off-balance sheet assets 33,534 12,735 48,514 46,776 601,202 Total risk weighted assets 923,176 782,693 347,059 523,027 622,380 Capital adequacy ratio 19% 19% 25% 16% 23% Minimum regulatory capital adequacy ratio 15% 10% 10% 12% 8% * Net of foreign currency translation reserve. ** Weighting of assets is based on the nature of the asset and the weighting as prescribed by the relevant regulatory authority. The increase of the regulatory capital is mainly due to increase in shareholders’ loans at subsidiary level, as well as contributions of the current year profit. The increase of the risk-weighted assets reflects the expansion of the lending business in most of the subsidiaries. Capital allocation The allocation of capital between specific operations and activities is, to a large extent, driven by optimisation of the return achieved on the capital allocated. The amount of capital allocated to each subsidiary is based on the regulatory capital requirements of the countries we operate in and the need to maximise returns to shareholders. The Group’s policies in respect of capital management and allocation are reviewed regularly by the Board of Directors. 87
  • 92.
    Segment aNALysis By geographicalsegment Operating segments are reported in accordance with the internal reporting provided to the Group Executive Committee (the chief operating decision-maker), which is responsible for allocating resources to the reportable segments and assesses its performance. All operating segments used by the Group meet the definition of a reportable segment under IFRS 8. The Group has six main business segments, comprising: • Banking operations in: – Botswana – Mozambique – Tanzania – Zambia; and – Zimbabwe • and non-deposit taking operations arising from ABCH and non-banking subsidiaries. The Group’s segment operations are all financial with a majority of operating revenues derived from interest and fee and commission income. The Group Executive Committee relies primarily on attributable profits to assess the performance of the segment for the period. There were no changes in the reportable segments during the year. Transactions between the business segments are carried out at arm’s length. The revenue from external parties reported to the Group Executive Committee is measured in a manner consistent with that in the consolidated income statement. As the banking operations comprise of stand alone banks, each banking operation is funded with tier I and II capital from ABCH. Interest is charged at rates disclosed in the ABCH Company stand alone financial statements on page 124. Other material items of income or expense between the business segments comprise of management fees and dividends. The Group’s management reporting is based on a measure of operating profit comprising net interest income, loan impairment charges, net fee and commission income, other income and non-interest expenses. The effects of non-recurring items of income or expense is described in the report on the Group financial performance. The information provided about each segment is based on the internal reports about segment profitability, assets and liabilities composition, and other information, which are regularly reviewed by the Group Executive Committee. Segment assets and liabilities comprise the majority of items appearing on the consolidated balance sheet. There were no banking revenues derived from transactions with a single external customer that amounted to 10% or more of the Group’s revenues. Financial risk management continued ABC Holdings Limited ANNUAL REPORT 201188
  • 93.
    The segment informationprovided to the Group Executive Committee for the reportable segments for the year ended 31 December 2011 is as follows: 2011 BWP’000s BancABC Botswana BancABC Mozam- bique BancABC Tanzania BancABC Zimbabwe BancABC Zambia Head office and other** Consoli- dation entries**** Total Net interest income after impairment of loans and advances* 70,339 55,294 17,734 90,244 67,070 32,144 – 332,825 Total income 116,481 120,660 55,639 218,943 100,902 119,834 (73,650) 658,809 Net income from operations 32,551 39,862 (6,123) 70,242 21,382 28,597 (73,650) 112,861 Share of results of associates – – – 730 – (5,907) – (5,177) Profit before tax 32,551 39,862 (6,123) 70,972 21,382 22,690 (73,650) 107,684 Income tax (4,546) (10,998) 2,580 (15,882) 10,489 (1,629) – (19,986) Profit for the year 28,005 28,864 (3,543) 55,090 31,871 21,061 (73,650) 87,698 Attributable profit 28,005 28,864 (3,326) 55,090 31,871 16,148 (73,650) 83,002 Financial assets held for trading 418,406 119,904 49,073 19,016 36,957 7,693 – 651,049 Loans and advances 1,658,100 761,897 572,697 2,033,159 576,910 474,636 – 6,077,399 Segment assets (excluding associates) 2,564,270 1,220,893 918,312 2,618,330 883,887 1,641,051 (680,394) 9,166,349 Associates – – – 4,472 – 13,067 – 17,539 Total assets 2,564,270 1,220,893 918,312 2,622,802 883,887 1,654,118 (680,394) 9,183,888 Deposits 2,563,126 1,216,349 1,060,686 1,986,419 548,120 – – 7,374,700 Borrowed funds 133,016 – 23,253 151,400 76,836 597,283 – 981,788 Segment liabilities*** 2,329,837 995,901 819,786 2,339,194 765,957 1,320,646 – 8,571,321 Other segment items: Capital expenditure 20,899 32,171 24,188 115,903 29,755 32,100 – 255,016 Depreciation 5,456 7,608 3,266 9,367 3,458 2,860 – 32,015 Amortisation 4,348 5,522 1,514 2,382 1,691 427 – 15,884 Impairment charge 9,135 5,409 32,949 31,331 681 32 – 79,537 Operating expenses 83,930 80,798 61,762 148,702 79,520 91,236 – 545,948 * After eliminations. ** Reflects non-banking operations in various geographical sectors. *** Includes inter-company assets or liabilities. **** The main consolidation entry relates to the elimination of inter-group dividends of BWP74 million as well as the investment in subsidiaries of BWP713 million net of goodwill of BWP33 million. 89
  • 94.
    2010 BWP’000s BancABC Botswana BancABC Mozam- bique BancABC Tanzania BancABC Zimbabwe BancABC Zambia Head office and Other** Consoli- dation entries Total Net interestincome after impairment of loans and advances* 51,610 26,641 29,975 55,255 70,790 47,748 – 282,019 Total income 84,964 83,967 67,855 140,347 91,562 112,298 (34,686) 546,307 Net income from operations 25,594 27,370 20,186 28,787 11,203 34,119 (36,045) 111,214 Share of results of associates – – – 228 – (20,362) – (20,134) Profit before tax 25,594 27,370 20,186 34,083 11,203 8,689 (36,045) 91,080 Income tax (5,554) (4,450) (3,351) (7,344) – (808) (988) (22,495) Profit for the year 20,040 22,919 16,834 26,739 11,203 7,883 (37,033) 68,585 Attributable profit 20,040 22,919 15,805 26,739 11,203 7,037 (37,033) 66,710 Financial assets held for trading 884,934 77,897 126,693 1,658 20,328 6,317 – 1,117,827 Loans and advances 794,615 424,274 446,426 895,169 232,721 284,905 – 3,078,110 Segment assets (excluding associates) 1,989,701 718,762 727,993 1,515,559 375,189 1,406,464 (757,072) 5,976,596 Associates – – – 4,760 – 30,085 – 34,845 Total assets 1,989,701 718,762 727,993 1,520,319 375,189 1,436,547 (757,072) 6,011,439 Deposits 1,966,307 836,104 795,640 1,056,032 252,962 – – 4,907,045 Borrowed funds 85,076 – – 19,336 29,016 445,992 – 579,420 Segment liabilities*** 1,818,748 556,374 630,561 1,329,071 288,845 963,160 (13,178) 5,573,581 Other segment items: Capital expenditure 23,838 10,895 14,455 29,546 2,162 2,095 – 82,991 Depreciation 3,423 4,318 2,717 7,657 2,572 2,457 1,358 24,502 Amortisation 1,073 2,152 591 – 1,159 – – 4,975 Impairment charge (158) 2,416 18,063 2,187 (3,458) (3,224) – 15,826 Operating expenses 59,370 56,597 47,670 106,593 80,360 83,145 1,358 435,093 * After eliminations. ** Reflects non-banking operations in various geographical sectors. *** Includes inter-company assets or liabilities. Financial risk management continued ABC Holdings Limited ANNUAL REPORT 201190
  • 95.
    CONSOLIDATED GROUP FINANCIAL STATEMENTS 92 Consolidatedincome statement 92 Consolidated statement of comprehensive income 93 Consolidated balance sheet 94 Consolidated statement of changes in equity 96 Consolidated cash flow statement 97 Notes to the financial statements 91
  • 96.
    BWP‘000s Notes 20112010 Interest and similar income 821,900 594,837 Interest expense and similar charges (409,538) (296,992) Net interest income before impairment of advances 1 412,362 297,845 Impairment of loans and advances 2 (79,537) (15,826) Net interest income after impairment of advances 332,825 282,019 Non-interest income 3 325,984 264,288 Total income 658,809 546,307 Operating expenditure 4 (545,948) (435,093) Net income from operations 112,861 111,214 Share of results of associates 13 (5,177) (20,134) Profit before tax 107,684 91,080 Tax 5 (19,986) (22,495) Profit for the year 87,698 68,585 Attributable to: Ordinary shareholders 83,002 66,710 Minorities 4,696 1,875 Profit for the year 87,698 68,585 Basic earnings per share (Thebe) 6 56.6 46.3 Dividend per share (Thebe) 28 17.5 10.0 for the year ended 31 December 2011 for the year ended 31 December 2011 consolidated income statement consolidated statement of comprehensive income BWP‘000s 2011 2010 Profit for the year 87,698 68,585 Other comprehensive income 101,846 (46,506)   Exchange differences on translating foreign operations 102,415 (48,834)   Revaluation of property 1,833 (1,982)   Share of reserves in associate companies (1,901) 3,016   Movement in available-for-sale reserves (132) 24   Income tax relating to components of other comprehensive income (369) 1,270 Total comprehensive income for the year 189,544 22,079 Total comprehensive income attributable to: Ordinary shareholders 183,775 23,267 Minorities 5,769 (1,188) 189,544 22,079 ABC Holdings Limited ANNUAL REPORT 201192
  • 97.
    BWP‘000s Notes 20112010 ASSETS Cash and short-term funds 7 1,243,431 999,338 Financial assets held for trading 8 651,049 1,117,827 Financial assets designated at fair value 9 185,412 79,139 Derivative financial assets 21 32,337 42,012 Loans and advances 10 6,077,399 3,078,110 Investment securities 12 86,174 53,023 Prepayments and other receivables 11 172,000 188,306 Current tax assets 8,458 6,388 Investment in associates 13 17,539 34,845 Property and equipment 15 514,880 330,218 Investment property 14 2,021 3,878 Intangible assets 17 130,362 57,402 Deferred tax assets 16 62,826 20,953 Total assets 9,183,888 6,011,439 EQUITIES AND LIABILITIES Liabilities Deposits 18 7,374,700 4,907,045 Derivative financial liabilities 21 47,069 1,047 Creditors and accruals 20 130,427 64,017 Current tax liabilities 27,617 6,819 Deferred tax liabilities 16 9,720 15,233 Borrowed funds 19 981,788 579,420 8,571,321 5,573,581 Equity Stated capital 22 316,592 307,586 Foreign currency translation reserve (246,046) (347,388) Non-distributable reserves 182,593 162,535 Distributable reserves 343,672 299,603 Equity attributable to ordinary shareholders 596,811 422,336 Minority interest 15,756 15,522 Total equity 612,567 437,858 TOTAL EQUITY AND LIABILITIES 9,183,888 6,011,439 as at 31 December 2011 consolidated balance sheet 93
  • 98.
    for the yearended 31 December 2011 Attributable to owners of the parent BWP’000s Stated capital Foreign currency translation reserve Regulatory general credit risk reserve Property revaluation reserve Available- for-sale reserve Balance as at 1 January 2010 307,586 (298,715) 4,170 116,535 728 Comprehensive income: Profit for the year – – – – – Other comprehensive income: – (48,673) 889 2,608 24  Exchange differences on translating foreign operations – (45,771) – – –   Revaluation of property net of deferred tax – – – (712) –   Movement in general credit risk reserve – – 889 – –   Hedging reserve transfer – (2,902) – – –   Share of reserves in associate companies – – – 3,320 –   Movement in statutory reserves – – – – –   Disposal of treasury shares – – – –   Movement in available for sale reserves: – – – – 24   –  Arising in current year – – – – 24 TOTAL COMPREHENSIVE INCOME – (48,673) 889 2,608 24 Balance as at 31 December 2010 307,586 (347,388) 5,059 119,143 752 Comprehensive income: Profit for the year – – – – – Other comprehensive income: – 101,342 8,832 (860) (132)  Exchange differences on translating foreign operations – 101,342 – – –   Revaluation of property net of deferred tax – – – 1,464 –   Movement in general credit risk reserve – – 8,832 – –   Share of reserves in associate companies – – – (2,324) –   Movement in statutory reserves – – – – –   Movement in available for sale reserves: – – – – (132)   –  Realised through profit and loss – – – – (132) TOTAL COMPREHENSIVE INCOME – 101,342 8,832 (860) (132) Transactions with owners Dividends paid – – – – – Dividends paid by subsidiaries to minority interests – – – – – Disposal of treasury shares – – – – – Discount on new shares issued to staff – – – – – Proceeds from shares issued 9,006 – – – – Total transaction with owners 9,006 – – – – Balance as at 31 December 2011 316,592 (246,046) 13,891 118,283 620 consolidated statement of changes in equity ABC Holdings Limited ANNUAL REPORT 201194
  • 99.
    Attributable to ownersof the parent Total Minority interest Total Equity Statutory reserve Hedging reserve Share based payments reserve Treasury share reserve Distributable reserves 28,052 (2,902) – (2,574) 246,189 399,069 16,710 415,779 – – – – 66,710 66,710 1,875 68,585 11,900 2,902 – 203 (13,296) (43,443) (3,063) (46,506) – – – – – (45,771) (3,063) (48,834) – – – – – (712) – (712) – – – – (889) – – – – 2,902 – – – – – – 205 – – – (509) 3,016 – 3,016 11,695 – – – (11,695) – – – – – – 203 (203) – – – – – – – – 24 – 24 – – – – – 24 – 24 11,900 2,902 – 203 53,414 23,267 (1,188) 22,079 39,952 – – (2,371) 299,603 422,336 15,522 437,858 – – – – 83,002 83,002 4,696 87,698 9,847 – – – (18,256) 100,773 1,073 101,846 – – – – – 101,342 1,073 102,415 – – – – – 1,464 – 1,464 – – – – (8,832) – – – 255 – – – 168 (1,901) – (1,901) 9,592 – – – (9,592) – – – – – – – – (132) – (132) – – – – – (132) – (132) 9,847 – – – 64,746 183,775 5,769 189,544 – – – – (25,161) (25,161) – (25,161) – – – – – – (5,535) (5,535) – – (1,028) 2,371 4,484 5,827 – 5,827 – – 2,379 – – 2,379 – 2,379 – – (1,351) – – 7,655 – 7,655 – – – 2,371 (20,677) (9,300) (5,535) (14,835) 49,799 – – – 343,672 596,811 15,756 612,567 95
  • 100.
    for the yearended 31 December 2011 BWP’000s 2011 2010 CASH FLOWS FROM OPERATING ACTIVITIES (175,580) 219,100 Cash generated from operating activities 263,802 154,379 Net profit before tax 107,684 91,080 Adjusted for: Impairment of loans and advances 79,537 15,826 Depreciation and amortisation 47,899 29,477 Net unrealised losses/(gains) on derivative financial instruments 17,122 (1,725) Fair value gains on investment properties – (125) Profit on disposal of investment property (395) – Loss from associates 5,177 20,134 Discount on new shares issued to staff 2,379 – Impairment of investment in associates 4,292 – Loss/(profit) on disposal of property and equipment 107 (288) Tax paid (53,328) (25,522) Net cash inflow from operating activities before changes in operating funds 210,474 128,857 Net (decrease)/increase in operating funds (386,054) 90,243 Increase in operating assets (3,460,992) (1,671,299) Increase in operating liabilities 3,074,938 1,761,542 CASH FLOWS FROM INVESTING ACTIVITIES (244,185) (79,350) Purchase of property and equipment (174,441) (82,991) Purchase of intangible assets (80,575) (13,087) Additions to investment property (38) (336) Purchase of associates (1,665) (11,314) Proceeds on disposal of property and equipment 206 8,006 Proceeds on disposal of investment property 2,709 20,372 Proceeds on disposal of associate 9,619 – CASH FLOWS FROM FINANCING ACTIVITIES 392,795 40,075 Increase in borrowed funds 410,009 40,075 Dividend paid (25,161) – Dividends paid by subsidiaries to minority interests (5,535) – Disposal of treasury shares 5,827 – Proceeds from issue of shares 7,655 – (Decrease)/increase in cash and cash equivalents (26,970) 179,825 Cash and cash equivalents at the beginning of the year 788,026 701,766 Exchange adjustment on opening balance 103,678 (93,565) Cash and cash equivalents at the end of the year 864,734 788,026 Cash and cash equivalents 864,734 788,026 Statutory reserves 378,697 211,312 Cash and short-term funds 1,243,431 999,338 consolidated cash flow statement ABC Holdings Limited ANNUAL REPORT 201196
  • 101.
    for the yearended 31 December 2011 BWP’000s 2011 2010 1. NET INTEREST INCOME Interest and similar income Cash and short-term funds 19,073 66,462 Investment securities and dated financial instruments 137,240 78,506 Loans and advances at amortised cost 665,587 449,869 821,900 594,837 Interest expense Deposits 347,142 248,013 Borrowed funds 62,396 48,979 409,538 296,992 Net interest income 412,362 297,845 2. IMPAIRMENT OF LOANS AND ADVANCES Specific impairments 55,721 18,146 Portfolio impairments 24,002 2,691 Impairments prior to recoveries 79,723 20,837 Recoveries of loans and advances previously written off (186) (5,011) 79,537 15,826 3. NON-INTEREST INCOME Gains from trading activities: 31,277 46,561 Gains on financial assets at fair value through profit and loss 48,399 44,836 –  held for trading 18,705 33,496 –  designated at fair value 29,694 11,340 Net (losses)/gains on derivative financial instruments* (17,122) 1,725 Dividends received: 131 123 Listed shares – fair value through profit or loss 131 123 Fee and commission income: 162,148 103,189 Net fee income on loans and advances 77,867 60,516 Net fee income from trust and fiduciary activities 21,731 7,998 Cash transaction fees 5,646 14,566 Other fee income 56,904 20,109 Other non-interest income: 132,428 114,415 Money market trading income – (6) Fair value gains on investment properties at fair value (Note 14) – 125 Rental and other income 15,987 7,632 (Loss)/profit on disposal of property and equipment (107) 288 Forex trading income and currency revaluation** 116,153 106,090 Profit on disposal of investment properties 395 – Service charges recoveries – 286 325,984 264,288 * Net (losses)/gains on derivative financial instruments include net gains of BWP10 million (2010: BWP1.7 million) arising from the USD: Japanese Yen derivative swap, and net losses of BWP27 million (2010: nil) arising from the derivative conversion option included in the IFC convertible loan (note 21). ** Foreign exchange income includes a foreign exchange loss of BWP26 million (2010: loss of BWP10.7 million) arising from the Japanese Yen exposure with NDB, disclosed in note 19. Net gains/(losses) on derivative instruments include an offsetting fair value gain arising from an equal but opposite nominal Japanese Yen derivative asset. notes to the financial statements 97
  • 102.
    Notes to thefinancial statements continued BWP’000s 2011 2010 4. OPERATING EXPENDITURE Administrative expenses 186,579 150,971 Property lease rentals 20,234 20,971 Staff costs (note 4.1) 264,560 217,346 Auditor’s remuneration 6,479 4,786 Impairment of investment in associate (note 13) 4,292 – Depreciation (note 15) 32,015 24,502 Amortisation of software (note 17) 15,884 4,975 Directors remuneration (note 4.2) 15,905 11,542 545,948 435,093 4.1 Staff Costs Salaries 164,164 163,701 Employer contributions to post retirement funds 16,546 13,576 Other staff costs 83,850 40,069 264,560 217,346 Other staff costs comprise profit share expense, medical aid contributions, staff training and other staff related expenses. 4.2 Directors remuneration Executive directors Salary, performance related remuneration and other benefits 12,251 8,013 Non-executive directors Fees as director of holding company 2,769 2,617 Fees as director of subsidiaries 885 912 3,654 3,529 15,905 11,542 Details of other transactions and balances with related parties have been disclosed under note 25. 5. TAX Current tax expense Current year 59,343 22,438 Under/(over) provision in prior years 1,026 (544) Withholding tax 4,953 – Bank levies – 231 65,322 22,125 Deferred tax Accruals (5,209) 285 Impairment losses (13,623) (123) Property and equipment 1,481 3,485 Gains and investments 1,533 (3,654) Tax losses (29,518) 377 (45,336) 370 Total tax expense per income statement 19,986 22,495 ABC Holdings Limited ANNUAL REPORT 201198
  • 103.
    BWP’000s 2011 2010 5.TAX (continued) Reconciliation of effective tax charge: Profit before tax* 107,684 91,080 Income tax using corporate tax rates* 52,575 39,065 Non-deductible expenses 368 1,267 Tax exempt revenues (18,896) (12,375) Tax incentives (3,059) (5,149) Tax on dividends received 4,893 – Under/(over) provision in prior years 1,026 (544) Tax losses of prior years now raised/claimed (16,394) – Bank levies – 231 Rate change (527) – Current tax expense per income statement 19,986 22,495 Effective tax rate 19% 25% * Profit before tax is net of inter-group dividends. Income tax using corporate tax rates is calculated prior to this elimination. 5.1 Income tax effects relating to components of other comprehensive income 2011 2010 Tax (charge)/ Tax (charge)/ BWP‘000s Before tax credit After tax Before tax credit After tax Exchange differences on translating foreign operations 102,415 – 102,415 (48,834) – (48,834) Revaluation of property net of deferred tax 1,833 (369) 1,464 (1,982) 1,270 (712) Share of reserves in associate companies (1,901) – (1,901) 3,016 – 3,016 Movement in available for sale reserves (132) – (132) 24 – 24 Other comprehensive income 102,215 (369) 101,846 (47,776) 1,270 (46,506) BWP’000s 2011 2010 6. EARNINGS PER SHARE Basic earnings per share Profit attributable to ordinary shareholders (‘000) 83,002 66,710 Weighted average number of ordinary shares in issue (‘000) 146,760 143,956 Basic earnings per share (Thebe) 56.6 46.3 Number of shares (‘000) Shares in issue at beginning of the year 146,420 146,420 Ordinary shares issued during the year 3,053 – Total Company 149,473 146,420 Recognised as treasury shares – (2,371) Total Group 149,473 144,049 Weighted average number of ordinary shares 146,760 143,956 99
  • 104.
    BWP’000s 2011 2010 7.CASH AND SHORT-TERM FUNDS Cash on hand 129,306 74,777 Balances with central banks 40,549 42,722 Balances with other banks 694,879 670,527 Cash and cash equivalents 864,734 788,026 Statutory reserve balances 378,697 211,312 1,243,431 999,338 Statutory reserve balances are restricted minimum statutory balances not available for the banking operation’s daily operations. These balances do not accrue interest. 8. FINANCIAL ASSETS HELD FOR TRADING Government bonds 52,747 102,766 Corporate bonds 26,709 5,677 Treasury bills and other open market instruments 571,593 1,007,913 Bankers acceptances and commercial paper – 1,471 651,049 1,117,827 Investment in government bonds and treasury bills by subsidiaries is partly for liquidity requirements as stipulated by local central banks and also as a source of diversification of the assets portfolio. There are no cross-border investments in government securities by any of the subsidiaries and the holding company. The Group also invests in tradeable paper issued by large corporates in the respective markets. All financial assets held for trading are carried at fair value. 9. FINANCIAL ASSETS DESIGNATED AT FAIR VALUE Listed equities 18,907 4,105 Listed debentures 14,390 11,006 Unlisted debentures 152,115 64,028 185,412 79,139 The listed equities comprise various counters listed on the Zimbabwe stock exchange that subsidiaries have invested in. The listed debentures comprise of an investment in 10% convertible debentures issued by PG Industries (Zimbabwe) Limited. The unlisted debentures comprise of an investment in 12% convertible debentures issued by Star Africa Corporation Limited and a 10% convertible loan to ADC Enterprises Limited (refer to the overview of valuation assumptions included in the financial risk management section of the financial statements). 10. LOANS AND ADVANCES Mortgage lending 65,201 14,659 Instalment finance 331,826 320,602 Corporate lending 4,440,053 2,567,327 Commercial and property finance 169,531 45,151 Micro-finance lending 354,374 135,870 Consumer lending 933,974 132,966 6,294,959 3,216,575 Less impairments (Note 10.1) (217,560) (138,465) Net loans and advances 6,077,399 3,078,110 Notes to the financial statements continued ABC Holdings Limited ANNUAL REPORT 2011100
  • 105.
    BWP’000s 2011 2010 10.LOANS AND ADVANCES (continued) 10.1 Analysis of impairments Specific impairments 173,008 121,472 Portfolio impairments 44,552 16,993 217,560 138,465 10.2 Impairment of loans and advances – movement analysis BWP‘000s Total impair- ments Mortgage lending Instalment finance Corporate lending Commer- cial and property finance Micro- finance lending Consumer lending 2011 Opening balance 138,465 1,378 25,651 94,216 1,423 14,510 1,287 Exchange adjustment 22,656 (144) 4,593 14,509 1 974 2,723 Bad debts written off (23,284) – (17,430) – – (5,854) – Net new impairments created (Note 2) 79,723 – – 71,692 – 2,221 5,810 Impairments created 79,723 – – 71,692 – 2,221 5,810 Closing balance 217,560 1,234 12,814 180,417 1,424 11,851 9,820 BWP‘000s Total impair- ments Mortgage lending Instalment finance Corporate lending Commer- cial and property finance Micro- finance lending Consumer lending 2010 Opening balance 134,347 2,163 26,999 85,338 1,423 15,198 3,226 Exchange adjustment (10,828) – (211) (9,661) – (983) 27 Bad debts written off (11,396) – (838) (10,558) – – – Net new impairments created (Note 2) 20,837 (785) (299) 22,563 – 295 (937) Impairments created 21,161 (785) (299) 22,887 – 295 (937) Impairments released (324) – – (324) – – – Suspended interest 5,505 – – 6,534 – – (1,029) Closing balance 138,465 1,378 25,651 94,216 1,423 14,510 1,287 BWP’000s 2011 2010 11. PREPAYMENTS AND OTHER RECEIVABLES Accounts receivable and prepayments 144,512 171,358 Security deposits 5,262 3,467 Other amounts due 22,226 13,481 172,000 188,306 101
  • 106.
    BWP’000s 2011 2010 12.INVESTMENT SECURITIES Available for sale   Unlisted equities 44,002 14,521 Held to maturity   Promissory notes 42,172 38,502 86,174 53,023 The investments in unlisted equities are accounted for at fair value. Refer to fair value note under financial risk management for details. The promissory notes are partial security for the loan from BIFM (Note 19). The promissory notes earn a fixed interest of 10.25% p.a., and are redeemable on 31 March 2015. The fair value of the promissory notes has not been determined as the promissory notes are specifically conditional to the terms of the BIFM loan referred to in note 19. 13. INVESTMENT IN ASSOCIATES Carrying value at the beginning of the year 34,845 40,946 Exchange rate adjustment 2,150 (1,346) Reclassification during the year – 1,049 Share of (losses)/profits (5,177) (23,828) Tax (132) 3,694 Share of other comprehensive income (1,901) 3,016 Disposals* (9,619) – Impairment (note 4) (4,292) – Additions* 1,665 11,314 17,539 34,845 * Refer to note 29 for an overview of additions and disposals. 13.1 Investment in associates The Group’s interest in its principal associates are as follows: BWP’000s Country of incorporation Assets Liabilities Carrying amount Share of profit/ (loss) Impair- ment during the year % interest held Reporting date 2011 Lion of Tanzania Insurance Company Limited Tanzania 23,281 18,746 3,881 305 – 38% 31 December PG Industries (Botswana) Limited* Botswana 30,800 24,358 9,186 (1,892) 4,292 37% 31 March Credit Insurance Zimbabwe Limited Zimbabwe 8,644 4,224 4,472 954 – 24% 31 December Prestige Investments Private Limited** Zimbabwe – – – (4,544) – 0% 31 December 62,725 47,328 17,539 (5,177) 4,292 Notes to the financial statements continued ABC Holdings Limited ANNUAL REPORT 2011102
  • 107.
    13.1 Investment inassociates (continued) BWP’000s Country of incorporation Assets Liabilities Carrying amount Share of profit/ (loss) Impair- ment during the year % interest held Reporting date 2010 Lion of Tanzania Insurance Company Limited Tanzania 16,467 13,644 2,925 248 – 38% 31 December PG Industries (Botswana) Limited* Botswana 31,779 24,736 15,370 (2,821) – 37% 31 March Credit Insurance Zimbabwe Limited Zimbabwe 5,361 2,280 3,162 227 – 24% 31 December Prestige Investments Private Limited** Zimbabwe 14,307 4,243 11,789 (17,788) – 49% 31 December PG Industries (Zimbabwe) Limited** Zimbabwe 4,402 2,476 1,599 – – 2% 31 December 72,316 47,379 34,845 (20,134) – * IFRS compliant management accounts not available. * In assessing investments in associates for impairment, the following assumptions were applied in assessing PG Industries Botswana Limited, which generated a loss during the year, for impairment: •  projected compounded free cashflows of BWP5.3 million, BWP4.5 million and BWP4.8 million over the next 3 years; •  terminal value based on 3.5% long-term cash flow growth rate; and •  weighted average cost of capital of 12.72% The equity accounted numbers, other than for Lion of Tanzania, are based on management accounts. Lion of Tanzania was equity accounted using audited annual financial statements for the year ended 31 December 2010. ** On 31 August 2011, the Group divested from Prestige Investment Private Limited. The dissolution of the Company was by way of a distribution of assets to the shareholders of the Company on that date. The Group received shares that it was entitled to in PG Industries (Zimbabwe) Limited. As the effective shareholding of the Group in PG Industries (Zimbabwe) Limited is less than 20%, these shares were transferred to investment securities held at fair value through profit or loss. The carrying amount of the Group’s investment in Prestige Investments Private Limited and PG Industries Zimbabwe Limited on 31 August 2011 was BWP9.6 million. The fair value of the PG shares recognised was BWP9.6 million. These shares were accounted for as financial assets designated at fair value. BWP’000s 2011 2010 14. INVESTMENT PROPERTY Balance at the beginning of the year 3,878 25,851 Exchange rate adjustment 419 195 Disposal (2,314) (20,372) Transfer to property and equipment – (2,257) Additions 38 336 Increase/(decrease) in fair value (Note 3) – 125 Balance at end of the year 2,021 3,878 Rental income recognised in the income statement 1,493 471 Investment property comprises commercial properties that are leased to third parties. The carrying amount of the investment property is at fair value as determined by registered independent valuers every 3 years as applicable. 103
  • 108.
    15. PROPERTY ANDEQUIPMENT BWP’000s Land and buildings Motor vehicles Computer and office equipment Furniture and fittings Total Cost or valuation at prior year 248,600 12,173 87,163 40,239 388,175 Exchange adjustment 36,301 2,548 2,553 4,688 46,090 Additions 83,827 7,539 47,436 35,639 174,441 Revaluations surplus (gross of deferred tax)* 1,833 – – – 1,833 Reclassifications – – 160 (160) – Disposals (158) (506) (3) (204) (871) Cost or valuation at 31 December 2011 370,403 21,754 137,309 80,202 609,668 Accumulated depreciation at December 2010 (9,107) (6,276) (31,093) (11,481) (57,957) Exchange adjustment (457) (576) (3,379) (1,109) (5,521) Disposals 98 372 (3) 91 558 Reclassifications – – 959 (812) 147 Charge for the year (6,743) (2,135) (17,608) (5,529) (32,015) Accumulated depreciation at 31 December 2011 (16,209) (8,615) (51,124) (18,840) (94,788) Carrying amount at 31 December 2011 354,194 13,139 86,185 61,362 514,880 Cost or valuation at prior year 219,576 10,039 61,908 25,111 316,634 Exchange adjustment (3,907) (701) (3,383) 1,411 (6,580) Additions 29,556 3,441 36,227 13,767 82,991 Revaluations deficit (gross of deferred tax) 1,118 – – – 1,118 Transfer from Investment property 2,257 – – – 2,257 Disposals – (606) (7,589) (50) (8,245) Cost or valuation at 31 December 2010 248,600 12,173 87,163 40,239 388,175 Accumulated depreciation at December 2009 (3,636) (4,818) (21,033) (8,172) (37,659) Exchange adjustment 205 (116) 3,139 449 3,677 Disposals – 527 – – 527 Charge for the year (5,676) (1,869) (13,199) (3,758) (24,502) Accumulated depreciation at 31 December 2010 (9,107) (6,276) (31,093) (11,481) (57,957) Carrying amount at 31 December 2010 239,493 5,897 56,070 28,758 330,218 * Land and buildings are revalued by independent professional valuers based on open market value every 3 years. In the current year, certain land and buildings in Botswana were revalued at BWP27.9 million. The carrying cost of this land and buildings had the revaluation not been done would have been BWP26 million. BWP’000s 2011 2010 Carrying amount of revalued land and buildings had it not been revalued, including exchange differences 193,285 120,351 Notes to the financial statements continued ABC Holdings Limited ANNUAL REPORT 2011104
  • 109.
    BWP’000s 2011 2010 16.DEFERRED TAX Balance at the beginning of the year 5,720 6,694 Exchange adjustment 2,419 1,213 Income statement charge (Note 5) 45,336 (370) Deferred tax on amounts charged to equity (369) (1,817) 53,106 5,720 Disclosed as follows: Deferred tax asset 62,826 20,953 Deferred tax liability (9,720) (15,233) 53,106 5,720 Tax effects of temporary differences: Accruals (1,848) 2,693 Impairment losses 16,476 483 Property and equipment (8,889) (6,715) Unrealised losses/(gains) on investment 1,272 (984) Unearned income 6,876 704 Revaluation surplus (716) (2,920) Tax losses 39,935 12,459 53,106 5,720 17. INTANGIBLE ASSETS Goodwill 32,544 32,544 Software 97,818 24,858 130,362 57,402 Goodwill Cost 67,342 67,342 Impairments losses (34,798) (34,798) Carrying amount at the end of the year 32,544 32,544 Software Cost Balance at the beginning of the year (software) 41,791 34,161 Exchange rate adjustment 15,000 (5,457) Additions 80,575 13,087 137,366 41,791 Amortisation Balance at the beginning of the year (16,933) (16,284) Exchange rate adjustment (6,731) 4,326 Amortisation charge (Note 4) (15,884) (4,975) (39,548) (16,933) Carrying amount at the end of the year 97,818 24,858 105
  • 110.
    17. INTANGIBLE ASSETS(continued) The impairment test of goodwill is based on assumptions that take into account risk and uncertainty. The impairment test makes a number of assumptions regarding projected cashflows, considering local market conditions and management’s judgement of future trends. The most significant goodwill arises from the Zimbabwe operations. The key assumptions used in the impairment test of the Zimbabwe operations are as follows: • Projected compounded free cash flows growth of 26% per annum for 5 years, (2010: 20% per annum for 5 years) • Terminal value based on 5% long-term cash flow growth rate, (2009: 5%) • Weighted average cost of capital of 11.24%, (2010: 18.41%) Management determined free cash flows, residual value and growth rates based on past performance and its expectations of market developments. The discount rates are pre-tax and reflect specific risks relating to the operation. The weighted average cost of capital has been impacted by movements in the Botswana Stock Exchange all share index and also the increased borrowings at lower rates than the older loans. BWP’000s 2011 2010 18. DEPOSITS Deposits from banks 557,228 618,267 Deposits from other customers 6,817,472 4,288,718 Deposits under repurchase agreements – 60 7,374,700 4,907,045 Payable on demand Corporate customers 2,221,361 1,146,908 Public Sector 321,993 105,696 Retail customers 446,355 151,687 Other financial institutions 191,659 29,664 Banks 169,287 405,299 3,350,655 1,839,254 Term deposits Corporate customers 975,023 1,226,249 Public sector 1,927,913 1,148,080 Retail customers 107,862 176,441 Other financial institutions 625,306 304,053 Banks 387,941 212,968 4,024,045 3,067,791 7,374,700 4,907,045 Geographical analysis Botswana 2,563,126 1,810,308 Mozambique 1,216,349 836,104 Tanzania 1,060,686 795,640 Zambia 548,120 252,961 Zimbabwe 1,986,419 1,065,048 Other – 146,984 7,374,700 4,907,045 Notes to the financial statements continued ABC Holdings Limited ANNUAL REPORT 2011106
  • 111.
    BWP’000s 2011 2010 19.BORROWED FUNDS Convertible bond 84,619 – Other borrowed funds 897,169 579,420 981,788 579,420 (a) Convertible bond Face value of convertible bond issued on 13th May 2011 88,787 – Derivative component (note 21.2) (19,367) – Liability component on initial recognition 69,420 – Interest expense 7,209 – Upfront loan arrangement fees (728) – Interest paid (1,368) – Exchange rate movement 10,086 – 84,619 – During the year, the Group issued a US Dollar denominated convertible loan to International Finance Corporation (IFC) for US$13.5 million. The loan attracts interest of 6 months LIBOR + 3.75% per annum, payable semi-annually and it is convertible at IFC’s option as follows: • BWP3.15 per share at any time during the period from 13th May 2011 to 12th May 2012; • BWP3.24 per share at any time during the period from 13th May 2012 to 12th May 2013; or • If at any time during the conversion period, the Group raises additional capital, a price equal to the price of the shares issued as part of such a capital raising exercise. The redemption dates for the principal amount are as follows: 15th Mar 2013 – US$3,500,000 15th Sep 2013 – US$3,500,000 15th Mar 2014 – US$3,500,000 15th Sep 2014 – US$3,048,969 The carrying amount of this convertible loan approximates its fair value at 31 December 2011. (b) Other borrowed funds National Development Bank of Botswana Limited 125,212 121,080 BIFM Capital Investment Fund One (Pty) Ltd 255,862 257,328 Afrexim Bank 209,262 – Standard Chartered Bank Botswana Limited 113,325 96,721 Other 193,508 104,291 897,169 579,420 Fair value National Development Bank of Botswana Limited 152,466 124,961 BIFM Capital Investment Fund One (Pty) Ltd 315,169 322,630 Afrexim Bank 209,262 – Standard Chartered Bank Botswana Limited 113,325 96,721 Other 193,508 104,291 983,730 648,603 107
  • 112.
    19. BORROWED FUNDS(continued) National Development Bank of Botswana Limited (NDB) The loan from National Development Bank of Botswana is denominated in Japanese Yen and attracts interest at 3.53% per annum. Principal and interest is payable semi-annually on 15 June and 15 December. The loan matures on 15 December 2016. BIFM Capital Investment Fund One (Pty) Ltd The loan from BIFM Capital Investment Fund One (Pty) Ltd is denominated in Botswana Pula and attracts interest at 11.63% per annum, payable semi annually. The redemption dates for the principal amount are as follows: 30 September 2017 – BWP62,500,000 30 September 2018 – BWP62,500,000 30 September 2019 – BWP62,500,000 30 September 2020 – BWP62,500,000 Afrexim Bank Limited This is a US$50 million trade finance facility availed to the Group on a one year renewable basis by Afrexim Bank Limited from September 2011. The Group had utilised US$28 million of this facility at 31 December 2011. It attracts interest at LIBOR + 4% and it is repayable on the earlier of when the underlying customers funded repay their respective loans or within one year, but with a provision to extend it for another one year period. Standard Chartered Bank Botswana Limited This is a US$15 million one year facility issued to BancABC Botswana by Standard Chartered Bank Botswana Limited. The loan was initially granted on 22 June 2006 and has been renewed annually ever since. It matures on 30 June 2012. It attracts interest of LIBOR + 3.39% and it is secured by Bank of Botswana Certificates amounting to BWP109 million. Other borrowings Other borrowings relate to medium- to long-term funding from international financial institutions for onward lending to BancABC clients. Fair value is equivalent to carrying amounts as these borrowings have variable interest rates. BWP’000s 2011 2010 Maturity analysis On demand to one month 4,458 1,276 One to three months 14,909 7,615 Three months to one year 380,122 82,862 Over one year 582,299 487,667 981,788 579,420 20. CREDITORS AND ACCRUALS Accrued expenses 49,970 50,756 Other amounts due 80,457 13,261 130,427 64,017 Notes to the financial statements continued ABC Holdings Limited ANNUAL REPORT 2011108
  • 113.
    21. DERIVATIVE FINANCIALINSTRUMENTS 2011 2010 BWP’000s Assets Liabilities Assets Liabilities Cross-currency interest rate swaps 26,197 – 19,464 – Convertible bond option – 46,852 – – Forward foreign exchange contracts – held for trading 6,140 217 22,548 1,047 32,337 47,069 42,012 1,047 21.1 Cross-currency interest rate swaps The Group uses cross-currency rate swaps to manage its exposure to foreign currency and interest rate risk. These instruments are transacted for both hedging and non-hedging activities. These instruments result in an economic exchange of currencies and interest rates. An exchange of principal takes place for all cross-currency interest rate swaps. The Group’s credit risk exposure represents the potential cost to replace the swap contracts if counterparties fail to fulfil their obligation. To control the level of credit risk taken, the Group assesses counterparties using the same technique as for its lending activities. The notional amounts of the financial instruments provide a basis of comparison with instruments recognised on the balance sheet but do not necessarily indicate the amounts of future cash flows or the current fair value of the instruments and, therefore, do not indicate Group’s exposure to credit or price risks. The derivative financial instruments become favourable (assets) or unfavourable (liabilities) as a result of fluctuations in the market interest rates or foreign exchange rates relative to their terms. The aggregate contractual or notional amount of derivative financial instruments on hand, the extent to which instruments are favourable or unfavourable, and thus the aggregate fair values of derivative financial assets and liabilities, can fluctuate significantly from time to time. The fair values of derivative financial instruments held are set out below: BWP’000s Notional amount Fair value At 31 December 2011 Cross currency interest rate swaps Designated at fair value through profit and loss 125,212 26,197 Total recognised derivatives 26,197 Comprising: Derivative financial assets 26,197 Derivative financial liabilities – At 31 December 2010 Cross currency interest rate swaps Designated at fair value through profit and loss 122,087 19,464 Total recognised derivatives 19,464 Comprising: Derivative financial assets 19,464 Derivative financial liabilities – 109
  • 114.
    BWP’000s 2011 2010 21.DERIVATIVE FINANCIAL INSTRUMENTS (continued) 21.2 Convertible bond option Value on initial recognition on 13th May 2011 19,367 – Fair value loss 27,485 – 46,852 – The convertible bond option is in relation to the IFC convertible loan issued by the Group on 13th May 2011. See also note 19. The key assumptions in the valuation of the conversion option were as follows: –  ABCH share price at year-end of BWP4.55 –  Volatility of 35% (ABCH share price and US dollar) –  Spot exchange rate – BWP7.47/US$ – Forward foreign exchange rates for first 12 months obtained from Bloomberg and were extended beyond 12 months by extrapolating at a constant growth rate –  Credit spread of 3.75% above LIBOR – Conversion price of BWP3.24 used –  Dividend yield of 3% assumed Sensitivity: a change in volatility from 35% to 48% results in a BWP5 million change in the fair value of this derivative. 21.3 Forward foreign exchange contracts The notional amounts of outstanding forward foreign exchange contracts at 31 December 2011 were BWP977 million (2010: BWP364 million). These result in derivative financial assets of BWP6.1 million (2010: BWP22.5 million) and derivative financial liabilities of BWP0.2 million (2010: BWP1 million) BWP’000s 2011 2010 22. STATED CAPITAL 22.1 Authorised 150 000 000 shares of BWP0.05 each 7,500 7,500 22.2 Issued and fully paid 149 472 131 (2010: 146 419 524) shares of BWP0.05 each 7,474 7,320 Share premium 309,118 300,266 Total Company 316,592 307,586 Total Group 316,592 307,586 BWP’000s Share capital Share premium Total At 1 January 2010 and 2011 7,320 300,266 307,586 Issue of shares 154 8,852 9,006 At 31 December 2011 7,474 309,118 316,592 The holders of ordinary shares are entitled to receive a dividend as declared from time to time and are entitled to one vote per share at the annual general meeting of the Company. Treasury shares comprise the cost of the Company’s own shares held by subsidiaries. As at 31 December 2011, there were no treasury shares held within the Group (2010: 2,370,657 ). Notes to the financial statements continued ABC Holdings Limited ANNUAL REPORT 2011110
  • 115.
    BWP’000s 2011 2010 23.FUNDS UNDER MANAGEMENT Funds under management 368,977 240,759 The Group provides asset management and unit trusts activities to pension funds, individuals, trusts and other institutions, whereby it holds and manages assets. The Group receives a management fee for providing these services. The Group is not exposed to any credit risk relating to such placements. 24. EMPLOYEE BENEFITS The Group uses a combination of externally administered defined contribution schemes and, where there is a mandatory requirement, state social security schemes. Both the employee and employer contribute to these schemes. The Group does not operate any defined benefit scheme. Amounts recognised in expenses have been disclosed in Note 4.1 25. RELATED PARTY TRANSACTIONS Related party transactions are a normal feature of business and are disclosed in terms of IAS 24. Related party transactions may affect the assessment of operations, risk and opportunity facing the organisation. ABC Holdings Limited is the holding company in the ABC Group. Subsidiary companies and associates ABC Holdings Limited and its subsidiaries entered into various financial services contracts with fellow subsidiaries and associates during the year. These transactions are entered into in the normal course of business, under terms that are no more favourable than those arranged with third parties. Loans to associates as at 31 December 2011 amounted to BWP8.6 million (2010: BWP9.6 million) which represents 1.4% (2010: 2%) of shareholders’ funds, and 0.1% (2010: 0.3%) of gross loans. In addition, financial assets designated at fair value include an investment in debentures issued by PG Industries (Zimbabwe) valued at BWP14 million (2010: BWP11 million). ABC Consulting and Management Services Limited has entered into management services agreements with Group companies on an arm’s length basis. Details of disclosures of investments in subsidiaries are set out in note 15 of the separate Company financial statements. Details of associate companies are set out in note 13 of the consolidated Group financial statements. Shareholders During the year, the Group invested in ADC Enterprises Limited which is a 100% subsidiary of African Development Corporation (ADC). ADCE in turn is invested in a syndicated special purpose entity which, with the funds of other investors, is held to invest in a foreign bank. ADC is a significant shareholder of the Group. The investment balance as at 31 December 2011 was BWP75 million and has been classified as fair value through profit or loss. Directors and officers Emoluments to directors have been disclosed in note 4.2. The list of directors of ABC Holdings is shown on page 39. The total exposure of the Group to directors, officers and parties related to them in terms of IAS 24 as at 31 December 2011 is BWP20.8 million (2010: BWP20.4 million) which represents 3% (2010: 5%) of shareholders’ funds. Particulars of lending transactions entered into with directors or their related companies that have given rise to exposure on the balance sheet as at the end of the year are as follows: 111
  • 116.
    25. RELATED PARTYTRANSACTIONS (continued) 2011 2010 BWP‘000s Balance Interest Balance Interest Loans and advances to entities related through shareholding: PG Industries (Botswana) Limited 8,626 1,405 9,615 195 Star Africa Corporation – – – 738 8,626 1,405 9,615 933 Loans and advances to entities related to directors: Loans and advances to entities related to N Kudenga 4,604 531 174 64 Loans and advances to entities related to FM Dzanya 435 17 921 2 5,039 548 1,095 66 Loans and advances to directors: D T Munatsi 2,237 218 2,982 255 F Dzanya 7,079 612 6,624 734 B Moyo 3,849 303 3,040 392 13,165 1,133 12,646 1,381 Loans and advances to key management: H Matemera – 198 4,746 462 B Mudavanhu 2,586 121 1,885 49 2,586 319 6,631 511 Financial assets designated at fair value held with entities related through shareholding: Listed debentures: PG Industries (Zimbabwe) Limited – – 11,006 – – – 11,006 – Deposits held by entities related to directors and key management: D Khama – Doreen Khama Attorneys Trust Account 9,460 93 5,833 206 Kudenga Company Chartered Accountants 7 – – – Deposits from entities related to F Dzanya 801 – – – Deposits from entities related to D T Munatsi – – 6 – 10,268 – 5,839 206 Deposits held by directors and key management: N Kudenga 57 – – – F Dzanya 44 – 32 – B Moyo 6 – 73 – H Matemera – – 10 – D Khama 571 – 2,666 181 D T Munatsi 250 – 70 1 928 – 2,851 182 Remuneration to key management personnel: Short-term employment benefits 15,455 13,264 Post-employment benefits 1,241 1,296 Discount on shares issued 934 – 17,630 14,560 All loans bear interest and fees at rates applicable to similar exposures to third parties. The Group assists officers and employees in respect of housing, motor vehicle and personal loans at subsidised rates in some instances. Consistent policies and processes govern the granting and terms of such loans. In 2011, PG Industries (Zimbabwe) Limited ceased to be an associate of the Group. Notes to the financial statements continued ABC Holdings Limited ANNUAL REPORT 2011112
  • 117.
    26. EXCHANGE RATES ClosingAverage Closing Average Dec 11 Dec 11 Dec 10 Dec 10 United States Dollar 0.134 0.146 0.155 0.147 Tanzanian Shilling 212.345 231.829 233.427 210.117 Zambian Kwacha 682.442 711.427 744.484 707.889 Mozambican Metical 3.647 4.194 5.053 4.994 South African Rand 1.083 1.059 1.028 1.080 BWP’000s 2011 2010 27. COLLATERAL 27.1 Liabilities for which collateral is pledged Deposits from banks 207,127 46,156 Deposits from customers 343,579 63,732 Borrowed funds 108,560 116,860 659,266 226,748 Assets pledged to secure these liabilities are carried at amortised cost and are included under the following: Cash and short-term funds 20,515 – Bankers’ acceptances 405,221 – Financial assets held for trading 233,530 233,868 659,266 233,868 These transactions are conducted under terms that are usual and customary to standard lending and borrowing activities. 27.2 Collateral accepted as security for assets Deposits from customer 290,517 402,840 Mortgage bonds, inventory, plant and equipment, shares, letter of undertaking 1,494,989 1,428,452 1,785,506 1,831,292 ABC Holdings Limited is obliged to return equivalent securities. The Group is not permitted to sell or repledge collateral in the absence of default. These transactions are conducted under terms that are usual and customary to standard lending and borrowing activities. 28. ORDINARY DIVIDENDS Dividend of 10 Thebe per share paid on 12th April 2011 to shareholders on the register on 1st April 2011 14,642 – Dividend of 7 Thebe per share paid on 16th September 2011 to shareholders on the register on 2nd September 2011 10,519 – 25,161 – The Board of Directors proposed a gross final dividend in respect of the year ended 31 December 2011 of 10.5 Thebe per ordinary share. This will bring the full year dividend to 17.5 Thebe per share. 113
  • 118.
    29. ACQUISITIONS ANDDISPOSAL OF ASSOCIATE COMPANIES During 2011 the Group acquired additional shares in PG Industries (Zimbabwe) for BWP1.7 million. Subsequently in August 2011, the Group disposed of its interest in Prestige, an investment company that was housing the PG Industries (Zimbabwe) shares. Each party was then handed over the shares in PG Industries (Zimbabwe) that they were entitled to in full and final settlement of the transaction. During 2010 the Group followed its rights in a rights issue by PG Industries (Botswana) Limited for BWP5.5 million. During 2010 the Group acquired a 2% interest in PG Industries (Zimbabwe) Limited for BWP1.6 million, following the under­ writing of a right issue, and indirectly invested an additional BWP4.2 million by following existing rights. In addition, the Group acquired listed convertible debentures in PG Industries (Zimbabwe) Limited as detailed in note 9. 30. EVENTS AFTER THE REPORTING DATE There were no significant events after the reporting date. 31. RESTATEMENT Comparative numbers for interest income and interest expense were restated by BWP55.62 million respectively to eliminate interest on transactions between subsidiaries. The restatement had no impact on income before and after tax, or on equity. The restatement is summarised as follows: BWP’000 Previously stated Restated Interest and similar income 650,466 594,837 Interest expense and similar charges (352,621) (296,992) 297,845 297,845 ABC Holdings Limited ANNUAL REPORT 2011114
  • 119.
    COMPANY SEPARATE FINANCIAL STATEMENTS 116 Companyincome statement 116 Company statement of comprehensive income 117 Company balance sheet 118 Company statement of changes in equity 119 Company cash flow statement 120 Notes to the Company financial statements 115
  • 120.
    for the yearended 31 December 2011for the year ended 31 December 2011 for the year ended 31 December 2011 company income statement company statement of comprehensive income BWP’000s Notes 2011 2010 Interest and similar income 110,153 102,202 Interest expense and similar charges (77,918) (56,748) Net interest income 1 32,235 45,454 Non-interest income 2 63,564 56,056 Other impairments 3 – (4,340) Total income 95,799 97,170 Operating expenditure 4 (78,821) (83,923) Profit before tax 16,978 13,247 Tax 5 122 (633) Profit for the year 17,100 12,614 BWP’000s 2011 2010 Profit for the year 17,100 12,614 Total comprehensive income for the year 17,100 12,614 ABC Holdings Limited ANNUAL REPORT 2011116
  • 121.
    BWP’000s Notes 20112010 ASSETS Cash and short-term funds 6 5,102 22,660 Financial assets designated at fair value 17 152,115 64,028 Derivative financial assets 16 26,316 19,464 Loans and advances 7 281,111 193,370 Inter-company balances 8 77,652 58,433 Investment securities 9 42,172 38,502 Prepayments and other receivables 10 7,577 18,607 Property and equipment 11 263 790 Deferred tax assets 12 15,017 10,002 Loans to subsidiary companies 13 177,547 158,053 Intangible assets 14 215 – Investment in subsidiaries 15 680,626 602,077 TOTAL ASSETS 1,465,713 1,185,986 EQUITY AND LIABILITIES Liabilities Derivative financial liabilities 16 46,971 – Creditors and accruals 18 9,110 6,147 Inter-company balances 8 482,884 449,064 Borrowed funds 19 615,201 427,028 Total liabilities 1,154,166 882,239 Equity Stated capital 20 316,592 307,586 Distributable reserves (5,045) (3,839) Equity attributable to ordinary shareholders 311,547 303,747 EQUITY AND LIABILITIES 1,465,713 1,185,986 as at 31 December 2011 company balance sheet 117
  • 122.
    for the yearended 31 December 2011 BWP’000s Stated capital Treasury share reserve Distributable reserves Total equity Balance as at 31 December 2009 307,586 – (16,453) 291,133 Comprehensive income:   Profit for the year – – 12,614 12,614 TOTAL COMPREHENSIVE INCOME – – 12,614 12,614 Balance as at 31 December 2010 307,586 – (3,839) 303,747 Comprehensive income:   Profit for the year – – 17,100 17,100 TOTAL COMPREHENSIVE INCOME – – 17,100 17,100 Transactions with owners:   Shares issued 9,006 – – 9,006   Dividends paid during the year – – (25,161) (25,161)   Acquisition of treasury shares from subsidiary – (2,371) 2,371 –   Disposal of treasury shares – 2,371 4,484 6,855 Balance as at 31 December 2011 316,592 – (5,045) 311,547 company statement of changes in equity ABC Holdings Limited ANNUAL REPORT 2011118
  • 123.
    BWP’000s 2011 2010 CASHFLOWS FROM OPERATING ACTIVITIES (98,146) 149,638 Cash generated from operating activities 34,654 16,116 Net profit before tax 16,978 13,247 Adjusted for: Other impairments – 4,340 Depreciation and amortisation 554 254 Net losses/(gains) on derivative financial instruments 17,122 (1,725) Tax paid (4,893) (1,166) 29,761 14,950 Net increase in operating funds (127,907) 134,688 Increase in operating assets (211,661) (183,084) Increase in operating liabilities 83,754 317,772 CASH FLOWS FROM INVESTING ACTIVITIES (98,285) (135,194) Purchase of intangible assets (619) (806) Proceeds on disposal of property and equipment 377 – Investment in subsidiaries (78,549) (118,759) Changes in loans to subsidiaries (19,494) (15,629) CASH FLOWS FROM FINANCING ACTIVITIES 178,873 8,165 Increase in borrowed funds 188,173 8,165 Proceeds from issue of shares 9,006 – Proceeds from issue of treasury shares 6,855 – Dividend paid (25,161) – (Decrease)/Increase in cash and cash equivalents (17,558) 22,609 Cash and cash equivalents at the beginning of the year 22,660 51 Cash and cash equivalents at the end of the year 5,102 22,660 for the year ended 31 December 2011 company cash flow statement 119
  • 124.
    for the yearended 31 December 2011 ACCOUNTING POLICIES The accounting policies of the Company and the Group are set out on pages 49 to 63. BWP’000s 2011 2010 1. NET INTEREST INCOME Interest and similar income Cash and short-term funds 238 7,525 Investment securities at amortised cost 3,670 3,670 Loans and advances at amortised cost* 88,556 73,406 Inter-company 17,689 17,601 110,153 102,202 Interest expense Borrowed funds 64,578 42,921 Inter-company 13,340 13,827 77,918 56,748 Net interest income 32,235 45,454 * Interest income includes interest of BWP30.8 million pertaining to an individually impaired exposure. In terms of a loan syndication agreement with BancABC Zimbabwe, a portion of the exposure arising from this interest accrual was sold to BancABC Zimbabwe, and subsequently impaired. In the consolidated financial statements, BWP14.5 million of this interest income was eliminated against the impairment charge processed by BancABC Zimbabwe. 2. NON-INTEREST INCOME (Losses)/gains from trading activities: (9,526) 7,082 –  Designated at fair value 7,596 5,357 –  Net (losses)/gains on derivative financial instruments* (17,122) 1,725 Dividends received: 72,967 37,456 –  Subsidiary companies 72,967 37,456 Fee and commission income: 2,570 9,600 –  Net fee and commission income 2,570 9,600 Other non-interest income: (2,447) 1,918 Rentals and other income – – Foreign exchange income and currency revaluation** (2,447) 1,918 63,564 56,056 * Net (losses)/gains on derivative financial instruments include net gains of BWP10 million arising from the USD:Japanese Yen derivative swap, and net losses of BWP27 million arising from the derivative convertion option included in the IFC convertible loan (note 19). ** Foreign exchange income includes a foreign exchange loss of BWP26 million (2010: loss of BWP10.7 million) arising from the Japanese Yen exposure with NDB, disclosed in note 19. Net gain/(losses) on derivative financial instruments includes an offsetting fair value gain arising from an equal but opposite nominal Japanese Yen derivative asset. 3. OTHER IMPAIRMENTS Impairment of investment in subsidiaries EDFUND S.A. – 4,340 4,340 notes to the company financial statements ABC Holdings Limited ANNUAL REPORT 2011120
  • 125.
    BWP’000s 2011 2010 4.OPERATING EXPENDITURE Inter-company management fees 50,175 59,103 Administrative expenses 5,922 5,362 Staff costs 5,532 7,464 Auditors’ remuneration 1,618 1,110 Depreciation (note 11) 150 254 Amortisation of software (note 14) 404 – Directors’ remuneration 15,020 10,630 78,821 83,923 5. TAX Profit before tax 16,978 13,247 Income tax using standard corporate tax rate 2,531 1,987 Tax exempt revenues (10,945) (5,618) Non-deductible expenses 16 617 Tax on dividends received 4,893 1,165 Tax losses of prior years not claimed 3,383 2,482 Tax (income)/expense per income statement (122) 633 Effective tax rate 1% (5%) 5.1 Current tax expense Deferred tax Tax losses (5,015) (532) Current tax Tax on dividends received 4,893 1,165 Total tax (income)/expense per income statement (122) 633 6. CASH AND SHORT-TERM FUNDS Balances with banks 5,102 22,660 Balances with banks include bank accounts with group companies that total BWP552 thousand. These accounts are maintained to make dividend payments. 7. LOANS AND ADVANCES Corporate lending 267,946 165,570 Other* 13,165 27,800 281,111 193,370 Less: Allowance for impairments – – Net loans and advances 281,111 193,370 * Related party loans and advances included in the above are set out in note 21. The fair value of net loans and advances approximates their carrying amount. 7.1 Maturity analysis On demand to one month 2,658 135,389 One month to three months 2,249 40,410 Three months to one year 263,040 2,430 Greater than one year 13,164 15,141 281,111 193,370 121
  • 126.
    BWP’000s 2011 2010 7.LOANS AND ADVANCES (continued) 7.2 Impairment of loans and advances –  Movement analysis Opening balance – 6,674 Exchange rate adjustment – (94) Bad debts written off – (6,580) Impairments created – – Closing balance – – The loans all have floating interest rates which range from 8.5% to 19.6% (2010: 9.75% to 43%). The loans are denominated in Botswana Pula and United States Dollars. BWP’000s 2011 Fair value 2010 Fair value 8. INTER-COMPANY BALANCES 8.1 Balances due from: BancABC Zambia Limited – – 4,541 4,541 ABCH Management Support Services (Pty) Ltd and other non-banking subsidiaries* 77,652 77,652 53,892 53,892 77,652 77,652 58,433 58,433 8.2 Balances due to: BancABC Botswana Limited 266,662 266,662 157,192 157,192 BancABC Mozambique Sarl 20,458 20,458 109,840 109,840 BancABC Tanzania Limited 44,710 44,710 66,745 66,745 BancABC Zambia Limited 9,633 9,633 – – BancABC Zimbabwe, Second Nominees and Capital Partners 97,524 97,524 71,423 71,423 EDFUND S.A. 43,799 43,799 37,713 37,713 Tanzania Development Finance Company Limited 98 98 6,151 6,151 482,884 482,884 449,064 449,064 * The amount includes an interest free loan of BWP35.7 million (2010: BWP37.4 million) pertaining to ABCH Management Support Services (Pty) Ltd, (ABC South Africa). The loan has no fixed terms of repayment. In addition, the amount includes a loan of BWP18.8 million (2010: nil) to Kendra (Pvt) Ltd, (a group company in Zambia). As the entity reflects a negative net asset value of BWP4.7 million at 31 December 2011, ABC Holdings committed to provide financial support to the entity to enable it to carry on its operations as a going concern and to meet its obligations as and when they fall due in the foreseeable future. Inter-company balances are generally short-term placements or borrowings at prevailing market rates. The balances are denominated in Botswana Pula: -BWP242.5 million (2010: -BWP164.3 million); United States Dollars: -BWP256.2 million (2010: -BWP276.2 million); South African Rands: BWP13.5 million (2010: BWP49.1 million); and Euro nil (2010: 0.8 million). Notes to the Company financial statements continued ABC Holdings Limited ANNUAL REPORT 2011122
  • 127.
    BWP’000s 2011 2010 9.INVESTMENT SECURITIES Held-to-maturity –  Promissory notes 42,172 38,502 The promissory notes are partial security for the loan from BIFM (Note 19). The promissory notes earn a fixed interest of 10.25% p.a., and are redeemable on 31 March 2015. The fair value of the promissory notes has not been determined as the promissory notes are specifically conditional to the terms of the BIFM loan referred to in note 19. 10. PREPAYMENTS AND OTHER RECEIVABLES Accounts receivable and prepayments 2,219 3,985 Security deposit 3,744 3,224 Other amounts due 1,614 11,398 7,577 18,607 All prepayments and other receivables are classified as current. 11. PROPERTY AND EQUIPMENT BWP’000s Computer and office equipment Furniture and fittings Total Cost or valuation at 31 December 2010 977 267 1,244 Disposals (619) – (619) Cost or valuation at December 2011 358 267 625 Accumulated depreciation at December 2010 (445) (9) (454) Disposals 242 – 242 Charge for the year (97) (53) (150) Accumulated depreciation at December 2011 (300) (62) (362) Carrying amount at December 2011 58 205 263 Cost or valuation at 31 December 2009 438 – 438 Additions 539 267 806 Cost or valuation at December 2010 977 267 1,244 Accumulated depreciation at December 2009 (200) – (200) Charge for the year (245) (9) (254) Accumulated depreciation at December 2010 (445) (9) (454) Carrying amount at December 2010 532 258 790 BWP’000s 2011 2010 12. DEFERRED TAX Balance at the beginning of the year (10,002) (9,470) Income statement charge (note 5) (5,015) (532) Balance at the end of the year (15,017) (10,002) Tax effect of temporary differences: –  Property and Equipment (32) – –  Unrealised gain on investments (3,306) – –  Tax losses (11,679) (10,002) (15,017) (10,002) 123
  • 128.
    BWP’000s 2011 2010 13.LOANS TO SUBSIDIARY COMPANIES BancABC Botswana Limited 70,614 65,902 BancABC Zambia Limited 53,804 46,058 BancABC Mozambique Sarl 53,129 46,093 177,547 158,053 The loans are 13 year loans provided to subsidiaries as Tier II capital. Interest ranges from 10% to 12.5% and is payable half yearly. The loans mature between 2020 and 2021. The loans are denominated in Botswana Pula: BWP32 million (2010: BWP32 million) and United States Dollars: BWP146.9 million (2010: BWP126.1 million). 14. INTANGIBLE ASSETS Cost Additions 619 – 619 – Amortisation Amortisation charge (note 4) (404) – (404) – Carrying amount at the end of the year 215 – 15. Investment in subsidiaries Ownership of ordinary shares Carrying value 2011 2010 2011 2010 Nature of business % % BWP’000s BWP’000s Botswana BancABC Botswana Limited Registered bank 100 100 89,641 52,241 Bohemian Private Limited Investment holding company 100 100 4,000 4,000 Capital Partners Private Limited Investment holding company 100 100 2,019 2,019 Mozambique BancABC Mozambique Sarl Registered bank 100 100 68,050 68,050 South Africa ABCH Management Support Services (Proprietary) Limited Management services 100 100 – – Tanzania BancABC Tanzania Limited Registered bank 94* 94* 128,397 128,397 Tanzania Development Finance Company Limited Financial services 68 68 15,949 15,949 Zambia BancABC Zambia Limited Registered bank 100 100 82,486 78,776 Zimbabwe BancABC Zimbabwe Limited Registered merchant bank, Stockbroking and Asset Management 100 100 248,049 210,610 Luxembourg EDFUND S.A.** Management services 100 100 42,035 42,035 680,626 602,077 * Effective shareholding. ** In 2009 the investment in EDFUND S.A. was impaired by BWP2.6 million as the carrying amount exceeded the net asset value, and the entity does not generate income. In 2010, the investment was further impaired by BWP4.3 million. Notes to the Company financial statements continued ABC Holdings Limited ANNUAL REPORT 2011124
  • 129.
    16. DERIVATIVE FINANCIALINSTRUMENTS AND HEDGING ACTIVITIES 2011 2010 Assets Liabilities Assets Liabilities Cross-currency interest rate swaps 26,197 – 19,464 – Convertible bond option – 46,852 – – Forward foreign exchange contracts – held for trading 119 119 – – 26,316 46,971 19,464 – Cross-currency interest rate swaps The Company uses cross currency interest rate swaps to manage the Group’s exposure to foreign currency and interest rate risk. These instruments are transacted for both hedging on Group basis, and non-hedging activities. These instruments result in an economic exchange of currencies and interest rates. An exchange of principal takes place for all cross-currency interest rate swaps. The Company’s credit risk exposure represents the potential cost to replace the swap contracts if counterparties fail to fulfil their obligation. To control the level of credit risk taken, the Company assesses counterparties using the same technique as for its lending activities. The notional amounts of the financial instruments provide a basis of comparison with instruments recognised on the balance sheet but do not necessarily indicate the amounts of future cash flows or the current fair value of the instruments and, there­ fore, do not indicate the Company’s exposure to credit or price risks. The derivative financial instruments become favourable (assets) or unfavourable (liabilities) as a result of fluctuations in the market interest rates or foreign exchange rates relative to their terms. The aggregate contractual or notional amount of derivative financial instruments on hand, the extent to which instruments are favourable or unfavourable, and thus the aggregate fair values of derivative financial assets and liabilities, can fluctuate significantly from time to time. The fair values of derivative financial instruments held are set out below: BWP’000s Notional amount Fair value At 31 December 2011 Cross-currency interest rate swaps: Designated at fair value through profit and loss 125,212 26,197 Total recognised derivatives 26,197 At 31 December 2010 Cross-currency interest rate swaps: Designated at fair value through profit and loss 121,080 19,464 Total recognised derivatives 19,464 BWP’000s 2011 2010 16.1 Convertible bond option Value on initial recognition on 13th May 2011 19,367 – Fair value loss 27,485 – 46,852 – For details of the assumptions taken in valuing the convertible option and the sensitivity thereof, please refer to note 21.2 in the Group financial statements. 16.2 Forward foreign exchange contracts The notional amounts of outstanding forward foreign exchange contracts at 31 December 2011 were BWP14.4 million (2010: nil). 125
  • 130.
    BWP’000s 2011 2010 17.FINANCIAL ASSETS DESIGNATED AT FAIR VALUE Unlisted debentures 152,115 64,028 The unlisted debentures comprise of: – investment in 5 year 12% convertible debentures issued by Star Africa Corporation Limited, convertible at the option of the holder after 2 years, with interest being paid quarterly on 31 March, 30 June, 30 September and 31 December. The balance is denominated in United States dollars. – from October 2011, an investment of US$10 million in a 5 year 10% convertible loan to ADC Enterprises Limited, convertible on maturity or liquidating on the occurance of a specified ‘liquidity event’ in the shareholders agreement, with interest being paid as and when sufficient funds are available from returns earned on the ultimate investment. The balance is denominated in United States Dollars. Both investments are carried at fair value. 18. CREDITORS AND ACCRUALS Accrued expenses 2,825 3,010 Items in transit 3,653 – Other amounts due 2,632 3,137 9,110 6,147 Creditors and accruals are due and payable within twelve months. BWP’000s 2011 Fair value 2010 Fair value 19. BORROWED FUNDS Convertible bond 84,619 84,619 – – Other borrowed funds 530,582 617,142 427,028 496,211 615,201 701,761 427,028 496,211 (a) Convertible bond Face value of convertible bond issued on 13th May 2011 88,787 88,787 – – Derivative component (note 16.1) (19,367) (19,367) – – Liability component on initial recognition 69,420 69,420 – – Interest expense 7,209 7,209 – – Upfront loan arrangement fees (728) (728) – – Interest paid (1,368) (1,368) – – Exchange rate movement 10,086 10,086 – – 84,619 84,619 – – During the year, the Group issued a US Dollar denominated convertible loan to International Finance Corporation (IFC) for US$13.5 million. The loan attracts interest of 6 months LIBOR + 3.75% per annum, payable semi-annually and it is convertible at IFC’s option as follows: – BWP3.15 per share at any time during the period from 13th May 2011 to 12th May 2012; – BWP3.24 per share at any time during the period from 13th May 2012 to 12th May 2013; or – if at any time during the conversion period, the Group raises additional capital, a price equal to the price of the shares issued as part of such a capital raising exercise. The redemption dates for the principal amount are as follows: 15th March 2013 – US$3,500,000 15th September 2013 – US$3,500,000 15th March 2014 – US$3,500,000 15th September 2014 – US$3,048,969 Notes to the Company financial statements continued ABC Holdings Limited ANNUAL REPORT 2011126
  • 131.
    BWP’000s 2011 Fairvalue 2010 Fair value 19. BORROWED FUNDS (continued) (b) Other borrowed funds National Development Bank of Botswana Limited 125,212 152,466 121,080 124,961 BIFM Capital Investment Fund One (Pty) Ltd 255,862 315,168 257,328 322,630 Afrexim Bank Limited 112,063 112,063 – – Standard Chartered Bank Botswana Limited 37,445 37,445 32,248 32,248 Other borrowings – – 16,372 16,372 530,582 617,142 427,028 496,211 National Development Bank of Botswana Limited (NDB) The loan from National Development Bank of Botswana is denominated in Japanese Yen and attracts interest at 3.53% per annum. Principal and interest is payable semi-annually on 15 June and 15 December. The loan matures on 15 December 2016. BIFM Capital Investment Fund One (Pty) Ltd The loan from BIFM Capital Investment Fund One (Pty) Ltd is denominated in Botswana Pula and attracts interest at 11.63% per annum, payable semi annually. The redemption dates for the principal amount are as follows: 30 September 2017 – BWP62,500,000        30 September 2018 – BWP62,500,000 30 September 2019 – BWP62,500,000        30 September 2020 – BWP62,500,000 Afrexim Bank Limited This is a US$50 million trade finance facility availed to the Group on a one year renewable basis by Afrexim Bank Limited from September 2011. The Group had utilised US$28 million of this facility at 31 December 2011. It attracts interest at LIBOR + 4% and it is repayable on the earlier of when the underlying customers funded repay their respective loans or within one year, but with a provision to extend it for another one year period. Only the portion related to ABCH has been recognised in the Company financial statements. Standard Chartered Bank Botswana Limited This is a US$15 million one year facility issued to BancABC Botswana by Standard Chartered Bank Botswana Limited. The loan was initially granted on 22 June 2006 and has been renewed annually ever since. It matures on 30th June 2012. It attracts interest of LIBOR + 3.39% and it is secured by Bank of Botswana Certificates amounting to BWP109 million. Only the portion syndicated to ABCH has been recognised in the Company financial statements. Other borrowings Other borrowings relate to medium- to long-term funding from international financial institutions for onward lending to BancABC clients. Fair value is equivalent to carrying amounts as these borrowings have variable interest rates. BWP’000s 2011 2010 19.1 Maturity analysis One month to three months 8,550 7,328 Three months to one year 177,003 10,081 Greater than one year 429,648 409,619 615,201 427,028 127
  • 132.
    2011 2010 20. STATEDCAPITAL 20.1 Authorised 150 000 000 shares of BWP0.05 each 7,500 7,500 20.2 Issued and fully paid 149 472 131 (2010: 146 419 524) shares of BWP0.05 each 7,474 7,320 Share premium 309,118 300,266 Total Company 316,592 307,586 Share capital Share premium Total At 1 January 2010 and 2011 7,320 300,266 307,586 Issue of shares 154 8,852 9,006 At 31 December 2011 7,474 309,118 316,592 The holders of ordinary shares are entitled to receive a dividend as declared from time to time and are entitled to one vote per share at the annual general meetings of the Company. 2011 2010 20.3 Reconciliation of the number of shares in issue Shares at the beginning of the year 146,419,524 146,419,524 Shares issued 3,052,607 – At the end of the year 149,472,131 146,419,524 21. RELATED PARTY TRANSACTIONS Related party transactions are a normal feature of business and are disclosed in terms of IAS 24. Related party transactions may affect the assessment of operations. Subsidiary companies and associates ABC Holdings Limited is the holding company in the ABC Group. ABC Holdings Limited and its subsidiaries entered into various financial services contracts with fellow subsidiaries and associates during the year. These transactions are entered into in the normal course of business, under terms that are no more favourable than those arranged with third parties. Loans to/from subsidiary companies have been disclosed in note 8 and 13 and interest on these in note 1. Dividends received from subsidiaries have been disclosed in note 2. Bank balances with subsidiaries is disclosed in note 6. ABC Consulting and Management Services Limited and ABCH Management Support Services (Pty) Limited have entered into management services agreements with the Company on an arm’s length basis. Details of inter-company management fees incurred during the year have been disclosed on note 4. Details of disclosures of investments in subsidiaries are set out in note 15. Details of associate companies are set out in note 13 of the Group financial statements. Shareholders During the year, the Company invested in ADC Enterprises Limited, which is a 100% subsidiary of African Development Corporation (ADC). ADCE in turn is invested in a syndicated SPE which, with the funds of other investors, is held to invest in a foreign bank. ADC is a significant shareholder of the Group. The investment balance as at 31 December 2011 was BWP75 million and has been classified as fair value through profit or loss. Notes to the Company financial statements continued ABC Holdings Limited ANNUAL REPORT 2011128
  • 133.
    21. RELATED PARTYTRANSACTIONS (continued) Directors and officers Emoluments to directors have been disclosed in note 4. Particulars of other lending transactions entered into with related parties are as follows: 2011 2010 Balance Interest Balance Interest Loans and advances to entities related through shareholding: – – – 738 Star Africa Corporation Limited* – – – 738 Loans and advances to directors: DT Munatsi 2,237 240 2,104 237 F Dzanya 7,079 563 6,624 734 B Moyo 3,849 278 3,040 392 13,165 1,081 11,768 1,363 Loans and advances to key management: H Matemera – 198 3,737 421 – 198 3,737 421 There were no specific impairments on balances with related parties. * The Group disposed of its interest in Star Africa Corporation Limited in the prior year. 129
  • 134.
    BWP’000s 2011 2010 22.OFF-BALANCE SHEET ITEMS 22.1 Contingent liabilities The Company has agreed to provide its subsidiary Kendra (Pvt) Ltd with the required operational and financial support (see note 8 for details) As at 31 December 2011, Kendra (Pvt) Ltd's liabilities exceeded its assets by BWP4.7 million. 22.2 Capital commitments Approved and contracted for the next year ­– – 23. COLLATERAL 23.1 Liabilities for which collateral is pledged Borrowed funds 255,862 257,328 255,862 257,328 Assets pledged to secure these liabilities are carried at amortised cost and are included under the following: Investment securities 42,172 38,502 42,172 38,502 23.2 Collateral accepted as security for assets Mortgage, bonds, inventory and debtors 101,307 – 101,307 – The Company is obliged to return equivalent securities. The Company is not permitted to sell or repledge collateral in the absence of default. These transactions are conducted under terms that are usual and customary to standard lending and borrowing activities. 24. ORDINARY DIVIDENDS Dividend of 10 Thebe per share paid on 12th April 2011 to shareholders on the register on 1st April 2011 14,642 – Dividend of 7 Thebe per share paid on 16th September 2011 to shareholders on the register on 2nd September 2011 10,519 – 25,161 – The Board of Directors proposed a gross final dividend in respect of the year ended 31 December 2011 of 10.5 Thebe per ordinary share. This will bring the full year dividend to about 17.5 Thebe per share. Notes to the Company financial statements continued ABC Holdings Limited ANNUAL REPORT 2011130
  • 135.
    The credit riskmanagement policies of the Company and Group are set out on pages 64 to 71 of the Group financial statements. Maximum exposure to credit risk before collateral held or other credit enhancements The following table presents the maximum exposure to credit risk of balance sheet and off-balance sheet financial instruments, before taking into account any collateral held or other credit enhancements unless such credit enhancements meet offsetting requirements. For financial assets recognised on the balance sheet, the exposure to credit risk equals their carrying amount before deducting impairments. Credit risk exposures relating to on-balance sheet assets are as follows: BWP’000s 2011 2010 Placements with banks 5,102 22,660 Derivative financial assets 26,316 19,464 Financial assets designated at fair value 152,115 64,028 Loans and advances to customers at amortised cost 281,111 193,370 –  Corporate Lending 267,947 165,570 –  Other loans and advances 13,164 27,800 Investment securities 42,172 38,502 –  Promissory notes 42,172 38,502 Loans to subsidiaries 177,547 158,053 Inter-company balances 77,652 58,433 762,015 554,510 Credit quality Loans and advances The following tables reflect broadly, stable credit quality of the Company’s exposures. Distribution of loans and advances by credit quality: BWP’000s 2011 2010 Neither past due nor impaired 189,520 193,370 Individually impaired 91,591 – Gross Loans and Advances 281,111 193,370 Less: Allowance for impairment – – Net Loans and Advances 281,111 193,370 FINANCIAL RISK MANAGEMENT 131
  • 136.
    Financial risk managementcontinued (a) Distribution of loans and advances neither past due nor impaired The credit quality of the portfolio of loans and advances that were neither past due nor impaired can be assessed by reference to the internal rating system adopted below: Internal grade: Performing BWP’000s 31 December 2011 31 December 2010 Corporate lending 176,356 165,570 Other loans and advances 13,164 27,800 189,520 193,370 (b) Loans and advances individually impaired The individually impaired loans and advances before taking into consideration the cash flows from collateral held is BWP91.6 million (2010: nil). The breakdown of the gross amount of individually impaired loans and advances by class, along with the fair value of related collateral held by the Company as security, are as follows: 2011 2010 BWP’000s Individually Impaired Fair value collateral Under- collater- alisation* Individually Impaired Fair value collateral Under- collater- alisation* Corporate Lending 91,591 – 91,591 – – – 91,591 – 91,591 – – – * Individually impaired loans comprise of a single exposure to a corporate export entity in Zimbabwe. No impairment has been raised in the Company financial statements as the carrying amount of the exposure equates to the discounted present value of a repayment plan agreed to with the debtor. Subsequent to the financial year end, BWP43.4 million has been received in terms of this plan. The balance is receivable on 5 May and 30 June 2012. The overdue interest relating to the impaired loan was suspended in full in the Group financial statements. ABC Holdings Limited ANNUAL REPORT 2011132
  • 137.
    Concentration risk offinancial assets with credit risk exposure (a) Geographical sectors The following table breaks down the Company’s main credit exposure at their carrying amounts, as categorised by geographical regions as of 31 December 2011. 2011 BWP’000s Botswana Mozam- bique Tanzania Zambia Zimbabwe Other Total Placements with banks 105 – – – 496 4,501 5,102 Financial assets designated at fair value – – – – 77,125 74,990 152,115 Derivative financial assets – – – – 119 26,197 26,316 Loans and advances 51,313 – – – 229,798 – 281,111 Investment securities 42,172 – – – – – 42,172 Inter-company balances 31,902 – – 18,815 – 26,935 77,652 125,492 – – 18,815 307,538 132,623 584,468 2010 BWP’000s Botswana Mozam- bique Tanzania Zambia Zimbabwe Other Total Placements with banks 50 – – – 19,445 3,165 22,660 Financial assets designated at fair value – – – – 64,028 – 64,028 Derivative financial assets – – – – – 19,464 19,464 Loans and advances 19,356 – – – 168,870 5,144 193,370 Investment securities 38,502 – – – – – 38,502 Inter-company balances 20,622 – – 4,541 – 33,270 58,433 78,530 – – 4,541 252,343 61,043 396,457 133
  • 138.
    Concentration risk offinancial assets with credit risk exposure (b) Industry Sectors The following table breaks down the Group’s main credit exposure at their carrying amounts, as categorised by industry sectors of the counterparties: 2011 BWP’000s Agriculture Construction Wholesale, retail and trade Public sector Manu- facturing Placements with banks – – – – – Financial assets designated at fair value – – 77,125 – – Derivative financial assets – – – – – Loans and advances – – 145,887 – – Investment securities – – – – – Inter-company balances – – – – – – – 223,012 – – 2010 BWP’000s Agriculture Construction Wholesale, retail and trade Public sector Manu- facturing Placements with banks – – – – – Financial assets designated at fair value – – 64,028 – – Derivative financial assets – – – – – Loans and advances 2,067 – – – – Investment securities – – – – – Inter-company balances – – – – – 2,067 – 64,028 – – Financial risk management continued ABC Holdings Limited ANNUAL REPORT 2011134
  • 139.
    2011 Mining and Energy Financial Services TransportIndividuals Tourism Other Total – 5,102 – – – – 5,102 – 74,991 – – – – 152,116 – 26,316 – – – – 26,316 122,061 – – 13,163 – – 281,111 – 42,172 – – – – 42,172 – 77,652 – – – – 77,652 122,061 226,233 – 13,163 – – 584,469 2010 Mining and Energy Financial Services Transport Individuals Tourism Other Total – 22,660 – – – – 22,660 – – – – – – 64,028 – 19,464 – – – – 19,464 135,389 28,115 – 27,799 – – 193,370 – 38,502 – – – – 38,502 – 58,433 – – – – 58,433 135,389 167,174 – 27,799 – – 396,457 135
  • 140.
    Market risk The Companytakes on exposure to market risks, which is the risk that the fair value of future cash flows of a financial instrument will fluctuate because of changes in market prices. Market risks arise from open positions in interest rate, currency and equity products, all of which are exposed to general and specific market movements and changes in the level of volatility of market rates or prices such as interest rate, credit spreads, foreign exchange rates and equity prices. Market and foreign currency exposures related to dealing positions are housed and managed in the Treasury division within a framework of pre-approved dealer, currency and counterparty limits. All trading positions are marked to market as required by IAS 39. Group Risk is responsible for monitoring of limits and pricing, thereby ensuring that any errors or unauthorised transactions are promptly identified. Concentration of currency risk: On-and off-balance sheet financial instruments: 2011 BWP’000s EUR USD BWP ZAR Cash and short-term funds – 3,691 105 1,306 Financial assets designated at fair value – 152,115 – – Loans and advances – 229,797 51,314 – Investment securities – – 42,172 – Prepayments and other receivables 674 6,007 896 – Derivative financial assets* – – 6,091 119 Inter-company balances – 49,264 1,454 26,934 Property and equipment – – 263 – Total Intangible assets – – 215 – Deferred tax assets – – 15,017 – Investment in subsidiaries – 292,104 93,641 – Loans to subsidiaries – 145,866 31,681 – Total assets 674 878,844 242,849 28,359 Derivative financial liabilities* – 151,958 – 119 Creditors and accruals – 6,269 76 2,765 Borrowed funds – 234,128 255,861 – Inter-company balances (116) 225,598 243,980 13,422 Total liabilities (116) 617,953 499,917 16,306 Net on-balance sheet position 790 260,891 (257,068) 12,053 * Notional amounts have been reported in the currency columns and adjustments made in “Other” to arrive at the fair values. Financial risk management continued ABC Holdings Limited ANNUAL REPORT 2011136
  • 141.
    Market risk measurementtechniques The major measurement techniques used to measure and control market risk are outlined below. Foreign Exchange Risk The Company takes on exposure to the effects of fluctuations in the prevailing foreign currency exchange rates on its financial position and cash flows. Group Risk sets limits on the level of exposure by currency and in aggregate for both overnight and intra-day positions, which are monitored daily. The table below summarises the Company’s exposure to foreign currency exchange rate risk at 31 December 2011. Included in the table are the Company’s assets and liabilities at carrying amounts, categorised by currency. 2011 TZS ZMK MZN JPY Other Total – – – – – 5,102 – – – – – 152,115 – – – – – 281,111 – – – – – 42,172 – – – – – 7,577 – – – 125,212 (105,106) 26,316 – – – – – 77,652 – – – – – 263 – – – – – 215 – – – – – 15,017 144,345 82,486 68,050 – – 680,626 – – – – – 177,547 144,345 82,486 68,050 125,212 (105,106) 1,465,713 – – – – (105,106) 46,971 – – – – – 9,110 – – – 125,212 – 615,201 – – – – – 482,884 – – – 125,212 (105,106) 1,154,166 144,345 82,486 68,050 – – 311,547 137
  • 142.
    Concentration of currencyrisk: On-and off-balance sheet financial instruments (continued): 2010 BWP’000s EUR USD BWP ZAR Cash and short-term funds – 22,610 50 – Financial assets designated at fair value – 64,028 – – Loans and advances – 134,294 59,076 – Investment securities – – 38,502 – Prepayments and other receivables – 12,413 6,150 44 Inter-company balances 58 (6,722) 28,825 36,272 Derivative financial assets* – 1,139 4,011 – Property and equipment – – 790 – Deferred tax assets – – 10,002 – Investment in subsidiaries – 254,665 56,241 – Loans to subsidiaries – 158,053 – – Total assets 58 640,480 203,647 36,316 Derivative financial liabilities* – 106,766 – – Creditors and accruals – 3,729 21 2,397 Borrowed funds 758 47,861 257,329 – Inter-company balances (802) 269,519 193,173 (12,826) Total liabilities (44) 427,875 450,523 (10,429) Net on-balance sheet position 102 212,605 (246,876) 46,745 * Notional amounts have been reported in the currency columns and adjustments made in “Other” to arrive at the fair values. Financial risk management continued ABC Holdings Limited ANNUAL REPORT 2011138
  • 143.
    2011 TZS ZMK MZNJPY Other Total – – – – – 22,660 – – – – – 64,028 – – – – – 193,370 – – – – – 38,502 – – – – – 18,607 – – – – – 58,433 – – – 121,080 (106,766) 19,464 – – – – – 790 – – – – – 10,002 144,345 78,776 68,050 – – 602,077 – – – – – 158,053 144,345 78,776 68,050 121,080 (106,766) 1,185,986 – – – – (106,766) – – – – – – 6,147 – – – 121,080 – 427,028 – – – – – 449,064 – – – 121,080 (106,766) 882,239 144,345 78,776 68,050 – – 303,747 139
  • 144.
    Interest rate risk Cashflow interest rate risk is the risk that the future cash flows of a financial instrument will fluctuate because of changes in market interest rates. Fair value interest rate risk is the risk that the value of a financial instrument will fluctuate because of changes in market interest rates. The Company takes on exposure to the effects of fluctuations in the prevailing levels of market interest rates on both its fair value and cash flow risks. Interest margins may increase as a result of such changes but may reduce losses in the event that unexpected movements arise. The Asset and Liability Committee (ALCO) is responsible for managing interest rate and liquidity risk in the Group. Asset and Liability management committees have been established in each subsidiary and meet on a monthly basis. They operate within the prudential guidelines and policies established by Group ALCO. In order to reduce interest rate risk, the majority of the Company’s lending is on a variable interest rate with a term of less than one year. The table below summarises the Company’s exposure to interest rate risks. It includes the Company’s financial instruments at carrying amounts, categorised by the earlier of contractual re-pricing or maturity dates. Variable rate financial instruments are categorised in the “Up to 1 month” column. 2011 BWP’000s 1 Month 1 – 3 Months 3 – 12 Months 1 – 5 Years Non-interest bearing Total Cash and short-term funds 5,102 – – – – 5,102 Financial assets designated at fair value 2,246 – – 149,869 – 152,115 Derivative financial assets – – – – 26,316 26,316 Loans and advances 189,520 – 91,591 – – 281,111 Investment securities – – – 42,172 – 42,172 Prepayments and other receivables – – – – 7,577 7,577 Inter-company balances 58,837 18,815 – – – 77,652 Property and equipment – – – – 263 263 Intangible assets – – – – 215 215 Deferred tax asset – – – – 15,017 15,017 Investment in subsidiaries – – – – 680,626 680,626 Loans to subsidiaries – – – 177,547 – 177,547 Total assets 255,705 18,815 91,591 369,588 730,014 1,465,713 Shareholders equity and liabilities Equity – – – – 311,547 311,547 Derivative financial liabilities – – – – 46,971 46,971 Creditors and accruals – – – – 9,110 9,110 Borrowed funds – 92,144 149,509 373,548 – 615,201 Inter-company balances 431,705 51,179 – – – 482,884 Total equity and liabilities 431,705 143,323 149,509 373,548 367,628 1,465,713 Total interest repricing gap (176,000) (124,508) (57,918) (3,960) 362,386 – Financial risk management continued ABC Holdings Limited ANNUAL REPORT 2011140
  • 145.
    2010 BWP’000s 1Month 1 –3 Months 3 – 12 Months 1 – 5 Years Non-interest bearing Total Cash and short-term funds 22,660 – – – – 22,660 Financial assets designated at fair value – – – 64,028 – 64,028 Derivative financial assets – – – – 19,464 19,464 Loans and advances 193,370 – – – – 193,370 Investment securities – – – 38,502 – 38,502 Prepayments and other receivables – – – – 18,607 18,607 Inter-company balances 58,433 – – – – 58,433 Property and equipment – – – – 790 790 Deferred tax asset – – – – 10,002 10,002 Investment in subsidiaries – – – – 602,077 602,077 Loans to subsidiaries – – – 158,053 158,053 Total assets 274,463 – – 260,583 650,940 1,185,986 Shareholders equity and liabilities Equity – – – – 303,747 303,747 Creditors and accruals – – – – 6,147 6,147 Borrowed funds – 7,328 10,081 409,619 – 427,028 Inter-company balances 449,064 – – – – 449,064 Total equity and liabilities 449,064 7,328 10,081 409,619 309,894 1,185,986 Total interest repricing gap (174,601) (7,328) (10,081) (149,036) 341,046 – The table below illustrates the impact of a possible 50 basis points interest rate movement: BWP‘000s 2011 2010 Shift in yield curves of +50 basis points (1,445) (885) Percentage of Shareholders Equity (+50 basis points) 0.0% (0.0)% Shift in yield curves of -50 basis points 1,445 885 Percentage of Shareholders Equity (-50 basis points) 0.0% (0.0)% The interest rate sensitivity analysis set out in the table above is illustrative only and is based on simplified scenarios over a period of one year. 141
  • 146.
    Liquidity risk Liquidity riskis the risk that the Company is unable to meet its payment obligations associated with its financial liabilities when they fall due and to replace funds when they are withdrawn. The consequence may be the failure to meet obligations to repay depositors and fulfil commitments to lend. 2011 BWP’000s Up to 1 month 1 – 3 months 3 – 12 months Greater than 1 Year Total Cash and short-term funds 5,102 – – – 5,102 Financial assets designated at fair value 2,246 – – 149,869 152,115 Derivative financial assets 119 – – 26,197 26,316 Loans and advances 2,658 2,249 263,040 13,164 281,111 Investment securities – – – 42,172 42,172 Prepayments and other receivables 120 – 7,457 – 7,577 Inter-company balances 58,837 18,815 – – 77,652 Property and equipment – – – 263 263 Intangible assets – – – 215 215 Deferred tax asset – – – 15,017 15,017 Investment in subsidiaries – – – 680,626 680,626 Loans to subsidiaries – – – 177,547 177,547 Total assets 69,082 21,064 270,497 1,105,070 1,465,713 Shareholders equity and liabilities Equity – – – 311,547 311,547 Derivative financial liabilities 119 – – 46,852 46,971 Creditors and accruals 9,110 – – – 9,110 Borrowed funds – 8,550 177,003 429,648 615,201 Inter-company balances 431,705 51,179 – – 482,884 Total equity and liabilities 440,934 59,729 177,003 788,047 1,465,713 Net maturity gap (371,852) (38,665) 93,494 317,023 – 2010 BWP’000s Up to 1 month 1 – 3 months 3 – 12 months Greater than 1 Year Total Cash and short-term funds 22,660 – – – 22,660 Financial assets designated at fair value – – – 64,028 64,028 Derivative financial assets – – – 19,464 19,464 Loans and advances 135,389 40,410 2,430 15,141 193,370 Investment securities – – – 38,502 38,502 Prepayments and other receivables 18,607 – – – 18,607 Inter-company balances – – 58,433 – 58,433 Property and equipment – – – 790 790 Deferred tax asset – – – 10,002 10,002 Investment in subsidiaries – – – 602,077 602,077 Loans to subsidiaries – – – 158,053 158,053 Total assets 176,656 40,410 60,863 908,057 1,185,986 Shareholders equity and liabilities Equity – – – 303,747 303,747 Creditors and accruals 6,147 – – – 6,147 Borrowed funds – 7,328 10,081 409,619 427,028 Inter-company balances 449,064 – – – 449,064 Total equity and liabilities 455,211 7,328 10,081 713,366 1,185,986 Net maturity gap (278,555) 33,082 50,782 194,691 – Financial risk management continued ABC Holdings Limited ANNUAL REPORT 2011142
  • 147.
    Non-derivative cash flow Thetable below presents the cash flows payable by the Company under non-derivative financial liabilities and assets held for managing liquidity risk by remaining contractual maturities at the date of the consolidated statement of financial position. The amounts disclosed in the table are the contractual undiscounted cash flows, whereas the Company manages the inherent liquidity risk based on expected undiscounted cash inflows: 2011 BWP’000s Up to 1 month 1 – 3 months 3 – 12 months Greater than 1 year Total Effect of discount/ financing rates Total Creditors and accruals 9,110 – – – 9,110 – 9,110 Borrowed funds – 16,878 345,911 826,958 1,189,747 (574,546) 615,201 Inter-company balances 376,351 70,242 38,144 – 484,737 (1,853) 482,884 Total liabilities 385,461 87,120 384,055 826,958 1,683,594 (576,399) 1,107,195 2010 BWP’000s Up to 1 month 1 – 3 months 3 – 12 months Greater than 1 year Total Effect of discount/ financing rates Total Creditors and accruals 6,147 – – – 6,147 – 6,147 Borrowed funds 7,640 53,202 327,318 409,618 797,778 (370,750) 427,028 Inter-company balances 449,681 3,921 – – 453,602 (4,538) 449,064 Total liabilities 463,468 57,123 327,318 409,618 1,257,527 (375,288) 882,239 The Company principally uses cash and short-term funds together with financial assets held for trading to manage liquidity risk. Derivative financial liabilities cash flows The table below presents the cash flows payable by the Company for derivative financial liabilities by remaining contractual maturities at the date of the statement of financial position. The amounts disclosed in the table are the contractual undiscounted nominal currency swap cash flows for the liability leg of such swaps, whereas the Company manages the inherent liquidity risk based on expected undiscounted cash inflows: 2011 BWP’000s Up to 1 month 1 – 3 months 3 – 12 months Greater than 1 year Total Derivative financial liabilities 4,647 6,616 3,137 – 14,400 2010 BWP’000s Up to 1 month 1 – 3 months 3 – 12 months Greater than 1 year Total Derivative financial liabilities – – – – – With the exception of swaps where on-going cashflows are settled on a gross basis, all derivative financial liabilities are settled on a net basis. 143
  • 148.
    The following tablepresents the Company’s assets and liabilities that are measured at fair value at 31 December 2011: 2011 BWP’000s Quoted prices Level 1 Observable input Level 2 Un- observable inputs Level 3 Total at fair value Assets Financial assets designated at fair value – – 152,115 152,115 Derivative financial assets – 26,197 – 26,197 Total assets at fair value – 26,197 152,115 178,312 Liabilities Derivative financial liabilities – – 46,852 46,852 Total liabilities at fair value – – 46,852 46,852 Financial assets and liabilities measured at fair value Effective 1 January 2009, the Company adopted the amendment to IFRS 7 for financial instruments that are measured in the balance sheet at fair value. This requires disclosure of fair value measurements by level of the following fair value measurement hierarchy: • Quoted prices (unadjusted) in active markets for identical assets or liabilities (level 1). • Inputs other than quoted prices included within level 1 that are observable for the asset or liability, either directly (that is, as prices) or indirectly (that is, derived from prices) (level 2). • Inputs for the asset or liability that are not based on observable market data (that is, unobservable inputs) (level 3). The fair value of financial instruments traded in active markets is based on quoted market prices at the balance sheet date. A market is regarded as active if quoted prices are readily and regularly available from an exchange, dealer, broker, industry group, pricing service, or regulatory agency, and those prices represent actual and regularly occurring market transactions on an arm’s length basis. The quoted market price used for financial assets held by the Group is the current bid price. These instruments are included in level 1. The fair value of financial instruments that are not traded in an active market (for example, over-the-counter derivatives) is determined by using valuation techniques. These valuation techniques maximise the use of observable market data where it is available and rely as little as possible on entity specific estimates. If all significant inputs required to fair value an instrument are observable, the instrument is included in level 2. If one or more of the significant inputs is not based on observable market data, the instrument is included in level 3. Specific valuation techniques used to value financial instruments include: • quoted market prices or dealer quotes for similar instruments; • the fair value of interest rate swaps is calculated as the present value of the estimated future cash flows based on observable yield curves; • the fair value of forward foreign exchange contracts is determined using forward exchange rates at the balance sheet date, with the resulting value discounted back to present value; and • other techniques, such as discounted cash flow analysis, are used to determine fair value for the remaining financial instruments. Financial risk management continued ABC Holdings Limited ANNUAL REPORT 2011144
  • 149.
    2010 Quoted prices Level 1 Observable input Level 2 Un- observable inputs Level3 Total at fair value – – – – – – 64,028 64,028 – – 64,028 64,028 – – – – – – – – 145
  • 150.
    Assets and liabilitiesmeasured at fair value for level 3 The following table presents the changes in level 3 instruments for the year ended at fair value at 31 December 2011: 2011 BWP’000s Trading securities Trading derivatives Debt or equity investments Total assets at fair value Derivative financial liabilities Total liabilities at fair value Assets Opening balance – – 64,028 64,028 – – Gains/Loss in PL – – 13,096 13,096 27,485 27,485 Purchases – – 74,991 74,991 19,486 19,486 Closing balance – – 152,115 152,115 46,971 46,971 2010 BWP’000s Trading securities Trading derivatives Debt or equity investments Total assets at fair value Derivative financial liabilities Total liabilities at fair value Liabilities Opening balance – – – – – – Gains/Loss in PL (1,515) (1,515) – – Purchases – – 65,543 65,543 – – Closing balance – – 64,028 64,028 – – Financial instruments not measured at fair value Financial assets not measured at fair value where the carrying value is estimated to approximate the fair value of the instrument, are as follows: Basis of measurement (i) Placements with other banks Placements with other banks includes inter-bank placements and items in the course of collection. The fair value of floating rate placements and overnight deposits is their carrying amount.  The estimated fair value of fixed interest-bearing deposits is based on discounted cash flows using prevailing money-market interest rates for debts with similar credit risk and remaining maturity. (ii) Loans and advances Loans and advances are accounted for on an amortised cost basis using the effective interest rate. Origination transaction costs and origination fees received that are integral to the effective rate are capitalised to the value of the loans and amortised through interest income as part of the effective interest rate. Loans and advances are stated net of allowances for specific and portfolio impairment. Financial risk management continued ABC Holdings Limited ANNUAL REPORT 2011146
  • 151.
    (iii) Investment securities Investmentsecurities include only interest-bearing assets held to maturity. Fair value for held to maturity assets is based on market prices or broker/dealer price quotations. Where this information is not available, fair value is estimated using quoted market prices for securities with similar credit, maturity and yield characteristics. (iv) Deposits The estimated fair value of deposits with no stated maturity, which includes non-interest-bearing deposits, is the amount repayable on demand. The estimated fair value of fixed interest-bearing deposits and other borrowings not quoted in an active market is based on discounted cash flows using interest rates for new debts with similar remaining maturity. (v) Inter-company balances and loans to subsidiaries The balances with subsidiary companies are carried at amortised cost. The carrying amount approximates their fair value. 147
  • 152.
    for the yearended 31 December 2011 Range Number of holders % of total holders Number of shares % of total holders 0 – 50,000 3,491 97.43% 6,539,648 4.38% 50,001 – 100,000 42 1.17% 3,188,633 2.13% 100,001 – 500,000 32 0.89% 5,766,667 3.86% 500,001 – 1,000,000 2 0.06% 1,583,674 1.06% 1,000,001 – 10,000,000 12 0.33% 42,952,915 28.74% Above 10,000,000 4 0.12% 89,440,594 59.83% 3,583 100.00% 149,472,131 100.00% analysis of shareholders Top 10 shareholders as at 31 December 2011 Shareholder Shares % holding 1 African Development Corporation 34,684,220 23.20% 2 Shares held by and on behalf of DT Munatsi 23,223,154 15.54% 3 Old Mutual Life Assurance Co. of Zimbabwe Ltd 15,891,065 10.63% 4 International Finance Corporation 15,642,155 10.47% 5 Botswana Insurance Fund Management 9,965,436 6.67% 6 Shares held by and on behalf of B Moyo 7,119,958 4.76% 7 SCBN-SIMS 6,794,419 4.55% 8 Nederlandse Financierings-Maatschappij Voor Ontwikkelingslande 3,582,623 2.40% 9 Shares held by and on behalf of FM Dzanya 3,094,774 2.07% 10 SCBN-OTHER 2,666,647 1.78% Total top 10 shareholders 122,664,451 82.07% Other shareholders 26,807,680 17.93% 149,472,131 100.00% Geographical analysis of shareholders Region Number of holders % of total holders Number of shares % of total shares Americas 17 0.47% 15,762,554 10.55% Botswana 322 8.99% 23,755,950 15.89% Europe 27 0.75% 3,767,206 2.52% Mauritius 1 0.03% 34,684,220 23.20% South Africa 74 2.07% 1,089,707 0.73% Zimbabwe 2,391 66.73% 68,161,775 45.60% Other 751 20.96% 2,250,719 1.51% 3,583 100.00% 149,472,131 100.00% ABC Holdings Limited ANNUAL REPORT 2011148
  • 153.
    This document isimportant and requires your immediate attention. If you are in doubt as to the action you should take in relation to this document, please consult your stockbroker, banker, legal advisor or other professional advisor immediately. Action required: 1. If you have disposed of all of your shares in ABC Holdings Limited, this circular should be delivered to the agent through whom you have disposed such shares for onward transmission to the acquirer of those shares. 2. A notice convening the 12th annual general meeting of shareholders of ABC Holdings Limited (“AGM”), to be held at 09h30 on Wednesday 30 May 2012 at the Boardroom at BancABC Botswana, ABC House, Plot 62433, Fairground Office Park, Gaborone, is attached hereto, which notice forms an integral part of this Circular. 3. A form of proxy is also attached to the AGM notice and Shareholders who are unable to attend the AGM should complete the attached form of proxy and return it to the registered office of the Company so as to be received by no later than 09h30 on Tuesday 29 May 2012. Submission of a form of proxy will not preclude shareholders from attending and voting in person at the AGM should they so desire. (Registration number 99/4865) (Incorporated in the Republic of Botswana) (ABC Holdings Limited or “the Company”) CIRCULAR TO SHAREHOLDERS Regarding: – a waiver by shareholders of the obligation to make an offer to minority shareholders; – amendments to the existing Memorandum and Articles of Association and the adoption of a Constitution in terms of Section 43(3) of the Companies Act in place of the existing Memorandum and Articles of Association; and enclosing: – the biographies of directors retiring and standing for re-election; – a notice of General Meeting; – a form of proxy. Sponsoring Broker 149
  • 154.
    contents Definitions Page 151 Salientdates and times Page 151 Waiver of the obligation to make an offer to shareholders Page 152 Amendments to the existing Memorandum and Articles of Association Page 153 Announcement Page 155 Annual General Meeting Page 155 Notice of Annual General Meeting Page 156 Form of Proxy Page 159 ABC Holdings Limited ANNUAL REPORT 2011150
  • 155.
    Definitions In this circularunless otherwise stated or the context otherwise requires, the words in the first column have the meanings stated opposite them in the second column, words in the singular include the plural and vice-versa, and words importing natural persons shall include juristic persons, whether corporate or incorporate, and vice versa: “ADC” African Development Corporation, a company incorporated in Mauritius; “Act” the Companies Act, Act No 32 of 2004, CAP 42:01 of the Laws of Botswana as amended; “Articles” the Articles of Association of ABC Holdings Limited as at date hereof; “BSE” the Botswana Stock Exchange; “Botswana” the Republic of Botswana; “Circular” this circular dated 8 May 2012 including the annexures hereto, the notice of General Meeting and form of proxy; “Directors” the Board of Directors of ABC Holdings Limited; “ABC Holdings Limited or the Company” ABC Holdings Limited (registration number 99/4865) a company incorporated in the Republic of Botswana and listed on the BSE and ZSE; “General Meeting” the Annual General Meeting of Shareholders to be held on 30 May 2012; “Memorandum of Association” the Memorandum of Association of ABC Holdings Limited as amended as the date hereof; “Notice” the Notice of the General Meeting attached to this Circular; “Offer Price” means a price of BWP4.28 (four Botswana Pula and twenty eight Thebe) or the USD equivalent thereof at a date to be determined per ordinary share at which price the Shareholders will be entitled to subscribe for the Shares offered pursuant to the Rights Offer; “Rights Offer” the offer of 83,333,333 shares to be made by the Company to shareholders on the basis of the Rights Offer Share to 1.79 shares held; “Resolutions” the resolutions reflected in the Notice of Meeting incorporated within this Circular; “Shareholders” holders of Ordinary Shares of the Company; and “ZSE” Zimbabwe Stock Exchange. Salient Dates And Times (Year 2012) Circular posted to shareholders of ABC Holdings on Tuesday 8 May 2012 Forms of proxy to be received by 09h30 Tuesday 29 May 2012 Annual General Meeting at 09h30 Wednesday 30 May 2012 The above dates and times are subject to change. Any amendment will be published in the press. 151
  • 156.
    Directors: Howard Buttery (Chairman) NgoniKudenga Doreen Khama Hans Wasmus Lakshmi Shyam-Sunder Mark M Schneiders Douglas T Munatsi Francis M Dzanya Bekithemba Moyo CIRCULAR TO SHAREHOLDERS OF ABC HOLDINGS LIMITED PART 1: Waiver of the obligation to make an offer to shareholders 1. The Purpose of Part 1 of the Circular The purpose of this Part 1 of the Circular and the Notice is to furnish information to the shareholders as to the proposed resolution for waiver of the possible obligation of ADC to make an offer to purchase shares of Shareholders, other than ADC, at the Offer Price, which shareholders will be asked to approve, as special business, at the General Meeting. 2. Reasons for the Waiver In terms of the BSE Requirements, if a person, including an existing shareholder acquires more than 35% of the issued shares of a company listed on the BSE, that person is required to make an offer to acquire / purchase the shares of the other shareholders (“the minorities”) at the price that person acquired the shares. The BSE can grant a waiver of the obligation to make this offer. ABCH is to make a renounceable Rights Offer to its shareholders, in terms of which ABCH seeks to raise BWP356,666,666 (the equivalent of USD50,000,000) and offers to shareholders 83 333 333 shares in ABCH at a price of P4.28 (or the USD equivalent thereof) (“the Offer Price”) on the basis of one new offer share for every 1.79 ordinary shares held by a shareholder. In terms of the BSE Requirements a rights offer is to be underwritten. ADC, a substantial shareholder holding approximately 23.20% of the issued shares in ABCH will follow its rights to acquire shares in the Rights Offer and is prepared to underwrite the Rights Offer, and subscribe for Rights Offer Shares not taken up by shareholders, by exercising their rights, or by third parties who have acquired such rights from shareholders, at the close of the Rights Offer. Depending on the take up of Rights Offer Shares by shareholders other than ADC and third parties, ADC may be required to subscribe for Rights Offer Shares not taken up, and such shares when added to the Shares acquired by ADC in following its rights as Shareholder and the Shares in ABCH already held by ADC, could result in ADC holding more than 35% of the then issued shares (after the Rights Offer) of ABCH. In terms of the BSE Requirements, ADC would be obliged to make an offer to all other shareholders of ABCH to acquire the shares in ABCH held by them, at a price of P4.28 (or the USD equivalent thereof) per share. The underwriting agreement is conditional upon the wayver being obtained. ABCH made application to the BSE to waive the requirement / obligation for ADC to make such an offer. The BSE has indicated it will waive the requirement provided that, inter alia, the majority of independent shareholders other than ADC waive the obligation also. Accordingly the Board seeks an ordinary resolution of independent shareholders other than ADC, to waive the requirement. ABC Holdings Limited ANNUAL REPORT 2011152
  • 157.
    The Board isof the view that the Rights Offer is essential to the Company: i. to enable it to complete its retail banking roll out (to which substantial amounts of money have already been invested) by further investment in systems, people and distribution channels; ii. to increase the capital of each of its operating subsidiaries; iii. to enable each of its operating subsidiaries to grow its footprint and market share in each country of operation. iv. to enable each subsidiary to be rated in the top ten of banks in the country of its operation. Importantly all funds paid for Rights Offer Shares will accrue to the Company. Full details of the Rights Offer will be available in a circular and prelisting statement to be made available to shareholders prior to the General Meeting. The Rights Offer cannot be proceeded with unless underwritten. Shareholders support for the Underwriting by granting the waiver is requested. PART 2: Amendments to the existing Memorandum and Articles of Association 1. Purpose of Part 2 of the Circular The purpose of Part 2 the Circular and the Notice is to furnish information to the Shareholders as to the proposed amendments to the Articles of Association which Shareholders will be asked to approve as by way of resolution as special resolution and ordinary resolution special business at the General Meeting: a. the adoption of a new Constitution in terms of section 43(3) of the Companies Act in place of the existing Articles of Association that amends the Articles of Association to bring it in line with the Act and such other changes as are required to update the Articles of Association in line with relevant statutes and current trends in corporate governance; and b. authorising the Directors to take all such steps and sign all such documents as are necessary to give effect to the resolutions passed at this meeting. 2. Reasons for Amendments It is sought to amend the Articles of Association of the Company to effect the substantive changes outlined below. Adoption of a Constitution In terms of the Act, which came into force on 3 July 2007, any existing Company which has as its Constitution, a Memorandum and Articles of Association, is not entitled to amend such a document unless it consolidates both documents into a single document known as the “Constitution”. It is proposed that the Memorandum and Articles of Association be amended and a Constitution adopted through the procedures set out in this circular. The Constitution, a draft of which is available for inspection at the registered office of the Company, during normal business hours from 10 May 2012 until the date of the AGM, will include amendments to the existing Articles of Association that include the following: (i) amendments to bring the Constitution in line with mandatory changes as introduced by the Act as read together with the BSE Listings Requirements (such changes include the removal of references to authorized share capital; references to circumstances in which the Act allows for the Company to give financial assistance to purchase its own shares, mandatory provisions on notice period to call meetings, etc) and to update references to the Act to reflect the appropriate reference in the new Companies Act; (ii) amendments to bring the Constitution in line with the most current trends in corporate governance as referenced by the BSE Guidelines on Corporate Governance and international guidelines such as the King Reports on Corporate Governance 153
  • 158.
    (iii) amendments toprovide for uncertificated shares; and (iv) formal amendments as to grammar and language to avoid repetition or extraneous provisions. The Constitution does not incorporate the objects of the Company, which has been rendered unnecessary by the provision of the current Companies Act, which makes the provisions relating to objects optional. PART 3: BIOGRAPHIES OF DIRECTORS ABCH provides the following Biographies of directors standing for re-election and whose appointments are to be ratified at the Annual General Meeting Dr Lakshmi Shyam-Sunder (55) Lakshmi Shyam-Sunder is the Chief Finance Officer and Director of the Multilateral Investment Guarantee Agency at the World Bank Group. She has wide-ranging financial experience, which includes a period on the Finance Faculty of the MIT Sloan School of Management in the USA and at the Tuck School of Business Administration, Dartmouth College. She has also consulted on finance, valuation, and risk management topics for financial institutions and corporations in the United States, for the US Government and financial institutions in emerging markets. She joined the IFC in 1994 and prior to being appointed a Director held a number of positions within the institution working in treasury and portfolio management before being named Director of Risk Management and Financial Policy for IFC. She serves on the Boards and Risk and Finance Committees of some IFC’s client companies. She has a Ph.D in Finance from the MIT Sloan School of Management and an MBA from the Indian Institute of Management, Ahmedabad, India. Douglas T Munatsi Douglas “Doug” Munatsi has been Chief Executive Officer of the ABC Holdings Group since its formation in 2000. Involved in the world of finance and banking for his entire career, he has served as an executive in the Southern Africa regional mission of the International Finance Corporation (IFC), the private sector arm of the World Bank. He went on to establish Heritage Investment Bank (HIB), an investment bank which established a reputation for the successful introduction of innovative capital market products. Under his guidance, HIB became one of the leading merchant banks in Zimbabwe. In 1997, together with Anglo American of Zimbabwe, which then controlled 43% of First Merchant Bank of Zimbabwe (“FMB”), he successfully negotiated the merger between HIB and FMB. He became Managing Director of the merged bank, which continued to operate under the First Merchant Bank identity and remained in this position until the formation of ABC Holdings. His qualifications include a Bachelor of Business (Hon) degree from the University of Zimbabwe, an MBA from the American University in Washington DC and an AMP from Harvard Business School. Mark M Schneiders Mark Schneiders has more than 27 years of banking sector experience in various wholesale and private banks within African banks and around the globe serving as an entrepreneurial finance professional. He has held various positions that include Managing Director with ING Financial Institutions in Amsterdam. Mr Schneiders has extensive experience with company mergers, building new markets and setting up retail bank businesses in a variety of countries including Switzerland, The Netherlands, Spain, Curaçao, Argentina, Venezuela, Hong Kong and USA. He was appointed to the Board on 9 December 2011. He holds a Bachelor’s and Master’s degree in law from the University of Leiden, The Netherlands, and has completed the Advanced Management Program at Harvard Business School and banking management programs at INSEAD (Cedep). Any member wishing to nominate a person to be considered for election as directors of the Company, in place of those retiring, should submit a written nomination, proposed by that member and seconded by another member, containing the ABC Holdings Limited ANNUAL REPORT 2011154
  • 159.
    written consent ofthe nominee to be appointed a director, and the curriculum vitae of the nominee, to the Registered Office of the Company at least five working days prior to the date of the Annual General Meeting. Announcement The results of the special business that is to be voted on at the Annual General Meeting will be announced in the press on or before 5th June 2012. Annual General Meeting Following hereafter and forming part of the Circular, is the Notice of the Annual General Meeting of Shareholders of ABC Holdings Limited to be held at the Boardroom, ABC House, BancABC Botswana,, Plot 62433, Fairground Office Park, Gaborone, Botswana, on Wednesday 30 May 2012 at 09h30 for the purpose of considering the business of the Annual General Meeting and of considering the special business. Shareholders who are unable to attend the General Meeting and who wish to be represented thereat, are requested to complete and return the attached form of proxy in accordance with the instructions contained therein and in the Notice of the Annual General Meeting. A proxy need not be a Member of the Company. By order of the Board M Vogt Secretary to the Board of Directors Gaborone 24 April 2012 Registered Office: Rhoss (Pty) Ltd, Unit 2, Plot 8884, Rizika House, African Mall, Gaborone, Botswana. 155
  • 160.
    (Registration number 99/4865) (Incorporatedin the Republic of Botswana) (ABC Holdings Limited or “the Company”) Howard Buttery (Chairman) Ngoni Kudenga Doreen Khama Hans Wasmus Lakshmi Shyam-Sunder Mark Schneiders Douglas T Munatsi Francis M Dzanya Bekithemba Moyo Notice of Annual General Meeting Notice is hereby given that the Annual General Meeting of Shareholders of the Company will be held at the Boardroom, ABC House, BancABC Botswana, Plot 62433, Fairground Office Park, Gaborone, Botswana on Wednesday 30 May 2012 at 09h30 for the purpose of transacting the following ordinary and special business and considering and if deemed fit, passing, the following resolutions: Ordinary Business: 1. To read the notice convening the meeting. 2. To receive, consider, and adopt the annual financial statements for the year ended 31 December 2011, including the Chairman’s statement, Directors’ report and Auditors’ report. 3. To approve the remuneration of the Directors for the year ended 31 December 2011. 4. To note that Directors, Dr Shyam-Sunder, Mr Wasmus and Mr Munatsi retire by rotation in terms of Article 67 of the Articles of Association and to re-elect Dr Shyam-Sunder and Mr Munatsi who being eligible, offer themselves for re- election. 5. To ratify the appointment of Mr Mark Martijn Schneiders as a director of the Company. 6. To appoint auditors for the ensuing year and to fix their remuneration. SPECIAL Business: 1. To consider waiver of the BSE requirement that ADC in the event it acquires such number of Right Offer Shares, pursuant to the Rights Offer and the underwriting thereof, which together with the shares already held by it, ADC make an offer to purchase the shares in ABCH held by other shareholders at a price of P4.28. 2. To amend the Articles of Association and to adopt a Constitution in its place under section 43(3) of the Act. Ordinary Resolution 1: To approve the annual financial statements for the year ended 31st December 2011, including the Chairman’s statement, Directors’ report and Auditor’s report. Ordinary Resolution 2: To approve the remuneration of Directors for the year ended 31 December 2011. ABC Holdings Limited ANNUAL REPORT 2011156
  • 161.
    Ordinary Resolution 3: Toelect Directors in place of those retiring by rotation in accordance with the provisions of article 67 as read with article 73 of the Company’s Articles of Association. In this regard Dr Shyam-Sunder retires by rotation and being available and eligible offers herself for re-election. Ordinary Resolution 4: To elect Directors in place of those retiring by rotation in accordance with the provisions of article 67 as read with article 73 of the Company’s Articles of Association. In this regard Mr. Munatsi retires by rotation and being available and eligible offers himself for re-election. Ordinary Resolution 5: To ratify the appointment of Mr Mark Martijn Schneiders as a director of the Company. Ordinary Resolution 6: To appoint the Auditors for the Company for the ensuing year. Ordinary resolution 7: To waive the requirement set forth in the BSE Requirements that a person acquiring more than 35% of the issued share capital of a company, in the instance of African Development Corporation (“ADC”) in the event that pursuant to the Rights Offer and the Underwriting thereof, ADC acquires Rights Offer Shares which together with the shares already held by it will result in ADC holding more than 35% of the issued shares of the Company. Special Resolution 1: Resolved to replace the Memorandum and Articles of Association of the Company in their entirety with a Constitution, a draft of which Constitution is available for inspection from 10 May 2012 to the date of the General Meeting at the Company’s registered office. Ordinary Resolution 8: The Directors be and are hereby authorized to take such steps and sign all such other documents as are necessary to give effect to the resolutions passed at this meeting. Voting and proxies All holders of Ordinary Shares entitled to vote will be entitled to attend and vote at the Annual General Meeting. A holder of shares who is present in person, by authorised representative or by proxy, shall have one vote on a show of hands and have one vote for every ordinary share held on a poll. Each Shareholder entitled to attend and vote at the Annual General Meeting is entitled to appoint one or more proxies (none of whom need be a Shareholder of the Company) to attend, speak and subject to the Articles of Association of the Company, vote in his/her/its stead. The form of proxy for the Annual General Meeting, which sets out the relevant instructions for its completion, is annexed hereto. In order to be effective, a duly completed form of proxy must be received at the Registered Office of the Company, Rhoss (Pty) Ltd, Unit 2, Plot 8884, Rizika House, African Mall, Gaborone, Botswana by not later than 09h30 on Tuesday 29 May 2012. By Order of the Board M Vogt Secretary to the Board of Directors 157
  • 162.
    Notes: ABC Holdings LimitedANNUAL REPORT 2011158
  • 163.
    (Registration number 99/4865) (Incorporatedin the Republic of Botswana) (ABC Holdings Limited or “the Company”) Form of Proxy For completion by holders of Ordinary Shares PLEASE READ THE NOTES OVERLEAF BEFORE COMPLETING THIS FORM. EXPRESSIONS USED IN THIS FORM SHALL, UNLESS THE CONTEXT REQUIRES OTHERWISE, BEAR THE SAME MEANINGS AS IN THE CIRCULAR TO SHAREHOLDERS OF ABC HOLDINGS LIMITED ISSUED ON 8 MAY 2012. For use at the Annual General Meeting of Shareholders of the Company to be held at the Boardroom, ABC House, BancABC Botswana, Plot 62433, Fairground Office Park, Gaborone, Botswana on 30 May 2012 at 09h30. I/We (Name/s in block letters) Of (Address) Appoint (see note 2): 1. or failing him/her, 2. or failing him/her, 3. the Chairman of the Meeting, as my/our proxy to act for me/us at the General Meeting which will be held, in addition to considering the ordinary business, for the purpose of considering and if deemed fit, passing with or without modification, the resolutions to be proposed under the special business vote thereat and at each adjournment thereof, and to vote for or against the resolutions and/or abstain from voting in respect of the Ordinary Shares registered in my/our name in accordance with the following instructions (see note 2): Number of Ordinary Shares For Against Abstain 1. Ordinary Resolution 1 2. Ordinary Resolution 2 3. Ordinary Resolution 3 4. Ordinary Resolution 4 5. Ordinary Resolution 5 6. Ordinary Resolution 6 7. Special Resolution 1 8. Ordinary Resolution 7 Signed at on day of 2012 Signature Assisted by (where applicable) Each Shareholder is entitled to appoint one or more proxies (who need not be Member/s of the Company) to attend, speak and vote in place of that Shareholder at the General Meeting. Please read the notes on the reverse side hereof. 159
  • 164.
    Notes   1. AShareholder must insert the names of two alternative proxies of the Shareholder’s choice in the space provided, with or without deleting “Chairman of the Annual General Meeting”. The person whose name appears first on the form of proxy, and whose name has not been deleted will be entitled to act as proxy to the exclusion of those whose names follow.   2. A Shareholder’s instructions to the proxy must be indicated by the insertion of the relevant number of votes exercisable by the Shareholder in the appropriate space provided. Failure to comply herewith will be deemed to authorise the proxy to vote at the General Meeting as he/she deems fit in respect of the Shareholder’s votes exercisable thereat, but where the proxy is the Chairman, failure to comply will be deemed to authorise the proxy to vote in favour of the resolution. A Shareholder or his/her proxy is obliged to use all the votes exercisable by the Shareholder or by his/her proxy.   3. Forms of proxy must be lodged at or posted to the Registered Office of the Company, Rhoss (Pty) Ltd, Unit 2, Plot 8884, Rizika House, African Mall, Gaborone, Botswana, or PO Box 1882, Gaborone, Botswana, to be received not less than 24 hours before the Annual General Meeting on 30 May 2012 at 09h30.   4. The completion and lodging of this form will not preclude the relevant Shareholder from attending the General Meeting and speaking and voting in person thereat to the exclusion of any proxy appointed in terms hereof should such Shareholder wish to do so.   5. The Chairman of the General Meeting may reject or accept any form of proxy not completed and/or received other than in accordance with these notes provided that he is satisfied as to the manner in which the Shareholder concerned wishes to vote.   6. An instrument of proxy shall be valid for the General Meeting as well as for any adjournment thereof, unless the contrary is stated thereon.   7. A vote given in accordance with the terms of a proxy shall be valid, notwithstanding the previous death or insanity of the Shareholder, or revocation of the proxy, or of the authority under which the proxy was executed, or the transfer of the Ordinary Shares in respect of which the proxy is given, provided that no intimation in writing of such death, insanity or revocation shall have been received by the Company not less than one hour before the commencement of the General Meeting or adjourned General Meeting at which the proxy is to be used.   8. The authority of a person signing the form of proxy under a power of attorney or on behalf of a company must be attached to the form of proxy, unless the authority or full power of attorney has already been registered by the Company or the Transfer Secretaries.   9. Where Ordinary Shares are held jointly, all joint Shareholders must sign. 10. A minor must be assisted by his/her guardian, unless relevant documents establishing his/her legal capacity are produced or have been registered by the Company. ABC Holdings Limited ANNUAL REPORT 2011160
  • 165.
    company information ABC HoldingsLimited Directors: H Buttery, F Dzanya, D Khama, N Kudenga, B Moyo, D T Munatsi, L Shyam-Sunder, J Wasmus, M Schneiders ABC House, Plot 62433, Fairground Office Park, Gaborone, Botswana Tel: +267 3674300 Fax: +267 3902131 www.bancabc.com Administrative office – South Africa 205 Rivonia Road, Morningside, 2196 Johannesburg, South Africa Tel: +27 (11) 722 5300 Fax: +27 (11) 722 5360 BancABC Botswana Directors: D Khama, L Makwinja, B Moyo, D T Munatsi, J Kurian BancABC House, Plot 62433, Fairgrounds Office Park, Gaborone, Botswana Tel: +267 3674300 Fax: +267 3902131 Branches: Square branch +267 3160400 Fairgrounds branch +267 3674300 Francistown branch +267 2414133 Game City Branch +267 3704700 mybancbw@bancabc.com BancABC Mozambique SA Directors: B Alfredo, H Chambisse, D T Munatsi, L S Simao, T E T Venichand, J Sibanda, F Mucave Head Office: 999 Avenida Julius Nyerere, Polana Cimento, Maputo, Mozambique Tel: +258 (21) 482100 Fax: +258 (21) 486808 Branches: Beira branch +258 (23) 320655/7 Chimoio branch +258 (25) 123007/8 Tete branch + 258 (25) 222984 Matola branch +258 (21) 720005/8 Chundi branch +258 (21)493715 abcmoz@bancabc.com BancABC Tanzania Directors: J P Kipokola, R Dave, J Doriye, W Nyachia, D T Munatsi, L Sondo, B Nyoni 1st Floor Barclays House, Ohio Street, PO Box 31, Dar es Salaam, Tanzania Tel: +255 (22) 2111990 Fax: +255 (22) 2112402 Branches: Kariakoo Branch +255 (22) 2180108/182/212 Upanga Branch +255 (22) 2121537-9 Quality Center Branch +255 22 2865904-10 abctz@africanbankingcorp.com abctz@bancabc.com Tanzania Development Finance Company Limited Directors: J P Kipokola, J Doriye, W Nyachia, D T Munatsi, B Nyoni 1st Floor Barclays House, Ohio Street, Dar es Salaam, Tanzania PO Box 2478, Dar es Salaam, Tanzania Tel: +255 (22) 2111990 Fax: +255 (22) 2112402 abctz@africanbankingcorp.com abctz@bancabc.com BancABC Zambia Directors: C Chileshe, D T Munatsi, C Simatyaba, J W Thomas, L Mwafulilwa, A Dudhia, R Credo, J Muwo BancABC House, Plot 746B, Corner Nasser Road/ Church Road, Ridgeway, Lusaka Tel: +260 (211) 257970-5 Fax: +260 (211) 257980 Branches: Cairo Road branch +260 (211) 227690/3 Kitwe branch +260 (212) 222426/7 Livingstone branch +260 (213) 320681 Lumumba Road branch +260 (211) 230796 Ndola branch +260 (212) 621715/6 abcz@bancabc.com BancABC Zimbabwe Directors: N Kudenga, P Sithole, F E Ziumbe, N M Matimba, A Mabhena, F M Dzanya, H Matemera,T W Mudangwe 1 Endeavour Crescent, Mount Pleasant Business Park, Mount Pleasant, Harare, Zimbabwe Tel: +263 (4) 369260-99 Fax: +263 (4) 338064 Branches: Beitbridge branch +263 (286) 23172/3/4 Checheche branch +263 (317) 258; 277; 314; 327 Chiredzi branch +263 (31) 2254-6/413609 Graniteside branch +263 (4) 781046/7; 781615-7 Heritage branch +263 (4) 781837-40 Hotsprings branch +263 772 456 188; 772 732 014 Hwange branch +263 (281) 21703-10 Kwekwe branch +263 (55) 25216-23 Jason Moyo branch +263 (9) 73700-11 Msasa branch +263 (4) 486087; 486139; 486508 Mt. Pleasant branch +263 (4) 369260-99 Mutare branches: Main +263 (20) 67939; 67941 Manica Centre +263 (20) 68255/69/78/79 Redcliff branch +263 (55) 62875-82 Victoria Falls branch +263 (13) 45101-8 TSF Branch +263 (4) 667039; 667892 Zvishavane branch +263 (51) 2940-4 abczw@africanbankingcorp.com