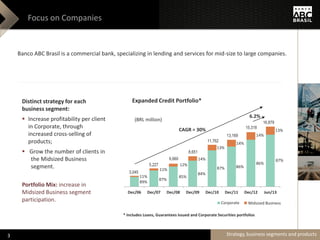
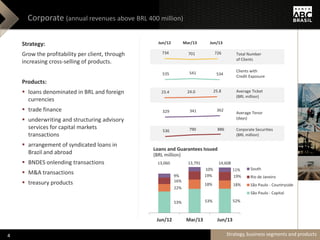
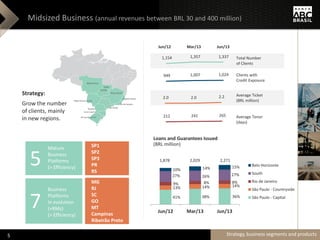
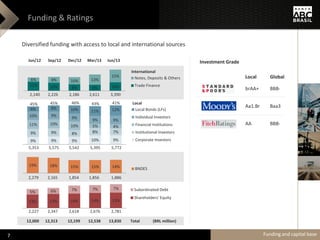
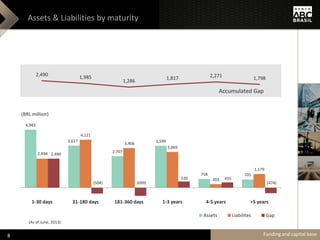
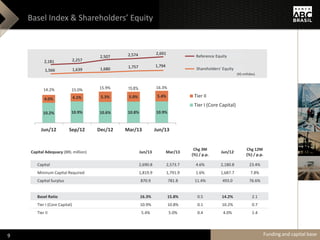
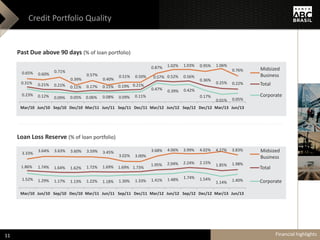
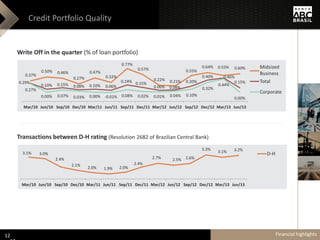
Investor
Presentation
October 2013
Strategy, business segments
and products
Funding and capital base
Financial highlights
Ownership structure
Investor Presentation October 2013
Distinct strategy for each
business segment:
 Increase profitability per client
in Corporate, through
increased cross-selling of
products;
 Grow the number of clients in
the Midsized Business
segment.
Portfolio Mix: increase in
Midsized Business segment
participation.
Estratégia, segmentos e produtos
Focus on Companies
Banco ABC Brasil is a commercial bank, specializing in lending and services for mid-size to large companies.
Expanded Credit Portfolio*
* Includes Loans, Guarantees Issued and Corporate Securities portfolios
89%
87%
85%
84%
87% 86%
86%
87%
11%
11%
12%
14%
13%
14%
14%
13%
Dec/06 Dec/07 Dec/08 Dec/09 Dec/10 Dec/11 Dec/12 Jun/13
Corporate Middle Market Outros
11,762
8,651
6,660
5,227
3,045
CAGR = 30%
13,169
6.2%
(BRL million)
15,318
16,879
Strategy, business segments and products
Midsized Business
3
734 701 726
535 541 534
23.4 24.0 25.8
329 341 362
536 790 886
Estratégia, segmentos e produtos
Corporate (annual revenues above BRL 400 million)
Strategy:
Grow the profitability per client, through
increasing cross-selling of products.
Products:
 loans denominated in BRL and foreign
currencies
 trade finance
 underwriting and structuring advisory
services for capital markets
transactions
 arrangement of syndicated loans in
Brazil and abroad
 BNDES onlending transactions
 M&A transactions
 treasury products
Average Ticket
(BRL million)
Average Tenor
(days)
Total Number
of Clients
Clients with
Credit Exposure
Jun/12 Mar/13 Jun/13
Corporate Securities
(BRL million)
Loans and Guarantees Issued
(BRL million)
53% 53% 52%
22%
18% 18%
16%
19% 19%9%
10% 11%
Jun/12 Mar/13 Jun/13
South
Rio de Janeiro
São Paulo - Countryside
São Paulo - Capital
13,060 13,791 14,608
Strategy, business segments and products4
1,154 1,357 1,337
949 1,007 1,024
2.0 2.0 2.2
212 241 265
Estratégia, segmentos e produtos
Midsized Business (annual revenues between BRL 30 and 400 million)
Strategy:
Grow the number
of clients, mainly
in new regions.
Average Ticket
(BRL million)
Average Tenor
(days)
Total Number
of Clients
Clients with
Credit Exposure
Jun/12 Mar/13 Jun/13
Loans and Guarantees Issued
(BRL million)
Mature
Business
Platforms
(> Efficiency)
SP1
SP2
SP3
PR
RS
5
Business
Platforms
In evolution
(+RMs)
(> Efficiency)
MG
RJ
SC
GO
MT
Campinas
Ribeirão Preto
7 41% 38% 36%
13% 14% 14%9% 8% 8%
27% 26% 27%
10% 14% 15%
Jun/12 Mar/13 Jun/13
Belo Horizonte
South
Rio de Janeiro
São Paulo - Countryside
São Paulo - Capital
1,878 2,029 2,271
Strategy, business segments and products5
Strategy, business segments and products
Funding and capital base
Financial highlights
Ownership structure
Investor Presentation October 2013
Funding & Ratings
Diversified funding with access to local and international sources
Jun/12 Sep/12 Dec/12 Mar/13 Jun/13 Investment Grade
Local
brAA+
Aa1.Br
AA
Global
BBB-
Baa3
BBB-
13% 13% 14% 14% 13%
5% 6% 7% 7% 7% Subordinated Debt
Shareholders' Equity
2,227 2,347 2,618 2,676 2,781
19% 18% 15% 15% 14% BNDES
2,279 2,165 1,854 1,856 1,886
12% 10% 8% 8% 10%
6% 8% 10% 13%
15% Notes, Deposits & Others
Trade Finance
2,140 2,226 2,186 2,611 3,390
9% 9% 9% 10% 9%
9% 9% 8% 8% 7%
11% 10% 10% 5% 4%
10% 9% 9%
9% 9%
6% 8% 10% 11% 12% Local Bonds (LFs)
Individual Investors
Financial Institutions
Institutional Investors
Corporate Investors
41%45% 45% 46% 43%
5,353 5,575 5,542 5,395 5,772
12,000 12,313 12,199 12,538 13,830 Total (BRL million)
Funding and capital base
International
Local
7
Assets & Liabilities by maturity
4,983
3,617
2,707
3,599
758 705
2,494
4,121
3,406
3,069
303
1,179
2,490
(504) (699)
530 455
(474)
1-30 days 31-180 days 181-360 days 1-3 years 4-5 years >5 years
Assets Liabilites Gap
(BRL million)
2,490 1,985
1,286
1,817 2,271 1,798
Accumulated Gap
Funding and capital base
(As of June, 2013)
8
Basel Index & Shareholders’ Equity
10.2% 10.9% 10.6% 10.8% 10.9%
4.0% 4.1% 5.3% 5.0% 5.4%
Jun/12 Sep/12 Dec/12 Mar/13 Jun/13
Tier II
Tier I (Core Capital)
14.2% 15.0% 15.9% 15.8% 16.3%
Capital Adequacy (BRL million) Jun/13 Mar/13
Chg 3M
(%) / p.p.
Jun/12
Chg 12M
(%) / p.p.
Capital 2,690.8 2,573.7 4.6% 2,180.8 23.4%
Mininum Capital Required 1,819.9 1,791.9 1.6% 1,687.7 7.8%
Capital Surplus 870.9 781.8 11.4% 493.0 76.6%
Basel Ratio 16.3% 15.8% 0.5 14.2% 2.1
Tier I (Core Capital) 10.9% 10.8% 0.1 10.2% 0.7
Tier II 5.4% 5.0% 0.4 4.0% 1.4
Funding and capital base
2,181 2,257
2,507 2,574 2,691
1,566 1,639 1,680 1,757 1,794
Patrimônio de Referência
Patrimônio Líquido
(R$ milhões)
Reference Equity
Shareholders’ Equity
9
Strategy, business segments and products
Funding and capital base
Financial highlights
Ownership structure
Investor Presentation October 2013
Credit Portfolio Quality
Past Due above 90 days (% of loan portfolio)
Loan Loss Reserve (% of loan portfolio)
3.33%
3.64% 3.63% 3.60% 3.59% 3.45%
3.02% 3.00%
3.68% 4.06% 3.99% 4.02% 4.27% 3.83%
1.86% 1.74% 1.64% 1.62% 1.72% 1.69% 1.69% 1.73%
1.95% 2.04% 2.24% 2.15%
1.85% 1.98%
1.52% 1.29% 1.17% 1.13% 1.22% 1.18% 1.30% 1.33% 1.41% 1.48% 1.74% 1.54%
1.14% 1.40%
Mar/10 Jun/10 Sep/10 Dec/10 Mar/11 Jun/11 Sep/11 Dec/11 Mar/12 Jun/12 Sep/12 Dec/12 Mar/13 Jun/13
Middle
Total
Corporate
0.65% 0.60%
0.71%
0.39%
0.57%
0.40%
0.51% 0.50%
0.87% 1.02% 1.03% 0.95% 1.06%
0.76%
0.31% 0.21% 0.21% 0.11% 0.17% 0.15% 0.19% 0.21%
0.57% 0.52% 0.56%
0.36%
0.25% 0.22%
0.23% 0.12% 0.09% 0.05% 0.06% 0.08% 0.09% 0.11%
0.47% 0.39% 0.42%
0.17%
0.01% 0.05%
Mar/10 Jun/10 Sep/10 Dec/10 Mar/11 Jun/11 Sep/11 Dec/11 Mar/12 Jun/12 Sep/12 Dec/12 Mar/13 Jun/13
Middle
Total
Corporate
Financial highlights
Midsized
Business
Midsized
Business
11
Credit Portfolio Quality
Write Off in the quarter (% of loan portfolio)
Transactions between D-H rating (Resolution 2682 of Brazilian Central Bank)
0.37%
0.50% 0.46%
0.27%
0.47%
0.32%
0.77%
0.57%
0.22% 0.21%
0.55%
0.64% 0.55% 0.60%
0.29%
0.10% 0.15% 0.08% 0.10% 0.06%
0.24% 0.15%
0.06% 0.08%
0.20%
0.40% 0.46%
0.15%
0.27%
0.00% 0.07% 0.03% 0.00% -0.01% 0.08% 0.02% 0.01% 0.04% 0.10%
0.32%
0.44%
0.00%
Mar/10 Jun/10 Sep/10 Dec/10 Mar/11 Jun/11 Sep/11 Dec/11 Mar/12 Jun/12 Sep/12 Dec/12 Mar/13 Jun/13
Middle
Total
Corporate
3.1% 3.0%
2.4%
2.1%
2.0% 1.9% 2.0%
2.4%
2.7% 2.5% 2.6%
3.3%
3.1% 3.2%
Mar/10 Jun/10 Sep/10 Dec/10 Mar/11 Jun/11 Sep/11 Dec/11 Mar/12 Jun/12 Sep/12 Dec/12 Mar/13 Jun/13
D-H
Financial highlights
Midsized
Business
12
Financial Margin
NIM (% p.a.)
(BRL million) 2Q13 1Q13 Chg (%) 2Q12 Chg (%) 6M13 6M12 Chg (%)
Net Interest Income before Loan Loss Provision (LLP) 145.3 147.1 -1.3% 144.4 0.6% 292.4 285.3 2.5%
Shareholders' Equity Remunerated at CDI Rate 31.4 26.2 19.8% 32.0 -2.1% 57.6 68.8 -16.4%
Financial Margin with Clients 97.0 97.4 -0.4% 89.6 8.2% 194.4 174.5 11.4%
Financial Margin with Market 16.9 23.6 -28.4% 22.7 -25.7% 40.5 42.0 -3.6%
Loan Loss Provision (LLP) (31.3) (16.9) 85.5% (28.7) 9.4% (48.2) (52.4) -7.9%
Managerial Financial Margin 113.9 130.3 -12.5% 115.7 -1.6% 244.2 232.9 4.8%
5.0% 4.8% 4.7% 4.6% 4.3%
5.1%
4.5%
2Q12 3Q12 4Q12 1Q13 2Q13 6M12 6M13
Financial highlights
Income from Services
14.9 16.5 17.4 19.6 20.8 22.6 23.5 23.8 24.2 26.0 27.4 26.6 27.2
30.2
7.1
8.1 4.9
6.9 6.8 5.4 4.2 3.8 3.3
4.1
4.6 6.3 4.8
7.9
2.4
1.6
0.5
8.2
2.0 2.8 2.4
7.2
1.9
2.0
3.1
7.9
1.0
6.4
1Q10 2Q10 3Q10 4Q10 1Q11 2Q11 3Q11 4Q11 1Q12 2Q12 3Q12 4Q12 1Q13 2Q13
Capital Markets and M&A Fees
Banking Tariffs
Guarantees Issued
(BRL million)
20.5% 20.1% 17.6%
23.8%
19.7% 20.3% 18.3% 20.6% 18.3% 19.0% 20.7% 23.2%
19.7%
23.2%
Income from Services
Total Revenues
Banking Service Fees (BRL million) 2Q13 1Q13 Chg (%) 2Q12 Chg (%) 6M13 6M12 Chg (%)
Guarantees Issued 30.2 27.2 11.1% 26.0 16.0% 57.4 50.2 14.3%
Capital Markets and M&A Fees 6.4 1.0 534.6% 2.0 223.7% 7.5 3.9 92.0%
Banking Tariffs 7.9 4.8 65.2% 4.1 92.0% 12.6 7.4 71.0%
Total 44.5 33.0 35.0% 32.1 38.6% 77.4 61.4 26.0%
Financial highlights14
Expenses
Efficiency Ratio (Cost/Income)
36.9% 35.3% 38.4% 39.2% 36.4% 35.5% 37.7%
2Q12 3Q12 4Q12 1Q13 2Q13 6M12 6M13
Expenses (BRL million) 2Q13 1Q13 Chg (%) 2Q12 Chg (%) 6M13 6M12 Chg (%)
Personnel (34.7) (32.7) 6.0% (32.2) 7.5% (67.4) (63.3) 6.4%
Other Administrative Expenses (18.5) (17.6) 5.1% (19.6) -5.9% (36.0) (35.3) 2.0%
Profit Sharing (20.6) (18.6) 11.0% (13.1) 57.4% (39.2) (23.1) 69.6%
Total (73.8) (68.9) 7.1% (65.0) 13.5% (142.6) (121.8) 17.1%
Financial highlights
Profitability
Net Income (BRL Million)
ROAE (% p.a.)
55.0 55.1 59.6 60.1 64.7
111.9
124.8
2Q12 3Q12 4Q12 1Q13 2Q13 6M12 6M13
14.2% 13.8% 14.4% 14.1% 14.6% 14.6% 14.3%
2Q12 3Q12 4Q12 1Q13 2Q13 6M12 6M13
Financial highlights
Strategy, business segments and products
Funding and capital base
Financial highlights
Ownership structure
Investor Presentation August 2013
Ownership Structure
ABC Brasil
58.5%
7.1%
34.4%
Total Capital
89.5%
10.5%
Voting Capital
59.4%
29.7%
10.9%
Arab Banking Corporation
(Parent Company)
International bank headquartered in Bahrain
Arab Banking Corporation
Local Management and Directors
Free-float
Central Bank of Libya
Kuwait Investment Authority
Free-float
(As of June, 2013)
Ownership structure
Controlling Shareholder
International bank headquartered in Bahrain
Listed on the Bahrain stock exchange
Total Assets: US$ 25.3 Bn
Shareholders’ Equity: US$ 3.8 Bn
BIS Ratio: 22.7%
Core capital (Tier I): 18.7%
Main Shareholders
Central Bank of Libya 59.4%
Kuwait Investment Authority 29.7%
Free-float 10.9%
Ownership structure19
Contact
Website: www.abcbrasil.com.br
Phone: +55 (11) 3170-2500
20
Expanded Credit Portfolio
(BRL million) Jun/13 Mar/13 Chg 3M (%) Jun/12 Chg 12M (%)
Loans 8,937.4 8,607.7 3.8% 8,519.8 4.9%
Corporate 6,785.0 6,638.3 2.2% 6,680.2 1.6%
Midsized Business 2,152.4 1,969.4 9.3% 1,839.6 17.0%
Guarantees Issued 7,055.5 6,421.6 9.9% 5,882.3 19.9%
Corporate 6,971.1 6,362.3 9.6% 5,843.8 19.3%
Midsized Business 84.4 59.3 42.3% 38.6 119.0%
Corporate Securities 886.1 790.2 12.1% 536.0 65.3%
Corporate 852.3 760.8 12.0% 505.3 68.7%
Midsized Business 33.8 29.4 15.1% 30.7 10.2%
Expanded Credit Portfolio 16,879.0 15,819.6 6.7% 14,938.1 13.0%
Corporate Total 14,608.4 13,790.8 5.9% 13,059.9 11.9%
Midsized Business 2,270.6 2,028.8 11.9% 1,878.2 20.9%
Appendix21
Corporate Structure
Appendix22
(As of October, 2013)
Board of Directors
Members
Anwar Ali Al Mudhaf (Kuwaiti) ABC Brasil Chairman & Arab Banking
Corporation Board Member
Tito Enrique da Silva Neto (Brazilian) Vice Chairman & Former CEO of
Banco ABC Brasil
Roy Hannay Gardner (Scottish) Arab Banking Corporation Executive
Vernom Handley (British) Arab Banking Corporation Executive
Paul Henry Jennings* (British) Arab Banking Corporation Executive
Ricardo Alves Lima (Brazilian) Independent Member
Edgar Uchôa (Brazilian) Independent Member
* Waiting ratification by the Central Bank of Brazil.
Appendix23
(As of October, 2013)
Brazilian Banking Sector
ABC Brasil focuses on the Corporate and Middle Market segments.
Appendix24
History in Brazil
Appendix25
Disclaimer
The following material, on this date, is a presentation containing general information about the Banco ABC Brasil S.A. We offer no guarantee and make no
declaration, implicitly or explicitly, as to the accuracy, completeness or scope of this information.
This presentation may include forward-looking statements of future events or results according to the regulations of the Brazilian and International securities
and exchange commissions. These statements are based on certain assumptions and analyses by the Company that reflect its experience, the economic
environment, future market conditions and expected events by the company, many of which are beyond the control of the Company. Important factors that
may lead to significant differences between the actual results and the statements of expectations about future events or results include the company’s business
strategy, Brazilian and International economic conditions, technology, financial strategy, financial market conditions, uncertainty regarding the results of its
future operations, plans, objectives, expectations and intentions, among others. Considering these factors, the actual results of the company may be
significantly different from those shown or implicit in the statement of expectations about future events or results.
The information and opinions contained in this presentation should not be understood as a recommendation to potential investors and no investment decision
is to be based on the veracity, current events or completeness of this information or these opinions. No advisors to the company or parties related to them or
their representatives should have any responsibility for any losses that may result from the use or contents of this presentation.

Abc brasil investor_presentation2q13_eng

  • 1.
  • 2.
    Strategy, business segments andproducts Funding and capital base Financial highlights Ownership structure Investor Presentation October 2013
  • 3.
    Distinct strategy foreach business segment:  Increase profitability per client in Corporate, through increased cross-selling of products;  Grow the number of clients in the Midsized Business segment. Portfolio Mix: increase in Midsized Business segment participation. Estratégia, segmentos e produtos Focus on Companies Banco ABC Brasil is a commercial bank, specializing in lending and services for mid-size to large companies. Expanded Credit Portfolio* * Includes Loans, Guarantees Issued and Corporate Securities portfolios 89% 87% 85% 84% 87% 86% 86% 87% 11% 11% 12% 14% 13% 14% 14% 13% Dec/06 Dec/07 Dec/08 Dec/09 Dec/10 Dec/11 Dec/12 Jun/13 Corporate Middle Market Outros 11,762 8,651 6,660 5,227 3,045 CAGR = 30% 13,169 6.2% (BRL million) 15,318 16,879 Strategy, business segments and products Midsized Business 3
  • 4.
    734 701 726 535541 534 23.4 24.0 25.8 329 341 362 536 790 886 Estratégia, segmentos e produtos Corporate (annual revenues above BRL 400 million) Strategy: Grow the profitability per client, through increasing cross-selling of products. Products:  loans denominated in BRL and foreign currencies  trade finance  underwriting and structuring advisory services for capital markets transactions  arrangement of syndicated loans in Brazil and abroad  BNDES onlending transactions  M&A transactions  treasury products Average Ticket (BRL million) Average Tenor (days) Total Number of Clients Clients with Credit Exposure Jun/12 Mar/13 Jun/13 Corporate Securities (BRL million) Loans and Guarantees Issued (BRL million) 53% 53% 52% 22% 18% 18% 16% 19% 19%9% 10% 11% Jun/12 Mar/13 Jun/13 South Rio de Janeiro São Paulo - Countryside São Paulo - Capital 13,060 13,791 14,608 Strategy, business segments and products4
  • 5.
    1,154 1,357 1,337 9491,007 1,024 2.0 2.0 2.2 212 241 265 Estratégia, segmentos e produtos Midsized Business (annual revenues between BRL 30 and 400 million) Strategy: Grow the number of clients, mainly in new regions. Average Ticket (BRL million) Average Tenor (days) Total Number of Clients Clients with Credit Exposure Jun/12 Mar/13 Jun/13 Loans and Guarantees Issued (BRL million) Mature Business Platforms (> Efficiency) SP1 SP2 SP3 PR RS 5 Business Platforms In evolution (+RMs) (> Efficiency) MG RJ SC GO MT Campinas Ribeirão Preto 7 41% 38% 36% 13% 14% 14%9% 8% 8% 27% 26% 27% 10% 14% 15% Jun/12 Mar/13 Jun/13 Belo Horizonte South Rio de Janeiro São Paulo - Countryside São Paulo - Capital 1,878 2,029 2,271 Strategy, business segments and products5
  • 6.
    Strategy, business segmentsand products Funding and capital base Financial highlights Ownership structure Investor Presentation October 2013
  • 7.
    Funding & Ratings Diversifiedfunding with access to local and international sources Jun/12 Sep/12 Dec/12 Mar/13 Jun/13 Investment Grade Local brAA+ Aa1.Br AA Global BBB- Baa3 BBB- 13% 13% 14% 14% 13% 5% 6% 7% 7% 7% Subordinated Debt Shareholders' Equity 2,227 2,347 2,618 2,676 2,781 19% 18% 15% 15% 14% BNDES 2,279 2,165 1,854 1,856 1,886 12% 10% 8% 8% 10% 6% 8% 10% 13% 15% Notes, Deposits & Others Trade Finance 2,140 2,226 2,186 2,611 3,390 9% 9% 9% 10% 9% 9% 9% 8% 8% 7% 11% 10% 10% 5% 4% 10% 9% 9% 9% 9% 6% 8% 10% 11% 12% Local Bonds (LFs) Individual Investors Financial Institutions Institutional Investors Corporate Investors 41%45% 45% 46% 43% 5,353 5,575 5,542 5,395 5,772 12,000 12,313 12,199 12,538 13,830 Total (BRL million) Funding and capital base International Local 7
  • 8.
    Assets & Liabilitiesby maturity 4,983 3,617 2,707 3,599 758 705 2,494 4,121 3,406 3,069 303 1,179 2,490 (504) (699) 530 455 (474) 1-30 days 31-180 days 181-360 days 1-3 years 4-5 years >5 years Assets Liabilites Gap (BRL million) 2,490 1,985 1,286 1,817 2,271 1,798 Accumulated Gap Funding and capital base (As of June, 2013) 8
  • 9.
    Basel Index &Shareholders’ Equity 10.2% 10.9% 10.6% 10.8% 10.9% 4.0% 4.1% 5.3% 5.0% 5.4% Jun/12 Sep/12 Dec/12 Mar/13 Jun/13 Tier II Tier I (Core Capital) 14.2% 15.0% 15.9% 15.8% 16.3% Capital Adequacy (BRL million) Jun/13 Mar/13 Chg 3M (%) / p.p. Jun/12 Chg 12M (%) / p.p. Capital 2,690.8 2,573.7 4.6% 2,180.8 23.4% Mininum Capital Required 1,819.9 1,791.9 1.6% 1,687.7 7.8% Capital Surplus 870.9 781.8 11.4% 493.0 76.6% Basel Ratio 16.3% 15.8% 0.5 14.2% 2.1 Tier I (Core Capital) 10.9% 10.8% 0.1 10.2% 0.7 Tier II 5.4% 5.0% 0.4 4.0% 1.4 Funding and capital base 2,181 2,257 2,507 2,574 2,691 1,566 1,639 1,680 1,757 1,794 Patrimônio de Referência Patrimônio Líquido (R$ milhões) Reference Equity Shareholders’ Equity 9
  • 10.
    Strategy, business segmentsand products Funding and capital base Financial highlights Ownership structure Investor Presentation October 2013
  • 11.
    Credit Portfolio Quality PastDue above 90 days (% of loan portfolio) Loan Loss Reserve (% of loan portfolio) 3.33% 3.64% 3.63% 3.60% 3.59% 3.45% 3.02% 3.00% 3.68% 4.06% 3.99% 4.02% 4.27% 3.83% 1.86% 1.74% 1.64% 1.62% 1.72% 1.69% 1.69% 1.73% 1.95% 2.04% 2.24% 2.15% 1.85% 1.98% 1.52% 1.29% 1.17% 1.13% 1.22% 1.18% 1.30% 1.33% 1.41% 1.48% 1.74% 1.54% 1.14% 1.40% Mar/10 Jun/10 Sep/10 Dec/10 Mar/11 Jun/11 Sep/11 Dec/11 Mar/12 Jun/12 Sep/12 Dec/12 Mar/13 Jun/13 Middle Total Corporate 0.65% 0.60% 0.71% 0.39% 0.57% 0.40% 0.51% 0.50% 0.87% 1.02% 1.03% 0.95% 1.06% 0.76% 0.31% 0.21% 0.21% 0.11% 0.17% 0.15% 0.19% 0.21% 0.57% 0.52% 0.56% 0.36% 0.25% 0.22% 0.23% 0.12% 0.09% 0.05% 0.06% 0.08% 0.09% 0.11% 0.47% 0.39% 0.42% 0.17% 0.01% 0.05% Mar/10 Jun/10 Sep/10 Dec/10 Mar/11 Jun/11 Sep/11 Dec/11 Mar/12 Jun/12 Sep/12 Dec/12 Mar/13 Jun/13 Middle Total Corporate Financial highlights Midsized Business Midsized Business 11
  • 12.
    Credit Portfolio Quality WriteOff in the quarter (% of loan portfolio) Transactions between D-H rating (Resolution 2682 of Brazilian Central Bank) 0.37% 0.50% 0.46% 0.27% 0.47% 0.32% 0.77% 0.57% 0.22% 0.21% 0.55% 0.64% 0.55% 0.60% 0.29% 0.10% 0.15% 0.08% 0.10% 0.06% 0.24% 0.15% 0.06% 0.08% 0.20% 0.40% 0.46% 0.15% 0.27% 0.00% 0.07% 0.03% 0.00% -0.01% 0.08% 0.02% 0.01% 0.04% 0.10% 0.32% 0.44% 0.00% Mar/10 Jun/10 Sep/10 Dec/10 Mar/11 Jun/11 Sep/11 Dec/11 Mar/12 Jun/12 Sep/12 Dec/12 Mar/13 Jun/13 Middle Total Corporate 3.1% 3.0% 2.4% 2.1% 2.0% 1.9% 2.0% 2.4% 2.7% 2.5% 2.6% 3.3% 3.1% 3.2% Mar/10 Jun/10 Sep/10 Dec/10 Mar/11 Jun/11 Sep/11 Dec/11 Mar/12 Jun/12 Sep/12 Dec/12 Mar/13 Jun/13 D-H Financial highlights Midsized Business 12
  • 13.
    Financial Margin NIM (%p.a.) (BRL million) 2Q13 1Q13 Chg (%) 2Q12 Chg (%) 6M13 6M12 Chg (%) Net Interest Income before Loan Loss Provision (LLP) 145.3 147.1 -1.3% 144.4 0.6% 292.4 285.3 2.5% Shareholders' Equity Remunerated at CDI Rate 31.4 26.2 19.8% 32.0 -2.1% 57.6 68.8 -16.4% Financial Margin with Clients 97.0 97.4 -0.4% 89.6 8.2% 194.4 174.5 11.4% Financial Margin with Market 16.9 23.6 -28.4% 22.7 -25.7% 40.5 42.0 -3.6% Loan Loss Provision (LLP) (31.3) (16.9) 85.5% (28.7) 9.4% (48.2) (52.4) -7.9% Managerial Financial Margin 113.9 130.3 -12.5% 115.7 -1.6% 244.2 232.9 4.8% 5.0% 4.8% 4.7% 4.6% 4.3% 5.1% 4.5% 2Q12 3Q12 4Q12 1Q13 2Q13 6M12 6M13 Financial highlights
  • 14.
    Income from Services 14.916.5 17.4 19.6 20.8 22.6 23.5 23.8 24.2 26.0 27.4 26.6 27.2 30.2 7.1 8.1 4.9 6.9 6.8 5.4 4.2 3.8 3.3 4.1 4.6 6.3 4.8 7.9 2.4 1.6 0.5 8.2 2.0 2.8 2.4 7.2 1.9 2.0 3.1 7.9 1.0 6.4 1Q10 2Q10 3Q10 4Q10 1Q11 2Q11 3Q11 4Q11 1Q12 2Q12 3Q12 4Q12 1Q13 2Q13 Capital Markets and M&A Fees Banking Tariffs Guarantees Issued (BRL million) 20.5% 20.1% 17.6% 23.8% 19.7% 20.3% 18.3% 20.6% 18.3% 19.0% 20.7% 23.2% 19.7% 23.2% Income from Services Total Revenues Banking Service Fees (BRL million) 2Q13 1Q13 Chg (%) 2Q12 Chg (%) 6M13 6M12 Chg (%) Guarantees Issued 30.2 27.2 11.1% 26.0 16.0% 57.4 50.2 14.3% Capital Markets and M&A Fees 6.4 1.0 534.6% 2.0 223.7% 7.5 3.9 92.0% Banking Tariffs 7.9 4.8 65.2% 4.1 92.0% 12.6 7.4 71.0% Total 44.5 33.0 35.0% 32.1 38.6% 77.4 61.4 26.0% Financial highlights14
  • 15.
    Expenses Efficiency Ratio (Cost/Income) 36.9%35.3% 38.4% 39.2% 36.4% 35.5% 37.7% 2Q12 3Q12 4Q12 1Q13 2Q13 6M12 6M13 Expenses (BRL million) 2Q13 1Q13 Chg (%) 2Q12 Chg (%) 6M13 6M12 Chg (%) Personnel (34.7) (32.7) 6.0% (32.2) 7.5% (67.4) (63.3) 6.4% Other Administrative Expenses (18.5) (17.6) 5.1% (19.6) -5.9% (36.0) (35.3) 2.0% Profit Sharing (20.6) (18.6) 11.0% (13.1) 57.4% (39.2) (23.1) 69.6% Total (73.8) (68.9) 7.1% (65.0) 13.5% (142.6) (121.8) 17.1% Financial highlights
  • 16.
    Profitability Net Income (BRLMillion) ROAE (% p.a.) 55.0 55.1 59.6 60.1 64.7 111.9 124.8 2Q12 3Q12 4Q12 1Q13 2Q13 6M12 6M13 14.2% 13.8% 14.4% 14.1% 14.6% 14.6% 14.3% 2Q12 3Q12 4Q12 1Q13 2Q13 6M12 6M13 Financial highlights
  • 17.
    Strategy, business segmentsand products Funding and capital base Financial highlights Ownership structure Investor Presentation August 2013
  • 18.
    Ownership Structure ABC Brasil 58.5% 7.1% 34.4% TotalCapital 89.5% 10.5% Voting Capital 59.4% 29.7% 10.9% Arab Banking Corporation (Parent Company) International bank headquartered in Bahrain Arab Banking Corporation Local Management and Directors Free-float Central Bank of Libya Kuwait Investment Authority Free-float (As of June, 2013) Ownership structure
  • 19.
    Controlling Shareholder International bankheadquartered in Bahrain Listed on the Bahrain stock exchange Total Assets: US$ 25.3 Bn Shareholders’ Equity: US$ 3.8 Bn BIS Ratio: 22.7% Core capital (Tier I): 18.7% Main Shareholders Central Bank of Libya 59.4% Kuwait Investment Authority 29.7% Free-float 10.9% Ownership structure19
  • 20.
  • 21.
    Expanded Credit Portfolio (BRLmillion) Jun/13 Mar/13 Chg 3M (%) Jun/12 Chg 12M (%) Loans 8,937.4 8,607.7 3.8% 8,519.8 4.9% Corporate 6,785.0 6,638.3 2.2% 6,680.2 1.6% Midsized Business 2,152.4 1,969.4 9.3% 1,839.6 17.0% Guarantees Issued 7,055.5 6,421.6 9.9% 5,882.3 19.9% Corporate 6,971.1 6,362.3 9.6% 5,843.8 19.3% Midsized Business 84.4 59.3 42.3% 38.6 119.0% Corporate Securities 886.1 790.2 12.1% 536.0 65.3% Corporate 852.3 760.8 12.0% 505.3 68.7% Midsized Business 33.8 29.4 15.1% 30.7 10.2% Expanded Credit Portfolio 16,879.0 15,819.6 6.7% 14,938.1 13.0% Corporate Total 14,608.4 13,790.8 5.9% 13,059.9 11.9% Midsized Business 2,270.6 2,028.8 11.9% 1,878.2 20.9% Appendix21
  • 22.
  • 23.
    Board of Directors Members AnwarAli Al Mudhaf (Kuwaiti) ABC Brasil Chairman & Arab Banking Corporation Board Member Tito Enrique da Silva Neto (Brazilian) Vice Chairman & Former CEO of Banco ABC Brasil Roy Hannay Gardner (Scottish) Arab Banking Corporation Executive Vernom Handley (British) Arab Banking Corporation Executive Paul Henry Jennings* (British) Arab Banking Corporation Executive Ricardo Alves Lima (Brazilian) Independent Member Edgar Uchôa (Brazilian) Independent Member * Waiting ratification by the Central Bank of Brazil. Appendix23 (As of October, 2013)
  • 24.
    Brazilian Banking Sector ABCBrasil focuses on the Corporate and Middle Market segments. Appendix24
  • 25.
  • 26.
    Disclaimer The following material,on this date, is a presentation containing general information about the Banco ABC Brasil S.A. We offer no guarantee and make no declaration, implicitly or explicitly, as to the accuracy, completeness or scope of this information. This presentation may include forward-looking statements of future events or results according to the regulations of the Brazilian and International securities and exchange commissions. These statements are based on certain assumptions and analyses by the Company that reflect its experience, the economic environment, future market conditions and expected events by the company, many of which are beyond the control of the Company. Important factors that may lead to significant differences between the actual results and the statements of expectations about future events or results include the company’s business strategy, Brazilian and International economic conditions, technology, financial strategy, financial market conditions, uncertainty regarding the results of its future operations, plans, objectives, expectations and intentions, among others. Considering these factors, the actual results of the company may be significantly different from those shown or implicit in the statement of expectations about future events or results. The information and opinions contained in this presentation should not be understood as a recommendation to potential investors and no investment decision is to be based on the veracity, current events or completeness of this information or these opinions. No advisors to the company or parties related to them or their representatives should have any responsibility for any losses that may result from the use or contents of this presentation.