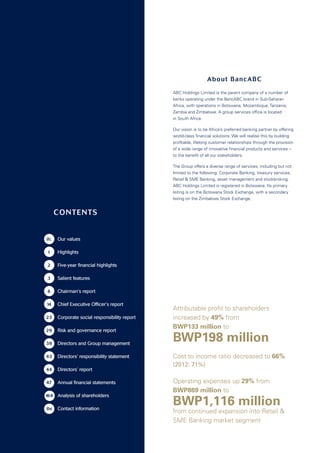
This document provides an annual report summary for ABC Holdings Limited for the year ending 2013. Some key highlights include:
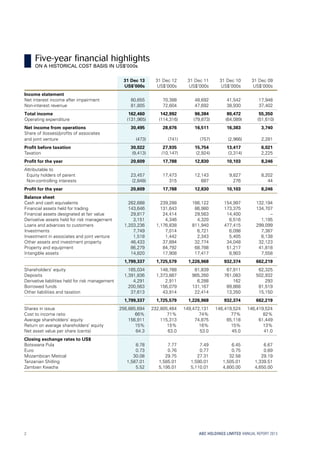
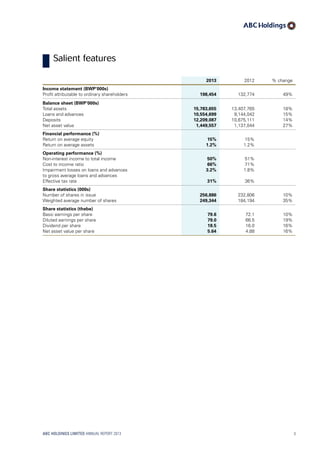
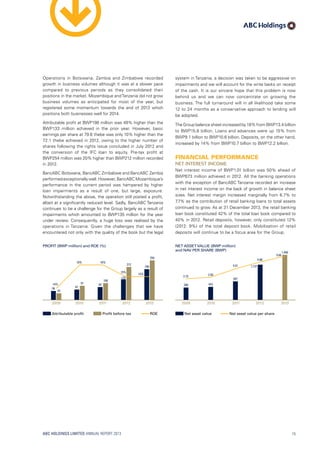
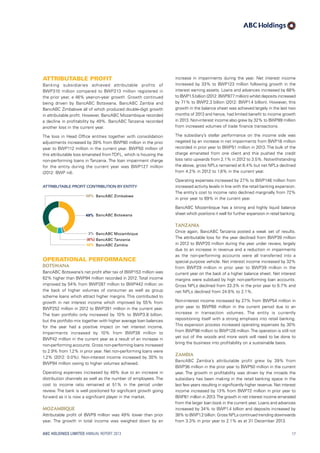
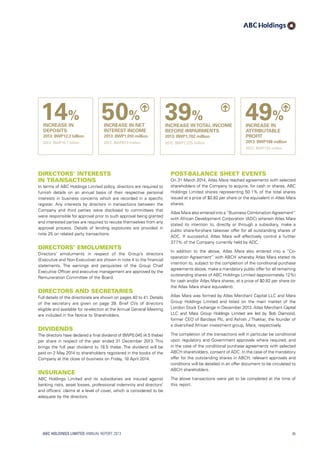
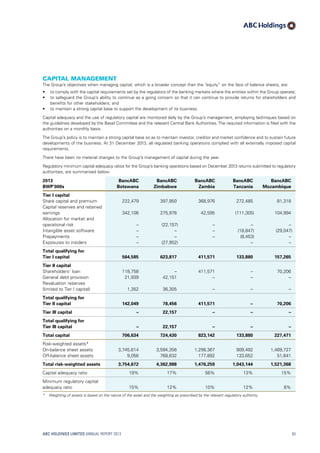
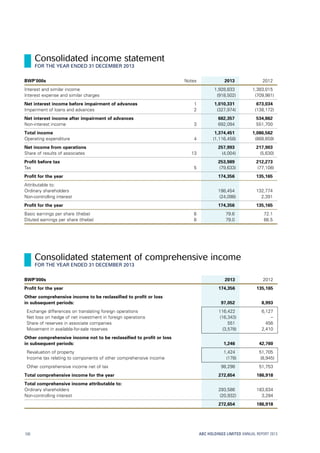
- Attributable profit to shareholders increased 49% from BWP133 million to BWP198 million.
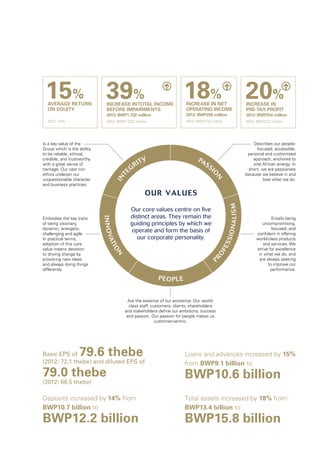
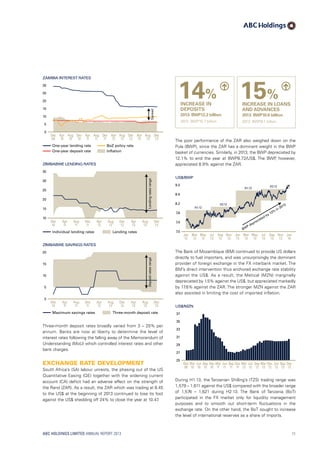
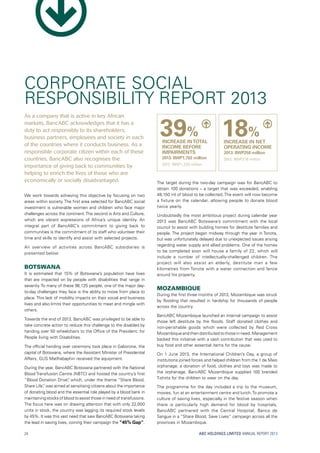
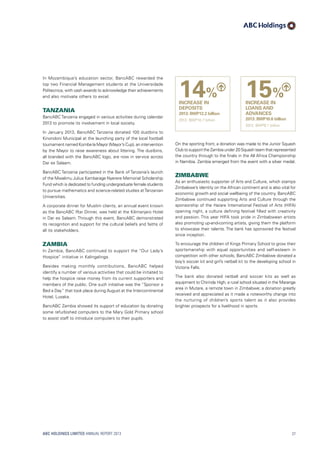
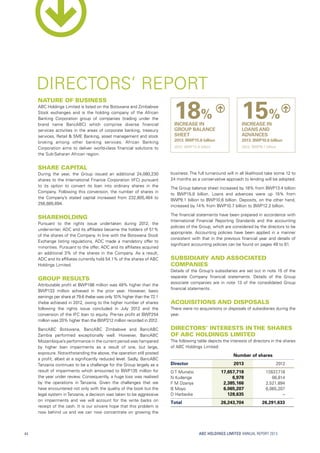
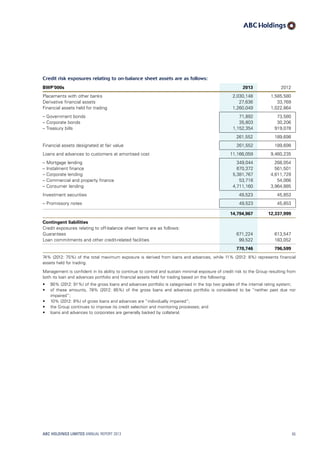
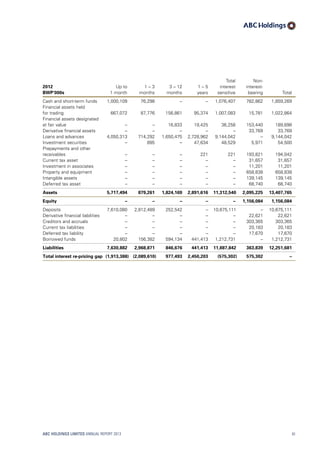
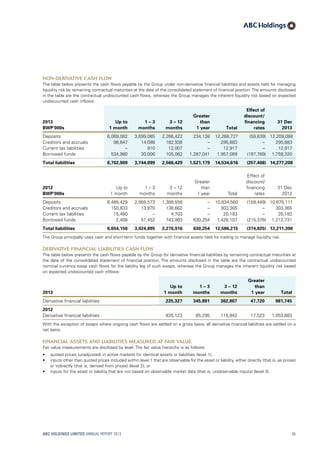
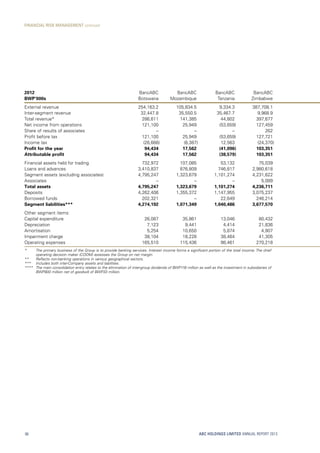
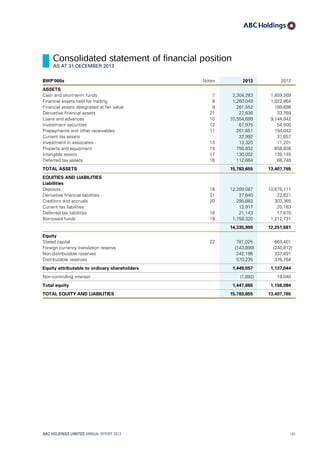
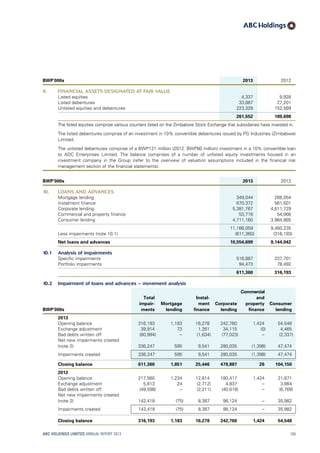
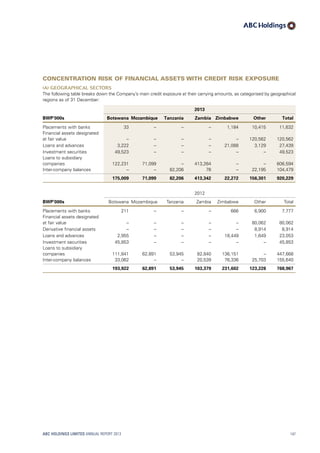
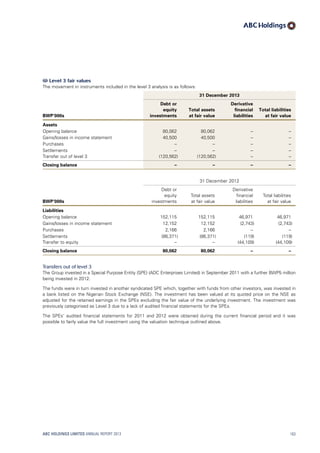
- Total assets increased 18% from BWP13.4 billion to BWP15.8 billion. Loans and advances increased 15% while deposits grew 14%.
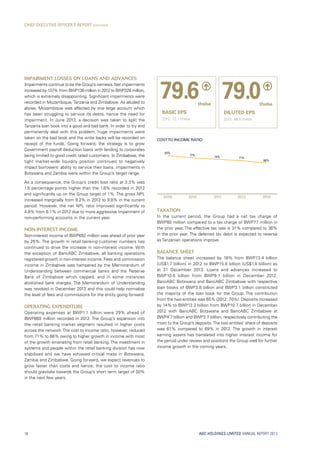
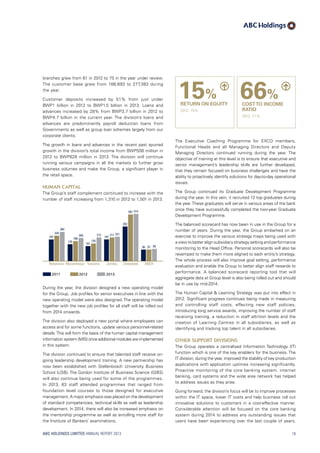
- Non-interest income accounted for 50% of total income while the cost to income ratio improved to 66% from 71%.
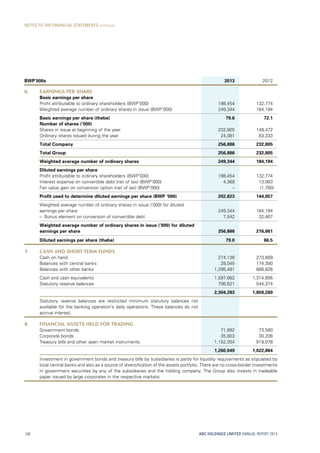
- Basic earnings per share grew 10% to 79.6 thebe and net asset value per share increased 16% to 5.64 thebe.


![AvivaAtAGlance[1] (1)](https://cdn.slidesharecdn.com/ss_thumbnails/0383d1f9-7eaf-47be-83f1-f4a102e2de00-160917012456-thumbnail.jpg?width=640&height=640&fit=bounds)


