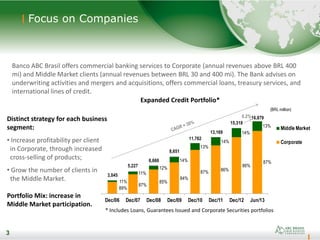
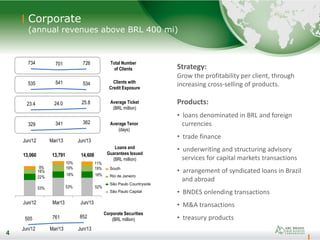
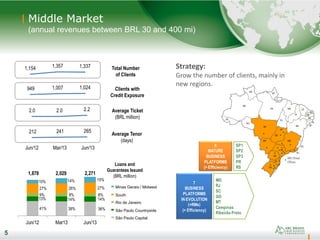
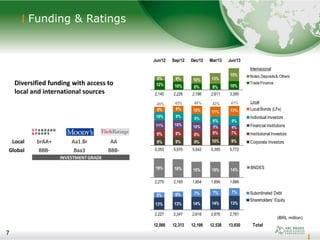
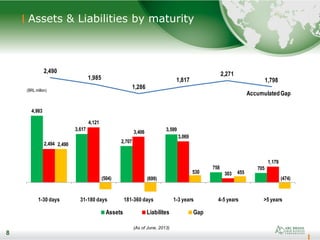
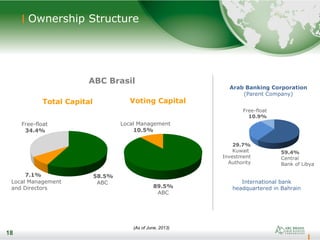
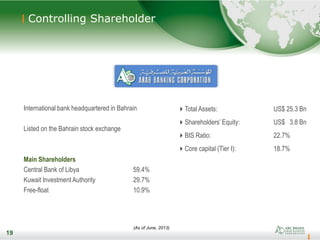
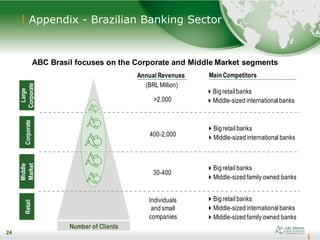
1
Investor Presentation
August 2013
2
. Strategy, business segments and products
. Funding and capital base
. Financial highlights
. Ownership structure
3
89%
87%
85%
84%
87% 86%
86%
87%
11%
11%
12%
14%
13%
14%
14%
13%
Dec/06 Dec/07 Dec/08 Dec/09 Dec/10 Dec/11 Dec/12 Jun/13
Middle Market
Corporate
11,762
8,651
6,660
5,227
3,045
13,169
6.2%
(BRL million)
15,318
16,879
3
Focus on Companies
3
Expanded Credit Portfolio*
Banco ABC Brasil offers commercial banking services to Corporate (annual revenues above BRL 400
mi) and Middle Market clients (annual revenues between BRL 30 and 400 mi). The Bank advises on
underwriting activities and mergers and acquisitions, offers commercial loans, treasury services, and
international lines of credit.
Distinct strategy for each business
segment:
• Increase profitability per client
in Corporate, through increased
cross-selling of products;
• Grow the number of clients in
the Middle Market.
Portfolio Mix: increase in
Middle Market participation.
* Includes Loans, Guarantees Issued and Corporate Securities portfolios
4
53% 53% 52%
22%
18% 18%
16%
19% 19%9%
10% 11%
Jun/12 Mar13 Jun/13
13,060 13,791 14,608
Corporate
(annual revenues above BRL 400 mi)
4
Average Ticket
(BRL million)
Average Tenor
(days)
Total Number
of Clients
Clients with
Credit Exposure
South
Rio de Janeiro
São Paulo Countryside
São Paulo Capital
Corporate Securities
(BRL million)
Loans and
Guarantees Issued
(BRL million)
Strategy:
Grow the profitability per client, through
increasing cross-selling of products.
Products:
• loans denominated in BRL and foreign
currencies
• trade finance
• underwriting and structuring advisory
services for capital markets transactions
• arrangement of syndicated loans in Brazil
and abroad
• BNDES onlending transactions
• M&A transactions
• treasury products
Jun/12 Mar/13 Jun/13
734 701 726
535 541 534
23.4 24.0 25.8
329 341 362
505 761 852
5
41% 38% 36%
13% 14% 14%
9% 8% 8%
27% 26% 27%
10% 14% 15%
Jun/12 Mar13 Jun/13
1,878 2,029 2,271
RO
AC
AM
RR
PA
AP
MA
PI
CE
BA
MG
ES
RJ
SP
PR
SC
RS
MS
MT
GO
DF
RN
PB
PE
AL
SE
TO
ABC Brasil
Offices
Middle Market
(annual revenues between BRL 30 and 400 mi)
5
Strategy:
Grow the number of clients, mainly in
new regions.
Average Ticket
(BRL million)
Average Tenor
(days)
Total Number
of Clients
Clients with
Credit Exposure
Minas Gerais / Midwest
South
Rio de Janeiro
São Paulo Countryside
São Paulo Capital
Loans and
Guarantees Issued
(BRL million)
Jun/12 Mar/13 Jun/13
1,154 1,357 1,337
949 1,007 1,024
2.0 2.0 2.2
212 241 265
7
BUSINESS
PLATFORMS
IN EVOLUTION
(+RMs)
(> Efficiency)
MG
RJ
SC
GO
MT
Campinas
Ribeirão Preto
5
MATURE
BUSINESS
PLATFORMS
(> Efficiency)
SP1
SP2
SP3
PR
RS
6
. Strategy, business segments and products
. Funding and capital base
. Financial highlights
. Ownership structure
7
Funding & Ratings
7
(BRL million)
Diversified funding with access to
local and international sources
Local brAA+ Aa1.Br AA
Global BBB- Baa3 BBB-
INVESTMENTGRADE
Jun/12 Sep/12 Dec/12 Mar/13 Jun/13
2,140 2,226 2,186 2,611 3,390
5,353 5,575 5,542 5,395 5,772
2,279 2,165 1,854 1,856 1,886
2,227 2,347 2,618 2,676 2,781
12,000 12,313 12,199 12,538 13,830 Total
13% 13% 14% 14% 13%
5% 6% 7% 7% 7% Subordinated Debt
Shareholders' Equity
19% 18% 15% 15% 14%
BNDES
12% 10% 8% 8% 10%
6% 8% 10% 13%
15% Notes,Deposits& Others
TradeFinance
9% 9% 9% 10% 9%
9% 9% 8% 8% 7%
11% 10% 10% 5% 4%
10% 9%
9%
9% 9%
6% 8% 10% 11% 12% Local Bonds (LFs)
Individual Investors
Financial Institutions
Institutional Investors
Corporate Investors
41%45% 45% 46% 43%
Internacional
Local
8
Assets & Liabilities by maturity
8
(As of June, 2013)
4,983
3,617
2,707
3,599
758 705
2,494
4,121
3,406
3,069
303
1,179
2,490
(504) (699)
530 455
(474)
1-30 days 31-180 days 181-360 days 1-3 years 4-5 years >5 years
Assets Liabilites Gap
2,490
1,985
1,286
1,817
2,271
1,798
AccumulatedGap
(BRL million)
9
Basel Index & Shareholders’ Equity
9
10.2% 10.9% 10.6% 10.8% 10.9%
4.0% 4.1% 5.3% 5.0% 5.4%
Jun/12 Sep/12 Dec/12 Mar/13 Jun/13
TierII
TierI (Core Capital)
14.2% 15.0% 15.9% 15.8% 16.3%
Basel2
2,181 2,257
2,507 2,574 2,691
1,566 1,639 1,680 1,757 1,794
Reference Equity
Shareholders' Equity
(BRL million)
Capital Adequacy (BRL million) Jun/13 Mar/13
Chg 3M
(%) / p.p.
Jun/12
Chg 12M
(%) / p.p.
Capital 2,690.8 2,573.7 4.6% 2,180.8 23.4%
Mininum Capital Required 1,819.9 1,791.9 1.6% 1,687.7 7.8%
Capital Surplus 870.9 781.8 11.4% 493.0 76.6%
Basel Ratio 16.3% 15.8% 0.5 14.2% 2.1
Tier I (Core Capital) 10.9% 10.8% 0.1 10.2% 0.7
Tier II 5.4% 5.0% 0.4 4.0% 1.4
10
. Strategy, business segments and products
. Funding and capital base
. Financial highlights
. Ownership structure
11
11
Credit Portfolio Quality
Past Due above 90 days (% of loan portfolio)
Loan Loss Reserve (% of loan portfolio)
0.65% 0.60%
0.71%
0.39%
0.57%
0.40%
0.51% 0.50%
0.87% 1.02% 1.03% 0.95%
1.06%
0.76%
0.31% 0.21% 0.21% 0.11% 0.17% 0.15% 0.19% 0.21%
0.57% 0.52% 0.56%
0.36% 0.25% 0.22%
0.23% 0.12% 0.09% 0.05% 0.06% 0.08% 0.09% 0.11%
0.47% 0.39% 0.42%
0.17% 0.01% 0.05%
Mar/10 Jun/10 Sep/10 Dec/10 Mar/11 Jun/11 Sep/11 Dec/11 Mar/12 Jun/12 Sep/12 Dec/12 Mar/13 Jun/13
Middle
Total
Corporate
3.33% 3.64% 3.63% 3.60% 3.59% 3.45%
3.02% 3.00%
3.68%
4.06% 3.99% 4.02% 4.27% 3.83%
1.86% 1.74% 1.64% 1.62% 1.72% 1.69% 1.69% 1.73% 1.95% 2.04% 2.24% 2.15% 1.85% 1.98%
1.52% 1.29% 1.17% 1.13% 1.22% 1.18% 1.30% 1.33% 1.41% 1.48% 1.74% 1.54% 1.14% 1.40%
Mar/10 Jun/10 Sep/10 Dec/10 Mar/11 Jun/11 Sep/11 Dec/11 Mar/12 Jun/12 Sep/12 Dec/12 Mar/13 Jun/13
Middle
Total
Corporate
12
12
Credit Portfolio Quality
Transactions between D-H rating
(Resolution 2682 of Brazilian Central Bank)
Write Off in the quarter (% of loan portfolio)
0.37%
0.50% 0.46%
0.27%
0.47%
0.32%
0.77%
0.57%
0.22% 0.21%
0.55% 0.64% 0.55% 0.60%
0.29%
0.10% 0.15% 0.08% 0.10% 0.06%
0.24% 0.15%
0.06% 0.08%
0.20%
0.40% 0.46%
0.15%
0.27%
0.00% 0.07% 0.03% 0.00% -0.01% 0.08% 0.02% 0.01% 0.04% 0.10%
0.32%
0.44%
0.00%
Mar/10 Jun/10 Sep/10 Dec/10 Mar/11 Jun/11 Sep/11 Dec/11 Mar/12 Jun/12 Sep/12 Dec/12 Mar/13 Jun/13
Middle
Total
Corporate
3.1% 3.0%
2.4%
2.1%
2.0% 1.9% 2.0%
2.4%
2.7% 2.5%
2.6%
3.3% 3.1% 3.2%
Mar/10 Jun/10 Sep/10 Dec/10 Mar/11 Jun/11 Sep/11 Dec/11 Mar/12 Jun/12 Sep/12 Dec/12 Mar/13 Jun/13
D-H
13
Financial Margin
13
NIM (% p.a.)
(BRL million) 2Q13 1Q13 Chg (%) 2Q12 Chg (%) 6M13 6M12 Chg (%)
Net Interest Income before Loan Loss Provision (LLP) 145.3 147.1 -1.3% 144.4 0.6% 292.4 285.3 2.5%
Shareholders' Equity Remunerated at CDI Rate 31.4 26.2 19.8% 32.0 -2.1% 57.6 68.8 -16.4%
Financial Margin with Clients 97.0 97.4 -0.4% 89.6 8.2% 194.4 174.5 11.4%
Financial Margin with Market 16.9 23.6 -28.4% 22.7 -25.7% 40.5 42.0 -3.6%
Loan Loss Provision (LLP) (31.3) (16.9) 85.5% (28.7) 9.4% (48.2) (52.4) -7.9%
Managerial Financial Margin 113.9 130.3 -12.5% 115.7 -1.6% 244.2 232.9 4.8%
5.0% 4.8% 4.7% 4.6% 4.3%
5.1%
4.5%
2Q12 3Q12 4Q12 1Q13 2Q13 6M12 6M13
14
Income from Services
14
Banking Service Fees (BRL million) 2Q13 1Q13 Chg (%) 2Q12 Chg (%) 6M13 6M12 Chg (%)
Guarantees Issued 30.2 27.2 11.1% 26.0 16.0% 57.4 50.2 14.3%
Capital Markets and M&A Fees 6.4 1.0 534.6% 2.0 223.7% 7.5 3.9 92.0%
Banking Tariffs 7.9 4.8 65.2% 4.1 92.0% 12.6 7.4 71.0%
Total 44.5 33.0 35.0% 32.1 38.6% 77.4 61.4 26.0%
14.9 16.5 17.4 19.6 20.8 22.6 23.5 23.8 24.2 26.0 27.4 26.6 27.2
30.2
7.1
8.1 4.9
6.9
6.8 5.4 4.2 3.8 3.3
4.1
4.6 6.3 4.8
7.9
2.4
1.6
0.5
8.2
2.0 2.8 2.4
7.2
1.9
2.0
3.1
7.9
1.0
6.4
1Q10 2Q10 3Q10 4Q10 1Q11 2Q11 3Q11 4Q11 1Q12 2Q12 3Q12 4Q12 1Q13 2Q13
CapitalMarkets and
M&A Fees
Banking Tariffs
GuaranteesIssued
(BRLmillion)
Income from Services
Totalof Revenues
20.5% 20.1%
17.6%
23.8%
19.7% 20.3%
18.3%
20.6%
18.3% 19.0%
20.7%
23.2%
19.7%
23.2%
15
Expenses
15
Efficiency Ratio (Cost/Income)
Expenses (BRL million) 2Q13 1Q13 Chg (%) 2Q12 Chg (%) 6M13 6M12 Chg (%)
Personnel (34.7) (32.7) 6.0% (32.2) 7.5% (67.4) (63.3) 6.4%
Other Administrative Expenses (18.5) (17.6) 5.1% (19.6) -5.9% (36.0) (35.3) 2.0%
Profit Sharing (20.6) (18.6) 11.0% (13.1) 57.4% (39.2) (23.1) 69.6%
Total (73.8) (68.9) 7.1% (65.0) 13.5% (142.6) (121.8) 17.1%
36.9% 35.3% 38.4% 39.2% 36.4% 35.5% 37.7%
2Q12 3Q12 4Q12 1Q13 2Q13 6M12 6M13
16
Profitability
16
Net Income (BRL Million) ROAE (% p.a.)
55.0 55.1 59.6 60.1 64.7
111.9
124.8
2Q12 3Q12 4Q12 1Q13 2Q13 6M12 6M13
14.2% 13.8% 14.4% 14.1% 14.6% 14.6% 14.3%
2Q12 3Q12 4Q12 1Q13 2Q13 6M12 6M13
17
. Strategy, business segments and products
. Funding and capital base
. Financial highlights
. Ownership structure
18
Ownership Structure
18
ABC Brasil
Local Management
10.5%
Voting CapitalTotal Capital
Free-float
34.4%
Local Management
and Directors
58.5%
ABC
89.5%
ABC
7.1%
59.4%
Central
Bank of Libya
29.7%
Kuwait
Investment
Authority
Free-float
10.9%
Arab Banking Corporation
(Parent Company)
International bank
headquartered in Bahrain
(As of June, 2013)
19
Controlling Shareholder
International bank headquartered in Bahrain
Listed on the Bahrain stock exchange
Main Shareholders
Central Bank of Libya 59.4%
Kuwait Investment Authority 29.7%
Free-float 10.9%
19
Total Assets: US$ 25.3 Bn
Shareholders’ Equity: US$ 3.8 Bn
BIS Ratio: 22.7%
Core capital (Tier I): 18.7%
(As of June, 2013)
20
20
Contact
Website: www.abcbrasil.com.br
Phone: +55 (11) 3170-2500
21
Appendix - Expanded Credit Portfolio
21
(BRL million) Jun/13 Mar/13 Chg 3M
(%)
Jun/12 Chg 12M
(%)Loans 8,937.4 8,607.7 3.8% 8,519.8 4.9%
Corporate 6,785.0 6,638.3 2.2% 6,680.2 1.6%
Middle 2,152.4 1,969.4 9.3% 1,839.6 17.0%
Guarantees Issued 7,055.5 6,421.6 9.9% 5,882.3 19.9%
Corporate 6,971.1 6,362.3 9.6% 5,843.8 19.3%
Middle 84.4 59.3 42.3% 38.6 119.0%
Corporate Securities 886.1 790.2 12.1% 536.0 65.3%
Corporate 852.3 760.8 12.0% 505.3 68.7%
Middle 33.8 29.4 15.1% 30.7 10.2%
Expanded Credit Portfolio 16,879.0 15,819.6 6.7% 14,938.1 13.0%
Corporate Total 14,608.4 13,790.8 5.9% 13,059.9 11.9%
Middle Total 2,270.6 2,028.8 11.9% 1,878.2 20.9%
22
22
Appendix - Corporate Structure
(As of June, 2013)
CEO
Anis ChacurNeto
Auditing Commitee
InternalAuditing
Financial Institutions
Human Resources Legal
Treasury& IR VP
Sergio Lulia Jacob
Commercial Middle VP
Gustavo Arantes Lanhoso
Commercial Corporate VP
Jose Eduardo Cintra Laloni
Risk VP
Renato Pasqualin Sobrinho
Financial & Administrative VP
Sergio Ricardo Borejo
Treasury
Products
IR & Marketing
Commercial MiddleCommercial Corporate
Capital Markets
Investment Banking
Credit Corporate
Credit Middle
Risk
Compliance
Financial Control
Back Office
Information Technology
Board of
Directors
Group Audit / Bahrain
Strategic Planning
23
23
Appendix - Board of Directors
Members
Anwar Ali Al Mudhaf (Kuwaiti) ABC Brasil Chairman & Arab Banking
Corporation Board Member
Tito Enrique da Silva Neto (Brazilian) Vice Chairman & Former CEO of
Banco ABC Brasil
Roy Hannay Gardner (Scottish) Arab Banking Corporation Executive
Vernom Handley (British) Arab Banking Corporation Executive
Paul Henry Jennings* (British) Arab Banking Corporation Executive
Ricardo Alves Lima (Brazilian) Independent Member
Edgar Uchôa (Brazilian) Independent Member
(As of June, 2013)
* Waiting ratification by the Central Bank of Brazil.
24
Appendix - Brazilian Banking Sector
24
ABC Brasil focuses on the Corporate and Middle Market segments
Large
CorporateCorporateRetail
Number of Clients
>2,000
400-2,000
30-400
Individuals
and small
companies
Big retail banks
Middle-sized international banks
Big retail banks
Middle-sized international banks
Big retail banks
Middle-sized family owned banks
Big retail banks
Middle-sized international banks
Middle-sized family owned banks
(BRL Million)
Annual Revenues Main Competitors
Middle
Market
25
IPO
1989 1997 2005 20132007
Appendix – History in Brazil
Arab Banking
Corporation and local
management acquire
Roberto Marinho
Group’s shares
The bank’s name
changes to
Banco ABC Brasil S.A.
The bank
structures its
Middle Market
operations
Arab Banking Corporation and
Roberto Marinho Group jointly
initiate Banco ABC Roma S.A.,
acting in the segments of
corporate lending, trade
finance and treasury
25
26
Disclaimer
The following material, on this date, is a presentation containing general information about the
Banco ABC Brasil S.A. We offer no guarantee and make no declaration, implicitly or explicitly,
as to the accuracy, completeness or scope of this information.
This presentation may include forward-looking statements of future events or results according
to the regulations of the Brazilian and International securities and exchange commissions.
These statements are based on certain assumptions and analyses by the Company that reflect
its experience, the economic environment, future market conditions and expected events by
the company, many of which are beyond the control of the Company. Important factors that
may lead to significant differences between the actual results and the statements of
expectations about future events or results include the company’s business strategy, Brazilian
and International economic conditions, technology, financial strategy, financial market
conditions, uncertainty regarding the results of its future operations, plans, objectives,
expectations and intentions, among others. Considering these factors, the actual results of the
company may be significantly different from those shown or implicit in the statement of
expectations about future events or results.
The information and opinions contained in this presentation should not be understood as a
recommendation to potential investors and no investment decision is to be based on the
veracity, current events or completeness of this information or these opinions. No advisors to
the company or parties related to them or their representatives should have any responsibility
for any losses that may result from the use or contents of this presentation.

2 q13 investor presentation

  • 1.
  • 2.
    2 . Strategy, businesssegments and products . Funding and capital base . Financial highlights . Ownership structure
  • 3.
    3 89% 87% 85% 84% 87% 86% 86% 87% 11% 11% 12% 14% 13% 14% 14% 13% Dec/06 Dec/07Dec/08 Dec/09 Dec/10 Dec/11 Dec/12 Jun/13 Middle Market Corporate 11,762 8,651 6,660 5,227 3,045 13,169 6.2% (BRL million) 15,318 16,879 3 Focus on Companies 3 Expanded Credit Portfolio* Banco ABC Brasil offers commercial banking services to Corporate (annual revenues above BRL 400 mi) and Middle Market clients (annual revenues between BRL 30 and 400 mi). The Bank advises on underwriting activities and mergers and acquisitions, offers commercial loans, treasury services, and international lines of credit. Distinct strategy for each business segment: • Increase profitability per client in Corporate, through increased cross-selling of products; • Grow the number of clients in the Middle Market. Portfolio Mix: increase in Middle Market participation. * Includes Loans, Guarantees Issued and Corporate Securities portfolios
  • 4.
    4 53% 53% 52% 22% 18%18% 16% 19% 19%9% 10% 11% Jun/12 Mar13 Jun/13 13,060 13,791 14,608 Corporate (annual revenues above BRL 400 mi) 4 Average Ticket (BRL million) Average Tenor (days) Total Number of Clients Clients with Credit Exposure South Rio de Janeiro São Paulo Countryside São Paulo Capital Corporate Securities (BRL million) Loans and Guarantees Issued (BRL million) Strategy: Grow the profitability per client, through increasing cross-selling of products. Products: • loans denominated in BRL and foreign currencies • trade finance • underwriting and structuring advisory services for capital markets transactions • arrangement of syndicated loans in Brazil and abroad • BNDES onlending transactions • M&A transactions • treasury products Jun/12 Mar/13 Jun/13 Jun/12 Mar/13 Jun/13 734 701 726 535 541 534 23.4 24.0 25.8 329 341 362 505 761 852
  • 5.
    5 41% 38% 36% 13%14% 14% 9% 8% 8% 27% 26% 27% 10% 14% 15% Jun/12 Mar13 Jun/13 1,878 2,029 2,271 RO AC AM RR PA AP MA PI CE BA MG ES RJ SP PR SC RS MS MT GO DF RN PB PE AL SE TO ABC Brasil Offices Middle Market (annual revenues between BRL 30 and 400 mi) 5 Strategy: Grow the number of clients, mainly in new regions. Average Ticket (BRL million) Average Tenor (days) Total Number of Clients Clients with Credit Exposure Minas Gerais / Midwest South Rio de Janeiro São Paulo Countryside São Paulo Capital Loans and Guarantees Issued (BRL million) Jun/12 Mar/13 Jun/13 1,154 1,357 1,337 949 1,007 1,024 2.0 2.0 2.2 212 241 265 7 BUSINESS PLATFORMS IN EVOLUTION (+RMs) (> Efficiency) MG RJ SC GO MT Campinas Ribeirão Preto 5 MATURE BUSINESS PLATFORMS (> Efficiency) SP1 SP2 SP3 PR RS
  • 6.
    6 . Strategy, businesssegments and products . Funding and capital base . Financial highlights . Ownership structure
  • 7.
    7 Funding & Ratings 7 (BRLmillion) Diversified funding with access to local and international sources Local brAA+ Aa1.Br AA Global BBB- Baa3 BBB- INVESTMENTGRADE Jun/12 Sep/12 Dec/12 Mar/13 Jun/13 2,140 2,226 2,186 2,611 3,390 5,353 5,575 5,542 5,395 5,772 2,279 2,165 1,854 1,856 1,886 2,227 2,347 2,618 2,676 2,781 12,000 12,313 12,199 12,538 13,830 Total 13% 13% 14% 14% 13% 5% 6% 7% 7% 7% Subordinated Debt Shareholders' Equity 19% 18% 15% 15% 14% BNDES 12% 10% 8% 8% 10% 6% 8% 10% 13% 15% Notes,Deposits& Others TradeFinance 9% 9% 9% 10% 9% 9% 9% 8% 8% 7% 11% 10% 10% 5% 4% 10% 9% 9% 9% 9% 6% 8% 10% 11% 12% Local Bonds (LFs) Individual Investors Financial Institutions Institutional Investors Corporate Investors 41%45% 45% 46% 43% Internacional Local
  • 8.
    8 Assets & Liabilitiesby maturity 8 (As of June, 2013) 4,983 3,617 2,707 3,599 758 705 2,494 4,121 3,406 3,069 303 1,179 2,490 (504) (699) 530 455 (474) 1-30 days 31-180 days 181-360 days 1-3 years 4-5 years >5 years Assets Liabilites Gap 2,490 1,985 1,286 1,817 2,271 1,798 AccumulatedGap (BRL million)
  • 9.
    9 Basel Index &Shareholders’ Equity 9 10.2% 10.9% 10.6% 10.8% 10.9% 4.0% 4.1% 5.3% 5.0% 5.4% Jun/12 Sep/12 Dec/12 Mar/13 Jun/13 TierII TierI (Core Capital) 14.2% 15.0% 15.9% 15.8% 16.3% Basel2 2,181 2,257 2,507 2,574 2,691 1,566 1,639 1,680 1,757 1,794 Reference Equity Shareholders' Equity (BRL million) Capital Adequacy (BRL million) Jun/13 Mar/13 Chg 3M (%) / p.p. Jun/12 Chg 12M (%) / p.p. Capital 2,690.8 2,573.7 4.6% 2,180.8 23.4% Mininum Capital Required 1,819.9 1,791.9 1.6% 1,687.7 7.8% Capital Surplus 870.9 781.8 11.4% 493.0 76.6% Basel Ratio 16.3% 15.8% 0.5 14.2% 2.1 Tier I (Core Capital) 10.9% 10.8% 0.1 10.2% 0.7 Tier II 5.4% 5.0% 0.4 4.0% 1.4
  • 10.
    10 . Strategy, businesssegments and products . Funding and capital base . Financial highlights . Ownership structure
  • 11.
    11 11 Credit Portfolio Quality PastDue above 90 days (% of loan portfolio) Loan Loss Reserve (% of loan portfolio) 0.65% 0.60% 0.71% 0.39% 0.57% 0.40% 0.51% 0.50% 0.87% 1.02% 1.03% 0.95% 1.06% 0.76% 0.31% 0.21% 0.21% 0.11% 0.17% 0.15% 0.19% 0.21% 0.57% 0.52% 0.56% 0.36% 0.25% 0.22% 0.23% 0.12% 0.09% 0.05% 0.06% 0.08% 0.09% 0.11% 0.47% 0.39% 0.42% 0.17% 0.01% 0.05% Mar/10 Jun/10 Sep/10 Dec/10 Mar/11 Jun/11 Sep/11 Dec/11 Mar/12 Jun/12 Sep/12 Dec/12 Mar/13 Jun/13 Middle Total Corporate 3.33% 3.64% 3.63% 3.60% 3.59% 3.45% 3.02% 3.00% 3.68% 4.06% 3.99% 4.02% 4.27% 3.83% 1.86% 1.74% 1.64% 1.62% 1.72% 1.69% 1.69% 1.73% 1.95% 2.04% 2.24% 2.15% 1.85% 1.98% 1.52% 1.29% 1.17% 1.13% 1.22% 1.18% 1.30% 1.33% 1.41% 1.48% 1.74% 1.54% 1.14% 1.40% Mar/10 Jun/10 Sep/10 Dec/10 Mar/11 Jun/11 Sep/11 Dec/11 Mar/12 Jun/12 Sep/12 Dec/12 Mar/13 Jun/13 Middle Total Corporate
  • 12.
    12 12 Credit Portfolio Quality Transactionsbetween D-H rating (Resolution 2682 of Brazilian Central Bank) Write Off in the quarter (% of loan portfolio) 0.37% 0.50% 0.46% 0.27% 0.47% 0.32% 0.77% 0.57% 0.22% 0.21% 0.55% 0.64% 0.55% 0.60% 0.29% 0.10% 0.15% 0.08% 0.10% 0.06% 0.24% 0.15% 0.06% 0.08% 0.20% 0.40% 0.46% 0.15% 0.27% 0.00% 0.07% 0.03% 0.00% -0.01% 0.08% 0.02% 0.01% 0.04% 0.10% 0.32% 0.44% 0.00% Mar/10 Jun/10 Sep/10 Dec/10 Mar/11 Jun/11 Sep/11 Dec/11 Mar/12 Jun/12 Sep/12 Dec/12 Mar/13 Jun/13 Middle Total Corporate 3.1% 3.0% 2.4% 2.1% 2.0% 1.9% 2.0% 2.4% 2.7% 2.5% 2.6% 3.3% 3.1% 3.2% Mar/10 Jun/10 Sep/10 Dec/10 Mar/11 Jun/11 Sep/11 Dec/11 Mar/12 Jun/12 Sep/12 Dec/12 Mar/13 Jun/13 D-H
  • 13.
    13 Financial Margin 13 NIM (%p.a.) (BRL million) 2Q13 1Q13 Chg (%) 2Q12 Chg (%) 6M13 6M12 Chg (%) Net Interest Income before Loan Loss Provision (LLP) 145.3 147.1 -1.3% 144.4 0.6% 292.4 285.3 2.5% Shareholders' Equity Remunerated at CDI Rate 31.4 26.2 19.8% 32.0 -2.1% 57.6 68.8 -16.4% Financial Margin with Clients 97.0 97.4 -0.4% 89.6 8.2% 194.4 174.5 11.4% Financial Margin with Market 16.9 23.6 -28.4% 22.7 -25.7% 40.5 42.0 -3.6% Loan Loss Provision (LLP) (31.3) (16.9) 85.5% (28.7) 9.4% (48.2) (52.4) -7.9% Managerial Financial Margin 113.9 130.3 -12.5% 115.7 -1.6% 244.2 232.9 4.8% 5.0% 4.8% 4.7% 4.6% 4.3% 5.1% 4.5% 2Q12 3Q12 4Q12 1Q13 2Q13 6M12 6M13
  • 14.
    14 Income from Services 14 BankingService Fees (BRL million) 2Q13 1Q13 Chg (%) 2Q12 Chg (%) 6M13 6M12 Chg (%) Guarantees Issued 30.2 27.2 11.1% 26.0 16.0% 57.4 50.2 14.3% Capital Markets and M&A Fees 6.4 1.0 534.6% 2.0 223.7% 7.5 3.9 92.0% Banking Tariffs 7.9 4.8 65.2% 4.1 92.0% 12.6 7.4 71.0% Total 44.5 33.0 35.0% 32.1 38.6% 77.4 61.4 26.0% 14.9 16.5 17.4 19.6 20.8 22.6 23.5 23.8 24.2 26.0 27.4 26.6 27.2 30.2 7.1 8.1 4.9 6.9 6.8 5.4 4.2 3.8 3.3 4.1 4.6 6.3 4.8 7.9 2.4 1.6 0.5 8.2 2.0 2.8 2.4 7.2 1.9 2.0 3.1 7.9 1.0 6.4 1Q10 2Q10 3Q10 4Q10 1Q11 2Q11 3Q11 4Q11 1Q12 2Q12 3Q12 4Q12 1Q13 2Q13 CapitalMarkets and M&A Fees Banking Tariffs GuaranteesIssued (BRLmillion) Income from Services Totalof Revenues 20.5% 20.1% 17.6% 23.8% 19.7% 20.3% 18.3% 20.6% 18.3% 19.0% 20.7% 23.2% 19.7% 23.2%
  • 15.
    15 Expenses 15 Efficiency Ratio (Cost/Income) Expenses(BRL million) 2Q13 1Q13 Chg (%) 2Q12 Chg (%) 6M13 6M12 Chg (%) Personnel (34.7) (32.7) 6.0% (32.2) 7.5% (67.4) (63.3) 6.4% Other Administrative Expenses (18.5) (17.6) 5.1% (19.6) -5.9% (36.0) (35.3) 2.0% Profit Sharing (20.6) (18.6) 11.0% (13.1) 57.4% (39.2) (23.1) 69.6% Total (73.8) (68.9) 7.1% (65.0) 13.5% (142.6) (121.8) 17.1% 36.9% 35.3% 38.4% 39.2% 36.4% 35.5% 37.7% 2Q12 3Q12 4Q12 1Q13 2Q13 6M12 6M13
  • 16.
    16 Profitability 16 Net Income (BRLMillion) ROAE (% p.a.) 55.0 55.1 59.6 60.1 64.7 111.9 124.8 2Q12 3Q12 4Q12 1Q13 2Q13 6M12 6M13 14.2% 13.8% 14.4% 14.1% 14.6% 14.6% 14.3% 2Q12 3Q12 4Q12 1Q13 2Q13 6M12 6M13
  • 17.
    17 . Strategy, businesssegments and products . Funding and capital base . Financial highlights . Ownership structure
  • 18.
    18 Ownership Structure 18 ABC Brasil LocalManagement 10.5% Voting CapitalTotal Capital Free-float 34.4% Local Management and Directors 58.5% ABC 89.5% ABC 7.1% 59.4% Central Bank of Libya 29.7% Kuwait Investment Authority Free-float 10.9% Arab Banking Corporation (Parent Company) International bank headquartered in Bahrain (As of June, 2013)
  • 19.
    19 Controlling Shareholder International bankheadquartered in Bahrain Listed on the Bahrain stock exchange Main Shareholders Central Bank of Libya 59.4% Kuwait Investment Authority 29.7% Free-float 10.9% 19 Total Assets: US$ 25.3 Bn Shareholders’ Equity: US$ 3.8 Bn BIS Ratio: 22.7% Core capital (Tier I): 18.7% (As of June, 2013)
  • 20.
  • 21.
    21 Appendix - ExpandedCredit Portfolio 21 (BRL million) Jun/13 Mar/13 Chg 3M (%) Jun/12 Chg 12M (%)Loans 8,937.4 8,607.7 3.8% 8,519.8 4.9% Corporate 6,785.0 6,638.3 2.2% 6,680.2 1.6% Middle 2,152.4 1,969.4 9.3% 1,839.6 17.0% Guarantees Issued 7,055.5 6,421.6 9.9% 5,882.3 19.9% Corporate 6,971.1 6,362.3 9.6% 5,843.8 19.3% Middle 84.4 59.3 42.3% 38.6 119.0% Corporate Securities 886.1 790.2 12.1% 536.0 65.3% Corporate 852.3 760.8 12.0% 505.3 68.7% Middle 33.8 29.4 15.1% 30.7 10.2% Expanded Credit Portfolio 16,879.0 15,819.6 6.7% 14,938.1 13.0% Corporate Total 14,608.4 13,790.8 5.9% 13,059.9 11.9% Middle Total 2,270.6 2,028.8 11.9% 1,878.2 20.9%
  • 22.
    22 22 Appendix - CorporateStructure (As of June, 2013) CEO Anis ChacurNeto Auditing Commitee InternalAuditing Financial Institutions Human Resources Legal Treasury& IR VP Sergio Lulia Jacob Commercial Middle VP Gustavo Arantes Lanhoso Commercial Corporate VP Jose Eduardo Cintra Laloni Risk VP Renato Pasqualin Sobrinho Financial & Administrative VP Sergio Ricardo Borejo Treasury Products IR & Marketing Commercial MiddleCommercial Corporate Capital Markets Investment Banking Credit Corporate Credit Middle Risk Compliance Financial Control Back Office Information Technology Board of Directors Group Audit / Bahrain Strategic Planning
  • 23.
    23 23 Appendix - Boardof Directors Members Anwar Ali Al Mudhaf (Kuwaiti) ABC Brasil Chairman & Arab Banking Corporation Board Member Tito Enrique da Silva Neto (Brazilian) Vice Chairman & Former CEO of Banco ABC Brasil Roy Hannay Gardner (Scottish) Arab Banking Corporation Executive Vernom Handley (British) Arab Banking Corporation Executive Paul Henry Jennings* (British) Arab Banking Corporation Executive Ricardo Alves Lima (Brazilian) Independent Member Edgar Uchôa (Brazilian) Independent Member (As of June, 2013) * Waiting ratification by the Central Bank of Brazil.
  • 24.
    24 Appendix - BrazilianBanking Sector 24 ABC Brasil focuses on the Corporate and Middle Market segments Large CorporateCorporateRetail Number of Clients >2,000 400-2,000 30-400 Individuals and small companies Big retail banks Middle-sized international banks Big retail banks Middle-sized international banks Big retail banks Middle-sized family owned banks Big retail banks Middle-sized international banks Middle-sized family owned banks (BRL Million) Annual Revenues Main Competitors Middle Market
  • 25.
    25 IPO 1989 1997 200520132007 Appendix – History in Brazil Arab Banking Corporation and local management acquire Roberto Marinho Group’s shares The bank’s name changes to Banco ABC Brasil S.A. The bank structures its Middle Market operations Arab Banking Corporation and Roberto Marinho Group jointly initiate Banco ABC Roma S.A., acting in the segments of corporate lending, trade finance and treasury 25
  • 26.
    26 Disclaimer The following material,on this date, is a presentation containing general information about the Banco ABC Brasil S.A. We offer no guarantee and make no declaration, implicitly or explicitly, as to the accuracy, completeness or scope of this information. This presentation may include forward-looking statements of future events or results according to the regulations of the Brazilian and International securities and exchange commissions. These statements are based on certain assumptions and analyses by the Company that reflect its experience, the economic environment, future market conditions and expected events by the company, many of which are beyond the control of the Company. Important factors that may lead to significant differences between the actual results and the statements of expectations about future events or results include the company’s business strategy, Brazilian and International economic conditions, technology, financial strategy, financial market conditions, uncertainty regarding the results of its future operations, plans, objectives, expectations and intentions, among others. Considering these factors, the actual results of the company may be significantly different from those shown or implicit in the statement of expectations about future events or results. The information and opinions contained in this presentation should not be understood as a recommendation to potential investors and no investment decision is to be based on the veracity, current events or completeness of this information or these opinions. No advisors to the company or parties related to them or their representatives should have any responsibility for any losses that may result from the use or contents of this presentation.