This document summarizes the key financial results of Itaú Unibanco Holding S.A. for the second quarter of 2011:
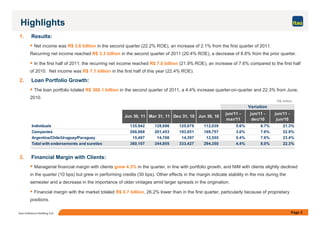
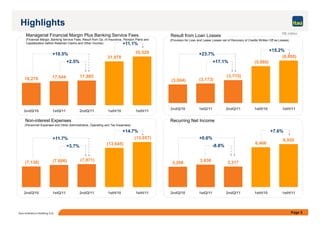
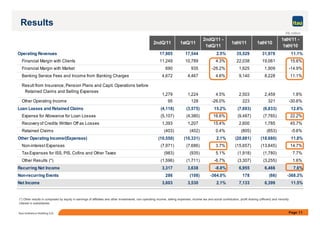
- Net income was R$3.6 billion, up 2.1% from the previous quarter. Recurring net income was R$3.3 billion, down 8.8% from the prior quarter.
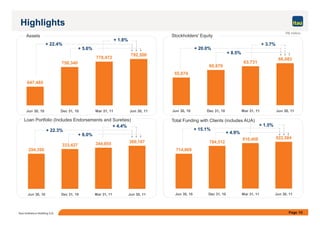
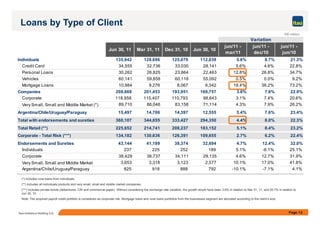
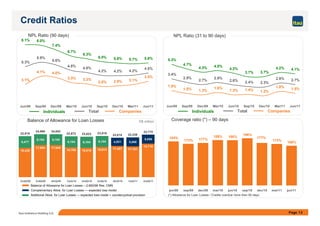
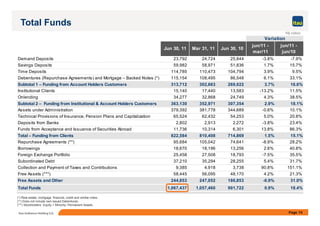
- The loan portfolio totaled R$360.1 billion, up 4.4% from the previous quarter and 22.3% from a year ago.
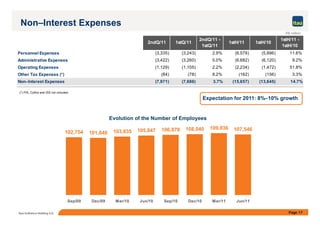
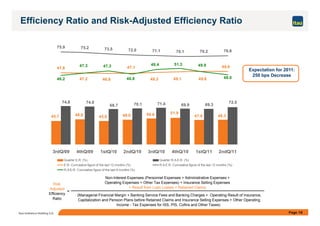
- Non-interest expenses increased 3.7% compared to the previous quarter to R$8.0 billion, confirming a trend of deceleration.