- The document is Pine's 2Q17 earnings release and highlights the company's financial results for the quarter.
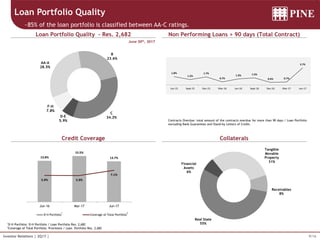
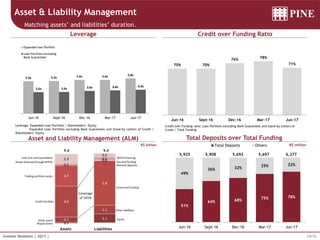
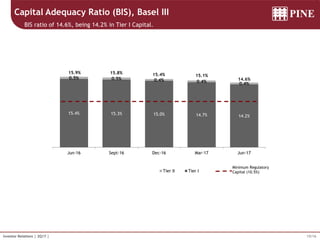
- Key highlights include a cash position of R$1.4 billion, a BIS capital ratio of 14.6%, and loan portfolio coverage over 7%. Pine's digital investment platform Pine Online was also launched.
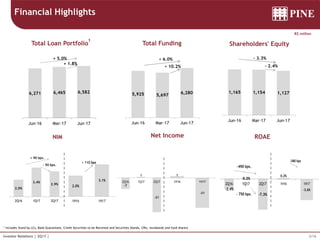
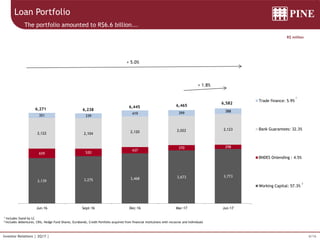
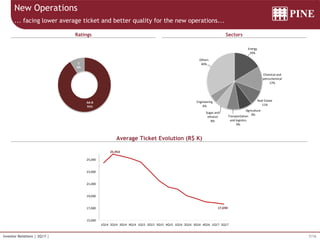
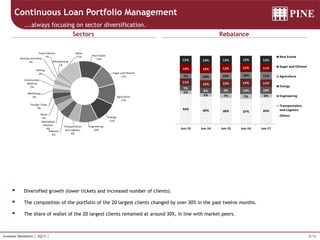
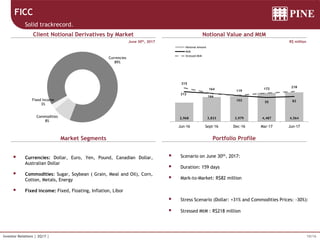
- The loan portfolio increased 5% from the previous quarter to R$6.6 billion, with average ticket sizes decreasing. Most loans were rated AA-C.
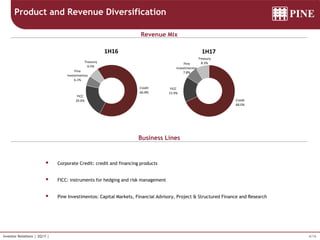
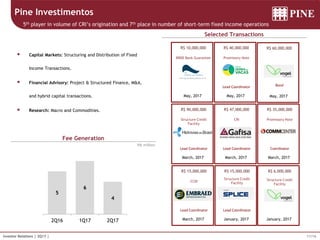
- Pine Investimentos ranked 5th in CRI origination volume and completed several capital markets transactions during the quarter.
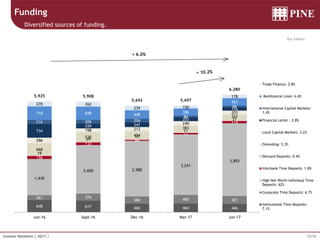
- Funding increased 6% from the previous quarter to R$6.3 billion from diversified