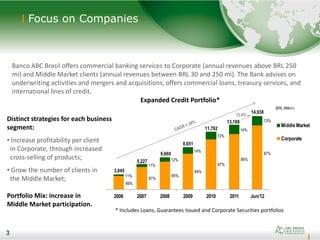
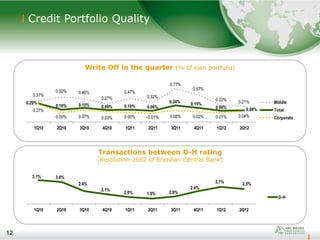
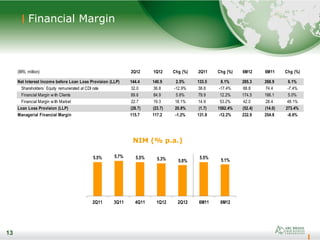
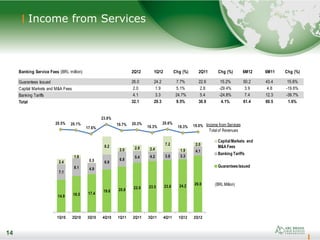
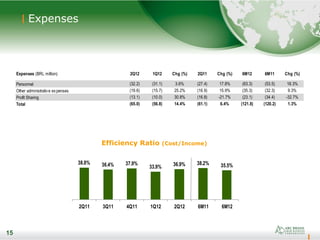
1
Investor Presentation 2Q12
2
. Strategy, business segments and products
. Funding and capital base
. Financial highlights
. Ownership structure
. Key attributes
3
89%
87%
85%
84%
87%
86%
87%
11%
11%
12%
14%
13%
14%
13%
2006 2007 2008 2009 2010 2011 Jun/12
Middle Market
Corporate
11,762
8,651
6,660
5,227
3,045
13,169
13.4%
(BRL Million)
14,938
3
Focus on Companies
3
Expanded Credit Portfolio*
Banco ABC Brasil offers commercial banking services to Corporate (annual revenues above BRL 250
mi) and Middle Market clients (annual revenues between BRL 30 and 250 mi). The Bank advises on
underwriting activities and mergers and acquisitions, offers commercial loans, treasury services, and
international lines of credit.
Distinct strategies for each business
segment:
• Increase profitability per client
in Corporate, through increased
cross-selling of products;
• Grow the number of clients in
the Middle Market;
Portfolio Mix: increase in
Middle Market participation.
* Includes Loans, Guarantees Issued and Corporate Securities portfolios
4
54% 54% 53%
20% 20% 22%17%
16%
16%9%
10%
9%
Jun/11 Mar/12 Jun/12
10,522 11,462 12,524
Corporate
(annual revenues above BRL 250 mi)
4
Average Ticket
(BRL Million)
Average Tenor
(days)
Total Number
of Clients
Clients with
Credit Exposure
Jun/11 Mar/12 Jun/12
South
Rio de Janeiro
São Paulo Countryside
São Paulo Capital
Corporate Securities
(BRL Million)
Jun/11 Mar/12 Jun/12
Loans and
Guarantees Issued
(BRL Million)
Strategy:
Grow the profitability per client, through
increasing cross-selling of products.
Products:
• loans denominated in BRL and foreign
currencies
• trade finance
• underwriting and structuring advisory
services for capital markets transactions
• arrangement of syndicated loans in Brazil
and abroad
• BNDES onlending transactions
• M&A transactions
• treasury products
728 708 734
524 533 535
20.1 21.5 23.4
367 343 329
234 358 536
5
RO
AC
AM
RR
PA
AP
MA
PI
CE
BA
MG
ES
RJ
SP
PR
SC
RS
MS
MT
GO
DF
RN
PB
PE
AL
SE
TO
ABC Brasil
Offices
Middle Market
(annual revenues between BRL 30 and 250 mi)
5
Strategy:
Grow the number of clients,
mainly in new regions.
Jun/11 Mar/12 Jun/12
Average Ticket
(BRL Million)
Average Tenor
(days)
Total Number
of Clients
Clients with
Credit Exposure
Minas Gerais / Goiás
South
Rio de Janeiro
São Paulo Countryside
São Paulo Capital
Loans and
Guarantees Issued
(BRL Million)
43% 40% 41%
12% 13% 13%
10% 10% 9%
28%
28% 27%
7%
9% 10%
Jun/11 Mar/12 Jun/12
1,713 1,895 1,878
1,040 1,156 1,154
840 965 949
2.0 2.0 2.0
234 207 212
3
NEW
BUSINESS
PLATFORMS
CENTRO-OESTE
RIBEIRÃO PRETO
SP 4
6
BUSINESS
PLATFORMS
IN EVOLUTION
(+ RMs)
(> Efficiency)
MINASGERAIS
RIO DE JANEIRO
CAMPINAS
PARANÁ
SANTACATARINA
RIO GRANDE DO
SUL
3
MATURE
BUSINESS
PLATFORMS
(> Efficiency)
SP 1
SP 2
SP 3
6
. Strategy, business segments and products
. Funding and capital base
. Financial highlights
. Ownership structure
. Key attributes
7
Funding & Ratings
7
(BRL Million)
Investment
Grade
Investment
Grade
Local Global
brAA+ BBB-
Aa1.br Baa3
AA- BB+
Diversified funding with access to
local and international sources 2Q11 3Q11 4Q11 1Q12 2Q12
1,940.2 2,156.3 1,647.3 1,781.9 2,140.0
3,531.5 3,798.3 4,045.5 4,976.9 5,353.4
2,240.9 2,317.3 2,181.5 2,060.1 2,279.1
1,878.9 2,065.7 2,085.3 2,137.2 2,227.0
9,591.5 10,337.6 9,959.6 10,956.1 11,999.6 Total
15% 14% 15% 14% 13%
5% 6% 6% 6% 5% Subordinated Debt
Shareholders´ Equity
23% 22% 22% 19% 19%
BNDES
20% 21% 16% 16% 18% International
10% 12% 10% 9% 9%
10%
10% 11% 10% 9%
7%
7% 10% 13% 11%10%
8% 10%
10% 10%
3% 6% Local Bonds (Letras
Financeiras)
Individual Investors
Financial Institutions
Institutional
Investors
Corporate Investors
37% 37% 41% 45% 45%
8
Assets & Liabilities by maturity
8
(As of June, 2012)
3,846
3,611
1,905
2,596
681
261
1,515
3,856
2,988
1,874
330
771
2,331
(245) (1,084)
722
351
(510)
1-30 days 31-180 days 181-360 days 1-3 years 4-5 years >5 years
Assets Liabilites Gap
2,331
2,085
1,002
1,724
2,075
1,565
AccumulatedGap
(BRL Million)
9
Basel Index & Shareholders´ Equity
9
11.6% 11.4% 11.3% 11.1% 10.2%
3.8% 4.4% 4.3% 4.1% 4.0%
2Q11 3Q11 4Q11 1Q12 2Q12
TierII
TierI (CoreCapital)
Shareholders´Equity
(BRLMillion)
15.4% 15.8% 15.6% 15.2%
14.2%
1,424.2
1,460.2
1,499.6
1,535.6
1,565.8
Capital Adequacy (BRL million) Jun/12 Mar/12
Chg 3M
(%) / p.p.
Jun/11
Chg 12M
(%) / p.p.
Capital 2,180.8 2,092.0 4.2% 1,886.4 15.6%
Mininum Capital Required 1,687.7 1,518.3 11.2% 1,346.9 25.3%
Capital Surplus 493.0 573.7 -14.1% 539.5 -8.6%
Basel Index 14.2% 15.2% -1.0 15.4% -1.2
Tier I (Core Capital) 10.2% 11.1% -0.9 11.6% -1.4
Tier II 4.0% 4.1% -0.1 3.8% 0.2
10
. Strategy, business segments and products
. Funding and capital base
. Financial highlights
. Ownership structure
. Key attributes
11
11
Credit Portfolio Quality
Past Due above 90 days (% of loan portfolio)
Loan Loss Reserve (% of loan portfolio)
0.65% 0.60%
0.71%
0.39%
0.57%
0.40%
0.51% 0.50%
0.87%
1.02%
0.31% 0.21% 0.21% 0.11% 0.17% 0.15% 0.19% 0.21%
0.57% 0.52%
0.23% 0.12% 0.09% 0.05% 0.06% 0.08% 0.09% 0.11%
0.47% 0.39%
1Q10 2Q10 3Q10 4Q10 1Q11 2Q11 3Q11 4Q11 1Q12 2Q12
Middle
Total
Corporate
3.33% 3.64% 3.63% 3.60% 3.59% 3.45%
3.02% 3.00%
3.68%
4.06%
1.86% 1.74% 1.64% 1.62% 1.72% 1.69% 1.69% 1.73% 1.95% 2.04%
1.52% 1.29% 1.17% 1.13% 1.22% 1.18% 1.30% 1.33% 1.41% 1.48%
1Q10 2Q10 3Q10 4Q10 1Q11 2Q11 3Q11 4Q11 1Q12 2Q12
Middle
Total
Corporate
12
12
Credit Portfolio Quality
Transactions between D-H rating
(Resolution 2682 of Brazilian Central Bank)
Write Off in the quarter (% of loan portfolio)
0.37%
0.50% 0.46%
0.27%
0.47%
0.32%
0.77%
0.57%
0.22% 0.21%0.29%
0.10% 0.15% 0.08% 0.10% 0.06%
0.24% 0.15%
0.06% 0.08%0.27%
0.00% 0.07% 0.03% 0.00% -0.01% 0.08% 0.02% 0.01% 0.04%
1Q10 2Q10 3Q10 4Q10 1Q11 2Q11 3Q11 4Q11 1Q12 2Q12
Middle
Total
Corporate
3.1% 3.0%
2.4%
2.1%
2.0% 1.9% 2.0%
2.4%
2.7% 2.5%
1Q10 2Q10 3Q10 4Q10 1Q11 2Q11 3Q11 4Q11 1Q12 2Q12
D-H
13
Financial Margin
13
NIM (% p.a.)
(BRL million) 2Q12 1Q12 Chg (%) 2Q11 Chg (%) 6M12 6M11 Chg (%)
Net Interest Income before Loan Loss Provision (LLP) 144.4 140.9 2.5% 133.5 8.1% 285.3 268.9 6.1%
Shareholders´ Equity remunerated at CDI rate 32.0 36.8 -12.9% 38.8 -17.4% 68.8 74.4 -7.4%
Financial Margin with Clients 89.6 84.9 5.6% 79.9 12.2% 174.5 166.1 5.0%
Financial Margin with Market 22.7 19.3 18.1% 14.9 53.2% 42.0 28.4 48.1%
Loan Loss Provision (LLP) (28.7) (23.7) 20.8% (1.7) 1582.4% (52.4) (14.0) 273.4%
Managerial Financial Margin 115.7 117.2 -1.2% 131.8 -12.2% 232.9 254.8 -8.6%
5.5% 5.7% 5.5% 5.3% 5.0%
5.5%
5.1%
2Q11 3Q11 4Q11 1Q12 2Q12 6M11 6M12
14
Income from Services
14
Banking Service Fees (BRL million) 2Q12 1Q12 Chg (%) 2Q11 Chg (%) 6M12 6M11 Chg (%)
Guarantees Issued 26.0 24.2 7.7% 22.6 15.2% 50.2 43.4 15.6%
Capital Markets and M&A Fees 2.0 1.9 5.1% 2.8 -29.4% 3.9 4.8 -19.6%
Banking Tariffs 4.1 3.3 24.7% 5.4 -24.8% 7.4 12.3 -39.7%
Total 32.1 29.3 9.5% 30.9 4.1% 61.4 60.5 1.6%
14.9 16.5 17.4
19.6 20.8 22.6 23.5 23.8 24.2 26.0
7.1
8.1 4.9
6.9
6.8
5.4 4.2 3.8 3.3
4.1
2.4
1.6
0.5
8.2
2.0 2.8 2.4
7.2
1.9
2.0
1Q10 2Q10 3Q10 4Q10 1Q11 2Q11 3Q11 4Q11 1Q12 2Q12
CapitalMarkets and
M&A Fees
Banking Tariffs
GuaranteesIssued
(BRLMillion)
Income from Services
Totalof Revenues
20.5% 20.1%
17.6%
23.8%
19.7% 20.3%
18.3%
20.6%
18.3% 19.0%
15
Expenses
15
Efficiency Ratio (Cost/Income)
Expenses (BRL million) 2Q12 1Q12 Chg (%) 2Q11 Chg (%) 6M12 6M11 Chg (%)
Personnel (32.2) (31.1) 3.6% (27.4) 17.8% (63.3) (53.5) 18.3%
Other administrative expenses (19.6) (15.7) 25.2% (16.9) 15.9% (35.3) (32.3) 9.3%
Profit Sharing (13.1) (10.0) 30.8% (16.8) -21.7% (23.1) (34.4) -32.7%
Total (65.0) (56.8) 14.4% (61.1) 6.4% (121.8) (120.2) 1.3%
38.8% 36.4% 37.9%
33.9% 36.9% 38.2% 35.5%
2Q11 3Q11 4Q11 1Q12 2Q12 6M11 6M12
16
Profitability
16
Net Income (BRL Million) ROAE (% p.a.)
60.2 58.5 60.6 56.9 55.0
116.9 111.9
2Q11 3Q11 4Q11 1Q12 2Q12 6M11 6M12
17.2% 16.2% 16.4%
15.0% 14.2%
16.9%
14.6%
2Q11 3Q11 4Q11 1Q12 2Q12 6M11 6M12
17
. Strategy, business segments and products
. Funding and capital base
. Financial highlights
. Ownership structure
. Key attributes
18
Ownership Structure
18
ABC Brasil
Local Management
11.8%
Voting CapitalTotal Capital
Free-float
34.0%
Local Management
and Directors
58.0%
ABC
88.2%
ABC
8.0%
59.4%
Central
Bank of Libya
29.7%
Kuwait
Investment
Authority
Free-float
10.9%
Arab Banking Corporation
(Parent Company)
International bank
headquartered in Bahrain
19
Controlling Shareholder
International bank headquartered in Bahrain
Listed on the Bahrain stock exchange
Main Shareholders
Central Bank of Libya 59.4%
Kuwait Investment Authority 29.7%
Free-float 10.9%
19
Total Assets: US$ 24.4 Bn
Shareholders’ Equity: US$ 3.7 Bn
BIS Ratio: 23.0%
Core capital (Tier I): 18.6%
(As of June, 2012)
20
. Strategy, business segments and products
. Funding and capital base
. Financial highlights
. Ownership structure
. Key attributes
21
Key Attributes
21
Expertise in Corporate
Credit Risk Assessment
Agile Decision Making &
Experienced Management
Sophisticated
and
Diversified
Products
Investment
Grade
Ratings
Strong Business Origination
Capacity
Strong Sponsor &
Independent Management
22
Sergio Lulia Jacob
Financial Vice-President
Alexandre Sinzato, CFA
Head of Investor Relations
Web Site: www.abcbrasil.com.br/ir
Email: ri@abcbrasil.com.br
Phone: +55 (11) 3170-2186
22
Investor Relations
23
Expanded Credit Portfolio
23
(BRL million) Jun/12 Mar/12 Chg 3M (%) Jun/11 Chg 12M (%)
Loans 8,519.8 7,783.5 9.5% 7,468.7 14.1%
Corporate 6,680.2 5,923.8 12.8% 5,788.7 15.4%
Middle 1,839.6 1,859.7 -1.1% 1,680.0 9.5%
Guarantees issued 5,882.3 5,573.7 5.5% 4,766.1 23.4%
Corporate 5,843.8 5,538.5 5.5% 4,733.4 23.5%
Middle 38.6 35.2 9.7% 32.6 18.1%
Loans + Guarantees Issued 14,402.1 13,357.2 7.8% 12,234.8 17.7%
Corporate 12,524.0 11,462.3 9.3% 10,522.2 19.0%
Middle 1,878.2 1,894.9 -0.9% 1,712.6 9.7%
Corporate Securities 536.0 357.6 49.9% 233.7 129.3%
Expanded Credit Portfoliio 14,938.1 13,714.8 8.9% 12,468.5 19.8%
24
24
Appendix - Corporate Structure
Mesa Cliente Credit Middle
Market
Credit Corporate
CEO
Anis Chacur Neto
Auditing Commitee
Financial Control
Group Audit /
Bahrain
Internal Auditing
Commercial Corporate VP
Jose Eduardo C. Laloni
Compliance
Commercial
Corporate
Financial & Admin. VP
Sergio R. Borejo
Capital Markets Products
Financial
Institutions
Treasury & IR VP
Sergio Lulia Jacob
Investor Relations
Treasury
Commercial Middle VP
Gustavo A. Lanhoso
Commercial Middle
Back Office
Information
Technology
HR & Marketing
Dealing Desk
Board
Investment Banking
Business
Intelligence
Risk VP
Renato Pasqualin
Sobrinho
Risk
Legal
25
25
Members
-Anwar Ali Al Mudhaf ABC Brasil Chairman & Arab Banking
Corporation Board Member, Kuwaiti
-Roy Hannay Gardner Arab Banking Corporation executive, Scottish
-Asaf Mohyuddin Arab Banking Corporation executive, Pakistani
-Tito Enrique da Silva Neto Former CEO of ABC Brasil, Brazilian
-Ricardo Alves Lima Brazilian
-Edgar Uchôa Brazilian
Appendix - Board of Directors
26
Appendix - Brazilian Banking Sector
ABC Brasil focuses on the Corporate and Middle Market segments
Large
Corporate
CorporateMiddleMarketRetail
Number of Clients
2,000+
250-
2,000
30-250
Individuals and
small companies
Big retail banks
Middle-sized international banks
Big retail banks
Middle-sized international banks
Big retail banks
Middle-sized family owned banks
Big retail banks
Middle-sized international banks
Middle-sized family owned banks
26
(BRL Million)
Annual Revenues Main Competitors
27
IPO
1989 1997 2005 20122007
Appendix – History in Brazil
Arab Banking
Corporation and local
management acquire
Roberto Marinho
Group’s shares
The bank’s name
changes to
Banco ABC Brasil S.A.
The bank
structures its
Middle Market
operations
Arab Banking Corporation and
Roberto Marinho Group jointly
initiate Banco ABC Roma S.A.,
acting in the segments of
corporate lending, trade
finance and treasury
27
28
Disclaimer
The following material, on this date, is a presentation containing general information about the
Banco ABC Brasil S.A. We offer no guarantee and make no declaration, implicitly or explicitly,
as to the accuracy, completeness or scope of this information.
This presentation may include forward-looking statements of future events or results according
to the regulations of the Brazilian and International securities and exchange commissions.
These statements are based on certain assumptions and analyses by the Company that reflect
its experience, the economic environment, future market conditions and expected events by
the company, many of which are beyond the control of the Company. Important factors that
may lead to significant differences between the actual results and the statements of
expectations about future events or results include the company’s business strategy, Brazilian
and International economic conditions, technology, financial strategy, financial market
conditions, uncertainty regarding the results of its future operations, plans, objectives,
expectations and intentions, among others. Considering these factors, the actual results of the
company may be significantly different from those shown or implicit in the statement of
expectations about future events or results.
The information and opinions contained in this presentation should not be understood as a
recommendation to potential investors and no investment decision is to be based on the
veracity, current events or completeness of this information or these opinions. No advisors to
the company or parties related to them or their representatives should have any responsibility
for any losses that may result from the use or contents of this presentation.

2 q12 investor presentation

  • 1.
  • 2.
    2 . Strategy, businesssegments and products . Funding and capital base . Financial highlights . Ownership structure . Key attributes
  • 3.
    3 89% 87% 85% 84% 87% 86% 87% 11% 11% 12% 14% 13% 14% 13% 2006 2007 20082009 2010 2011 Jun/12 Middle Market Corporate 11,762 8,651 6,660 5,227 3,045 13,169 13.4% (BRL Million) 14,938 3 Focus on Companies 3 Expanded Credit Portfolio* Banco ABC Brasil offers commercial banking services to Corporate (annual revenues above BRL 250 mi) and Middle Market clients (annual revenues between BRL 30 and 250 mi). The Bank advises on underwriting activities and mergers and acquisitions, offers commercial loans, treasury services, and international lines of credit. Distinct strategies for each business segment: • Increase profitability per client in Corporate, through increased cross-selling of products; • Grow the number of clients in the Middle Market; Portfolio Mix: increase in Middle Market participation. * Includes Loans, Guarantees Issued and Corporate Securities portfolios
  • 4.
    4 54% 54% 53% 20%20% 22%17% 16% 16%9% 10% 9% Jun/11 Mar/12 Jun/12 10,522 11,462 12,524 Corporate (annual revenues above BRL 250 mi) 4 Average Ticket (BRL Million) Average Tenor (days) Total Number of Clients Clients with Credit Exposure Jun/11 Mar/12 Jun/12 South Rio de Janeiro São Paulo Countryside São Paulo Capital Corporate Securities (BRL Million) Jun/11 Mar/12 Jun/12 Loans and Guarantees Issued (BRL Million) Strategy: Grow the profitability per client, through increasing cross-selling of products. Products: • loans denominated in BRL and foreign currencies • trade finance • underwriting and structuring advisory services for capital markets transactions • arrangement of syndicated loans in Brazil and abroad • BNDES onlending transactions • M&A transactions • treasury products 728 708 734 524 533 535 20.1 21.5 23.4 367 343 329 234 358 536
  • 5.
    5 RO AC AM RR PA AP MA PI CE BA MG ES RJ SP PR SC RS MS MT GO DF RN PB PE AL SE TO ABC Brasil Offices Middle Market (annualrevenues between BRL 30 and 250 mi) 5 Strategy: Grow the number of clients, mainly in new regions. Jun/11 Mar/12 Jun/12 Average Ticket (BRL Million) Average Tenor (days) Total Number of Clients Clients with Credit Exposure Minas Gerais / Goiás South Rio de Janeiro São Paulo Countryside São Paulo Capital Loans and Guarantees Issued (BRL Million) 43% 40% 41% 12% 13% 13% 10% 10% 9% 28% 28% 27% 7% 9% 10% Jun/11 Mar/12 Jun/12 1,713 1,895 1,878 1,040 1,156 1,154 840 965 949 2.0 2.0 2.0 234 207 212 3 NEW BUSINESS PLATFORMS CENTRO-OESTE RIBEIRÃO PRETO SP 4 6 BUSINESS PLATFORMS IN EVOLUTION (+ RMs) (> Efficiency) MINASGERAIS RIO DE JANEIRO CAMPINAS PARANÁ SANTACATARINA RIO GRANDE DO SUL 3 MATURE BUSINESS PLATFORMS (> Efficiency) SP 1 SP 2 SP 3
  • 6.
    6 . Strategy, businesssegments and products . Funding and capital base . Financial highlights . Ownership structure . Key attributes
  • 7.
    7 Funding & Ratings 7 (BRLMillion) Investment Grade Investment Grade Local Global brAA+ BBB- Aa1.br Baa3 AA- BB+ Diversified funding with access to local and international sources 2Q11 3Q11 4Q11 1Q12 2Q12 1,940.2 2,156.3 1,647.3 1,781.9 2,140.0 3,531.5 3,798.3 4,045.5 4,976.9 5,353.4 2,240.9 2,317.3 2,181.5 2,060.1 2,279.1 1,878.9 2,065.7 2,085.3 2,137.2 2,227.0 9,591.5 10,337.6 9,959.6 10,956.1 11,999.6 Total 15% 14% 15% 14% 13% 5% 6% 6% 6% 5% Subordinated Debt Shareholders´ Equity 23% 22% 22% 19% 19% BNDES 20% 21% 16% 16% 18% International 10% 12% 10% 9% 9% 10% 10% 11% 10% 9% 7% 7% 10% 13% 11%10% 8% 10% 10% 10% 3% 6% Local Bonds (Letras Financeiras) Individual Investors Financial Institutions Institutional Investors Corporate Investors 37% 37% 41% 45% 45%
  • 8.
    8 Assets & Liabilitiesby maturity 8 (As of June, 2012) 3,846 3,611 1,905 2,596 681 261 1,515 3,856 2,988 1,874 330 771 2,331 (245) (1,084) 722 351 (510) 1-30 days 31-180 days 181-360 days 1-3 years 4-5 years >5 years Assets Liabilites Gap 2,331 2,085 1,002 1,724 2,075 1,565 AccumulatedGap (BRL Million)
  • 9.
    9 Basel Index &Shareholders´ Equity 9 11.6% 11.4% 11.3% 11.1% 10.2% 3.8% 4.4% 4.3% 4.1% 4.0% 2Q11 3Q11 4Q11 1Q12 2Q12 TierII TierI (CoreCapital) Shareholders´Equity (BRLMillion) 15.4% 15.8% 15.6% 15.2% 14.2% 1,424.2 1,460.2 1,499.6 1,535.6 1,565.8 Capital Adequacy (BRL million) Jun/12 Mar/12 Chg 3M (%) / p.p. Jun/11 Chg 12M (%) / p.p. Capital 2,180.8 2,092.0 4.2% 1,886.4 15.6% Mininum Capital Required 1,687.7 1,518.3 11.2% 1,346.9 25.3% Capital Surplus 493.0 573.7 -14.1% 539.5 -8.6% Basel Index 14.2% 15.2% -1.0 15.4% -1.2 Tier I (Core Capital) 10.2% 11.1% -0.9 11.6% -1.4 Tier II 4.0% 4.1% -0.1 3.8% 0.2
  • 10.
    10 . Strategy, businesssegments and products . Funding and capital base . Financial highlights . Ownership structure . Key attributes
  • 11.
    11 11 Credit Portfolio Quality PastDue above 90 days (% of loan portfolio) Loan Loss Reserve (% of loan portfolio) 0.65% 0.60% 0.71% 0.39% 0.57% 0.40% 0.51% 0.50% 0.87% 1.02% 0.31% 0.21% 0.21% 0.11% 0.17% 0.15% 0.19% 0.21% 0.57% 0.52% 0.23% 0.12% 0.09% 0.05% 0.06% 0.08% 0.09% 0.11% 0.47% 0.39% 1Q10 2Q10 3Q10 4Q10 1Q11 2Q11 3Q11 4Q11 1Q12 2Q12 Middle Total Corporate 3.33% 3.64% 3.63% 3.60% 3.59% 3.45% 3.02% 3.00% 3.68% 4.06% 1.86% 1.74% 1.64% 1.62% 1.72% 1.69% 1.69% 1.73% 1.95% 2.04% 1.52% 1.29% 1.17% 1.13% 1.22% 1.18% 1.30% 1.33% 1.41% 1.48% 1Q10 2Q10 3Q10 4Q10 1Q11 2Q11 3Q11 4Q11 1Q12 2Q12 Middle Total Corporate
  • 12.
    12 12 Credit Portfolio Quality Transactionsbetween D-H rating (Resolution 2682 of Brazilian Central Bank) Write Off in the quarter (% of loan portfolio) 0.37% 0.50% 0.46% 0.27% 0.47% 0.32% 0.77% 0.57% 0.22% 0.21%0.29% 0.10% 0.15% 0.08% 0.10% 0.06% 0.24% 0.15% 0.06% 0.08%0.27% 0.00% 0.07% 0.03% 0.00% -0.01% 0.08% 0.02% 0.01% 0.04% 1Q10 2Q10 3Q10 4Q10 1Q11 2Q11 3Q11 4Q11 1Q12 2Q12 Middle Total Corporate 3.1% 3.0% 2.4% 2.1% 2.0% 1.9% 2.0% 2.4% 2.7% 2.5% 1Q10 2Q10 3Q10 4Q10 1Q11 2Q11 3Q11 4Q11 1Q12 2Q12 D-H
  • 13.
    13 Financial Margin 13 NIM (%p.a.) (BRL million) 2Q12 1Q12 Chg (%) 2Q11 Chg (%) 6M12 6M11 Chg (%) Net Interest Income before Loan Loss Provision (LLP) 144.4 140.9 2.5% 133.5 8.1% 285.3 268.9 6.1% Shareholders´ Equity remunerated at CDI rate 32.0 36.8 -12.9% 38.8 -17.4% 68.8 74.4 -7.4% Financial Margin with Clients 89.6 84.9 5.6% 79.9 12.2% 174.5 166.1 5.0% Financial Margin with Market 22.7 19.3 18.1% 14.9 53.2% 42.0 28.4 48.1% Loan Loss Provision (LLP) (28.7) (23.7) 20.8% (1.7) 1582.4% (52.4) (14.0) 273.4% Managerial Financial Margin 115.7 117.2 -1.2% 131.8 -12.2% 232.9 254.8 -8.6% 5.5% 5.7% 5.5% 5.3% 5.0% 5.5% 5.1% 2Q11 3Q11 4Q11 1Q12 2Q12 6M11 6M12
  • 14.
    14 Income from Services 14 BankingService Fees (BRL million) 2Q12 1Q12 Chg (%) 2Q11 Chg (%) 6M12 6M11 Chg (%) Guarantees Issued 26.0 24.2 7.7% 22.6 15.2% 50.2 43.4 15.6% Capital Markets and M&A Fees 2.0 1.9 5.1% 2.8 -29.4% 3.9 4.8 -19.6% Banking Tariffs 4.1 3.3 24.7% 5.4 -24.8% 7.4 12.3 -39.7% Total 32.1 29.3 9.5% 30.9 4.1% 61.4 60.5 1.6% 14.9 16.5 17.4 19.6 20.8 22.6 23.5 23.8 24.2 26.0 7.1 8.1 4.9 6.9 6.8 5.4 4.2 3.8 3.3 4.1 2.4 1.6 0.5 8.2 2.0 2.8 2.4 7.2 1.9 2.0 1Q10 2Q10 3Q10 4Q10 1Q11 2Q11 3Q11 4Q11 1Q12 2Q12 CapitalMarkets and M&A Fees Banking Tariffs GuaranteesIssued (BRLMillion) Income from Services Totalof Revenues 20.5% 20.1% 17.6% 23.8% 19.7% 20.3% 18.3% 20.6% 18.3% 19.0%
  • 15.
    15 Expenses 15 Efficiency Ratio (Cost/Income) Expenses(BRL million) 2Q12 1Q12 Chg (%) 2Q11 Chg (%) 6M12 6M11 Chg (%) Personnel (32.2) (31.1) 3.6% (27.4) 17.8% (63.3) (53.5) 18.3% Other administrative expenses (19.6) (15.7) 25.2% (16.9) 15.9% (35.3) (32.3) 9.3% Profit Sharing (13.1) (10.0) 30.8% (16.8) -21.7% (23.1) (34.4) -32.7% Total (65.0) (56.8) 14.4% (61.1) 6.4% (121.8) (120.2) 1.3% 38.8% 36.4% 37.9% 33.9% 36.9% 38.2% 35.5% 2Q11 3Q11 4Q11 1Q12 2Q12 6M11 6M12
  • 16.
    16 Profitability 16 Net Income (BRLMillion) ROAE (% p.a.) 60.2 58.5 60.6 56.9 55.0 116.9 111.9 2Q11 3Q11 4Q11 1Q12 2Q12 6M11 6M12 17.2% 16.2% 16.4% 15.0% 14.2% 16.9% 14.6% 2Q11 3Q11 4Q11 1Q12 2Q12 6M11 6M12
  • 17.
    17 . Strategy, businesssegments and products . Funding and capital base . Financial highlights . Ownership structure . Key attributes
  • 18.
    18 Ownership Structure 18 ABC Brasil LocalManagement 11.8% Voting CapitalTotal Capital Free-float 34.0% Local Management and Directors 58.0% ABC 88.2% ABC 8.0% 59.4% Central Bank of Libya 29.7% Kuwait Investment Authority Free-float 10.9% Arab Banking Corporation (Parent Company) International bank headquartered in Bahrain
  • 19.
    19 Controlling Shareholder International bankheadquartered in Bahrain Listed on the Bahrain stock exchange Main Shareholders Central Bank of Libya 59.4% Kuwait Investment Authority 29.7% Free-float 10.9% 19 Total Assets: US$ 24.4 Bn Shareholders’ Equity: US$ 3.7 Bn BIS Ratio: 23.0% Core capital (Tier I): 18.6% (As of June, 2012)
  • 20.
    20 . Strategy, businesssegments and products . Funding and capital base . Financial highlights . Ownership structure . Key attributes
  • 21.
    21 Key Attributes 21 Expertise inCorporate Credit Risk Assessment Agile Decision Making & Experienced Management Sophisticated and Diversified Products Investment Grade Ratings Strong Business Origination Capacity Strong Sponsor & Independent Management
  • 22.
    22 Sergio Lulia Jacob FinancialVice-President Alexandre Sinzato, CFA Head of Investor Relations Web Site: www.abcbrasil.com.br/ir Email: ri@abcbrasil.com.br Phone: +55 (11) 3170-2186 22 Investor Relations
  • 23.
    23 Expanded Credit Portfolio 23 (BRLmillion) Jun/12 Mar/12 Chg 3M (%) Jun/11 Chg 12M (%) Loans 8,519.8 7,783.5 9.5% 7,468.7 14.1% Corporate 6,680.2 5,923.8 12.8% 5,788.7 15.4% Middle 1,839.6 1,859.7 -1.1% 1,680.0 9.5% Guarantees issued 5,882.3 5,573.7 5.5% 4,766.1 23.4% Corporate 5,843.8 5,538.5 5.5% 4,733.4 23.5% Middle 38.6 35.2 9.7% 32.6 18.1% Loans + Guarantees Issued 14,402.1 13,357.2 7.8% 12,234.8 17.7% Corporate 12,524.0 11,462.3 9.3% 10,522.2 19.0% Middle 1,878.2 1,894.9 -0.9% 1,712.6 9.7% Corporate Securities 536.0 357.6 49.9% 233.7 129.3% Expanded Credit Portfoliio 14,938.1 13,714.8 8.9% 12,468.5 19.8%
  • 24.
    24 24 Appendix - CorporateStructure Mesa Cliente Credit Middle Market Credit Corporate CEO Anis Chacur Neto Auditing Commitee Financial Control Group Audit / Bahrain Internal Auditing Commercial Corporate VP Jose Eduardo C. Laloni Compliance Commercial Corporate Financial & Admin. VP Sergio R. Borejo Capital Markets Products Financial Institutions Treasury & IR VP Sergio Lulia Jacob Investor Relations Treasury Commercial Middle VP Gustavo A. Lanhoso Commercial Middle Back Office Information Technology HR & Marketing Dealing Desk Board Investment Banking Business Intelligence Risk VP Renato Pasqualin Sobrinho Risk Legal
  • 25.
    25 25 Members -Anwar Ali AlMudhaf ABC Brasil Chairman & Arab Banking Corporation Board Member, Kuwaiti -Roy Hannay Gardner Arab Banking Corporation executive, Scottish -Asaf Mohyuddin Arab Banking Corporation executive, Pakistani -Tito Enrique da Silva Neto Former CEO of ABC Brasil, Brazilian -Ricardo Alves Lima Brazilian -Edgar Uchôa Brazilian Appendix - Board of Directors
  • 26.
    26 Appendix - BrazilianBanking Sector ABC Brasil focuses on the Corporate and Middle Market segments Large Corporate CorporateMiddleMarketRetail Number of Clients 2,000+ 250- 2,000 30-250 Individuals and small companies Big retail banks Middle-sized international banks Big retail banks Middle-sized international banks Big retail banks Middle-sized family owned banks Big retail banks Middle-sized international banks Middle-sized family owned banks 26 (BRL Million) Annual Revenues Main Competitors
  • 27.
    27 IPO 1989 1997 200520122007 Appendix – History in Brazil Arab Banking Corporation and local management acquire Roberto Marinho Group’s shares The bank’s name changes to Banco ABC Brasil S.A. The bank structures its Middle Market operations Arab Banking Corporation and Roberto Marinho Group jointly initiate Banco ABC Roma S.A., acting in the segments of corporate lending, trade finance and treasury 27
  • 28.
    28 Disclaimer The following material,on this date, is a presentation containing general information about the Banco ABC Brasil S.A. We offer no guarantee and make no declaration, implicitly or explicitly, as to the accuracy, completeness or scope of this information. This presentation may include forward-looking statements of future events or results according to the regulations of the Brazilian and International securities and exchange commissions. These statements are based on certain assumptions and analyses by the Company that reflect its experience, the economic environment, future market conditions and expected events by the company, many of which are beyond the control of the Company. Important factors that may lead to significant differences between the actual results and the statements of expectations about future events or results include the company’s business strategy, Brazilian and International economic conditions, technology, financial strategy, financial market conditions, uncertainty regarding the results of its future operations, plans, objectives, expectations and intentions, among others. Considering these factors, the actual results of the company may be significantly different from those shown or implicit in the statement of expectations about future events or results. The information and opinions contained in this presentation should not be understood as a recommendation to potential investors and no investment decision is to be based on the veracity, current events or completeness of this information or these opinions. No advisors to the company or parties related to them or their representatives should have any responsibility for any losses that may result from the use or contents of this presentation.