Downloaded 100 times
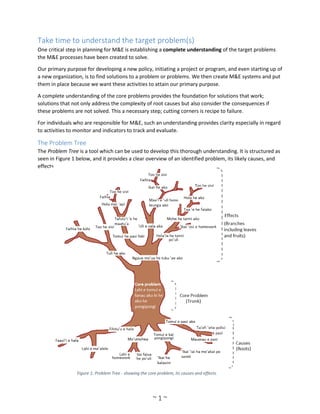
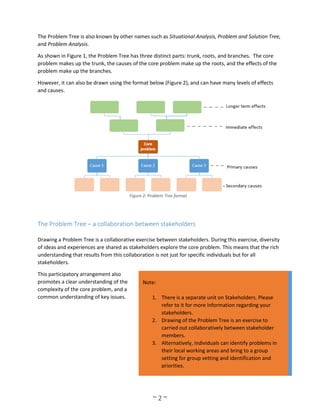
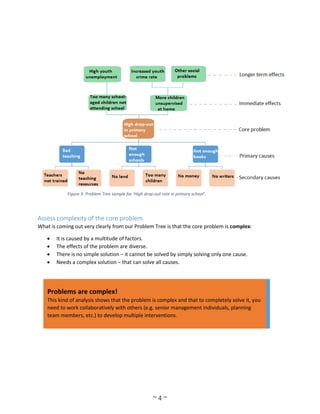
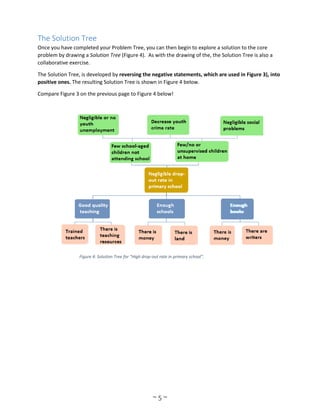
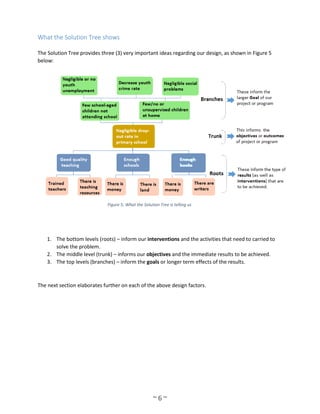


This document outlines strategies for participatory monitoring and evaluation (M&E) in Tonga's education system. It discusses using problem and solution trees to thoroughly analyze issues. The problem tree identifies core problems, causes, and effects, revealing complexity requiring multiple solutions. Drawing the problem tree collaboratively helps stakeholders understand issues. The solution tree then informs goals, objectives, and interventions to address root causes. Together, these tools provide a framework for designing effective M&E processes and selecting appropriate activities, indicators, and targets to solve problems in Tonga's education system.


![Qcl 14-v3 [cause-effect_diagram]_[banathali_university]_[suyashi_rastogi]](https://cdn.slidesharecdn.com/ss_thumbnails/qcl-14-v3causeeffectdiagrambanathaliuniversitysuyashirastogi-141231044432-conversion-gate02-thumbnail.jpg?width=640&height=640&fit=bounds)


