The document discusses graphs of rational functions. It provides examples of graphs along vertical and horizontal asymptotes, as well as graphs around roots. The document also contains exercises asking the reader to identify roots, poles, and orders from sign charts and sketch graphs of various rational functions.
This learner's module will discuss or talk about the Graph of Quadratic Functions. It will also discuss on how to draw the Graph of Quadratic Functions using the vertex, axis of symmetry, etc.
Synthetic Fiber Construction in lab .pptxPavel ( NSTU)
Synthetic fiber production is a fascinating and complex field that blends chemistry, engineering, and environmental science. By understanding these aspects, students can gain a comprehensive view of synthetic fiber production, its impact on society and the environment, and the potential for future innovations. Synthetic fibers play a crucial role in modern society, impacting various aspects of daily life, industry, and the environment. ynthetic fibers are integral to modern life, offering a range of benefits from cost-effectiveness and versatility to innovative applications and performance characteristics. While they pose environmental challenges, ongoing research and development aim to create more sustainable and eco-friendly alternatives. Understanding the importance of synthetic fibers helps in appreciating their role in the economy, industry, and daily life, while also emphasizing the need for sustainable practices and innovation.
The French Revolution, which began in 1789, was a period of radical social and political upheaval in France. It marked the decline of absolute monarchies, the rise of secular and democratic republics, and the eventual rise of Napoleon Bonaparte. This revolutionary period is crucial in understanding the transition from feudalism to modernity in Europe.
For more information, visit-www.vavaclasses.com
Instructions for Submissions thorugh G- Classroom.pptxJheel Barad
This presentation provides a briefing on how to upload submissions and documents in Google Classroom. It was prepared as part of an orientation for new Sainik School in-service teacher trainees. As a training officer, my goal is to ensure that you are comfortable and proficient with this essential tool for managing assignments and fostering student engagement.
Macroeconomics- Movie Location
This will be used as part of your Personal Professional Portfolio once graded.
Objective:
Prepare a presentation or a paper using research, basic comparative analysis, data organization and application of economic information. You will make an informed assessment of an economic climate outside of the United States to accomplish an entertainment industry objective.
Model Attribute Check Company Auto PropertyCeline George
In Odoo, the multi-company feature allows you to manage multiple companies within a single Odoo database instance. Each company can have its own configurations while still sharing common resources such as products, customers, and suppliers.
Welcome to TechSoup New Member Orientation and Q&A (May 2024).pdfTechSoup
In this webinar you will learn how your organization can access TechSoup's wide variety of product discount and donation programs. From hardware to software, we'll give you a tour of the tools available to help your nonprofit with productivity, collaboration, financial management, donor tracking, security, and more.
Francesca Gottschalk - How can education support child empowerment.pptxEduSkills OECD
Francesca Gottschalk from the OECD’s Centre for Educational Research and Innovation presents at the Ask an Expert Webinar: How can education support child empowerment?
Embracing GenAI - A Strategic ImperativePeter Windle
Artificial Intelligence (AI) technologies such as Generative AI, Image Generators and Large Language Models have had a dramatic impact on teaching, learning and assessment over the past 18 months. The most immediate threat AI posed was to Academic Integrity with Higher Education Institutes (HEIs) focusing their efforts on combating the use of GenAI in assessment. Guidelines were developed for staff and students, policies put in place too. Innovative educators have forged paths in the use of Generative AI for teaching, learning and assessments leading to pockets of transformation springing up across HEIs, often with little or no top-down guidance, support or direction.
This Gasta posits a strategic approach to integrating AI into HEIs to prepare staff, students and the curriculum for an evolving world and workplace. We will highlight the advantages of working with these technologies beyond the realm of teaching, learning and assessment by considering prompt engineering skills, industry impact, curriculum changes, and the need for staff upskilling. In contrast, not engaging strategically with Generative AI poses risks, including falling behind peers, missed opportunities and failing to ensure our graduates remain employable. The rapid evolution of AI technologies necessitates a proactive and strategic approach if we are to remain relevant.
1. Graphs of Rational Functions
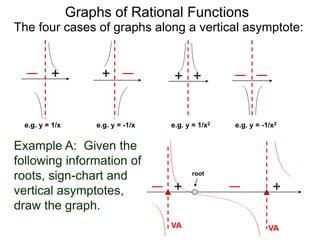
e.g. y = 1/x2e.g. y = -1/x e.g. y = -1/x2
+
e.g. y = 1/x
+ + +
The four cases of graphs along a vertical asymptote:
Example A: Given the
following information of
roots, sign-chart and
vertical asymptotes,
draw the graph.
++
root
VAVA
2. Graphs of Rational Functions
Example C:
Find the roots, VA and HA, if any, of R(x) =
Draw the sign-chart and sketch the graph.
x2 – 4x + 4
x2 – 1
For it's root, set x2 – 4x + 4 = 0, i.e. x = 2 (ord = 2).
For VA, set Q(x) = 0, i.e. x2 – 1 = 0 x = ± 1.
Both have order 1, so
the sign changes at
each of these values.
As x±∞, R(x) resembles
x2/x2 = 1, i.e. it has y = 1
as the HA. Note the
graph stays above the
HA to the far left,
and below to the far right.
++ –
x=2
++
3. Graphs of Rational Functions
Example D:
Find the roots, VA and HA, if any, of R(x) =
Draw the sign-chart and sketch the graph.
x2 – 2x – 3
x – 2
Set x2 – 2x – 3 = 0 (x – 3)(x + 1) = 0
so x = -1, 3 are the roots of order 1.
For VA, set x – 2 = 0, i.e. x = 2.
As x ±∞, the graph of R(x)
resembles the graph of the
quotient of the leading terms
x2/x = x, or y = x.
Hence there is no HA.
x=3
Do the sign-chart. Construct the
middle part of the graph.
+–+–
x= –1
4. Graphs of Rational Functions
+ +
+ +
The graphs along poles.
Even-order PolesOdd-order Poles
Even-order RootsOdd-order Roots
The graphs around a roots. (See 2.9.)
order = 3, 5, 7…
5. Exercise A. Following are the sign charts of
simplified factorable rational function
with their roots, poles, and their orders given.
a. Write down a (any) rational formula in the
simplified factored form of any given sign chart.
b. Sketch its graphs (its “mid-section”).
–1
1.
ord=1 ord=1
1– – – –1
2.
ord=2ord=1
1+ + +
–1
3.
ord=1 ord=1
1 – – – –1
4.
ord=2ord=2
1 + + +
–1
7.
1 3 –1
8.
ord=1 ord=2
1 3
ord=2
+ +– –
= root
= pole
(asymptote)
ord=2 ord=1 ord=1
–1
5.
1 3 –1
6.
ord=1 ord=2
1 3
ord=2
+ +– –
ord=2 ord=1 ord=1
Graphs of Rational Functions
6. B. For each of the following rational functions,
identify its roots, poles and their orders.
a. Make a sign charts (as in A).
b. Determine its horizontal behavior. Sketch its graph.
1. R(x) = 2. x – 3x + 2
2 R(x) = –1
5. R(x) = 6. x – 3x + 2
x – 3 R(x) =
x + 2
3. R(x) = 4. 5 – xx + 1
–2 R(x) = 1
9. (x + 3)2R(x) = x – 2
7. R(x) = 8. 3 – 2xx + 2
–3x R(x) =
x
10. (x + 3)2R(x) = x + 2
11. (x – 3)(x + 3)
R(x) =
x – 2
12. R(x) =
(x – 3)(x + 3)
x – 5
Graphs of Rational Functions
7. B. For each of the following rational functions,
identify its roots, poles and their orders.
a. Make a sign charts (as in A).
b. Determine its horizontal behavior. Sketch its graph.
13. (x – 2)2R(x) = 14.
(x – 4)(x + 5)
R(x) =
15. (x – 3)(x + 3)
R(x) = 16. R(x) =
(x – 3)(x + 3)
(x – 3)(x + 3) (x + 2)2
(x + 3)(x + 5)
(2x – 1)(x + 1)
(x – 4)(x + 5)
17. x(x – 3)(x + 3)
R(x) = 18. R(x) =
(x – 3)2(x + 3)
(2x – 1)(x + 1)
Graphs of Rational Functions
8. (Answers to odd problems) Exercise A.
1. 3.
x – 1
x + 1
(x + 1)(x – 1)
1
–
5. (x + 1)2–
(x – 1)(x – 3) 7.
(x + 1)2(x – 3)
(x – 1)
Graphs of Rational Functions