Download to read offline


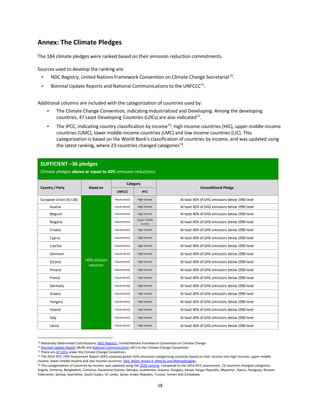
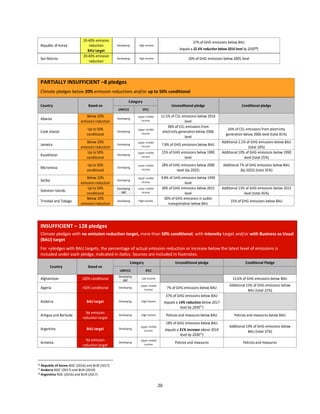
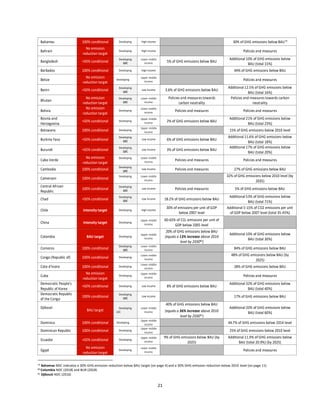

The report analyzes climate pledges made under the Paris Agreement and highlights that 75% of commitments are insufficient to meet the goal of reducing global greenhouse gas emissions by 50% by 2030. It emphasizes the need for significant and swift reductions in emissions, particularly from the largest emitters, while noting that current emissions trends are on the rise. The authors call for increased leadership and commitments from governments, private sectors, and individuals to achieve the necessary changes to limit global warming.


![Hdr 20072008 Presentation[1]](https://cdn.slidesharecdn.com/ss_thumbnails/HDR20072008presentation1-123602819722-phpapp02-thumbnail.jpg?width=640&height=640&fit=bounds)


