India currently lacks a comprehensive index that can assess sustainability. Existing indices like the UNDP's Human Development Index are inadequate. This document discusses several potential indicators and tools for assessing sustainability in India, including:
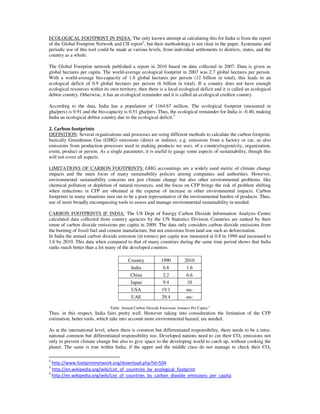
1. Ecological footprint and carbon footprint analyses, which have been conducted for India but have limitations. Ecological footprint calculations show India runs an ecological deficit.
2. Well-being indicators and national accounts of well-being, which measure subjective factors like life satisfaction, but no exact measures exist for India.
3. Environmental accounting, which attempts to quantify environmental impacts monetarily; India currently lacks green accounting but aims to implement it by 2015.
4. Sustainability reporting,


![(SESSION 2-2-1)[Matthias Bruckner].ppt](https://cdn.slidesharecdn.com/ss_thumbnails/session2-2-1matthiasbruckner-221121093559-863a95b9-thumbnail.jpg?width=640&height=640&fit=bounds)


