Μαρίνα Βαφειάδη, PhD
Μεταδιδακτορικήερευνήτρια, Τομέας Κοινωνικής Ιατρικής,
Πανεπιστήμιο Κρήτης
29ο Παγκρήτιο Παιδιατρικό Συνέδριο, Άγιος Νικόλαος, 21 Οκτωβρίου 2017
Παιδική Παχυσαρκία στην Κρήτη:
η σημασία των πρώιμων εκθέσεων
2.
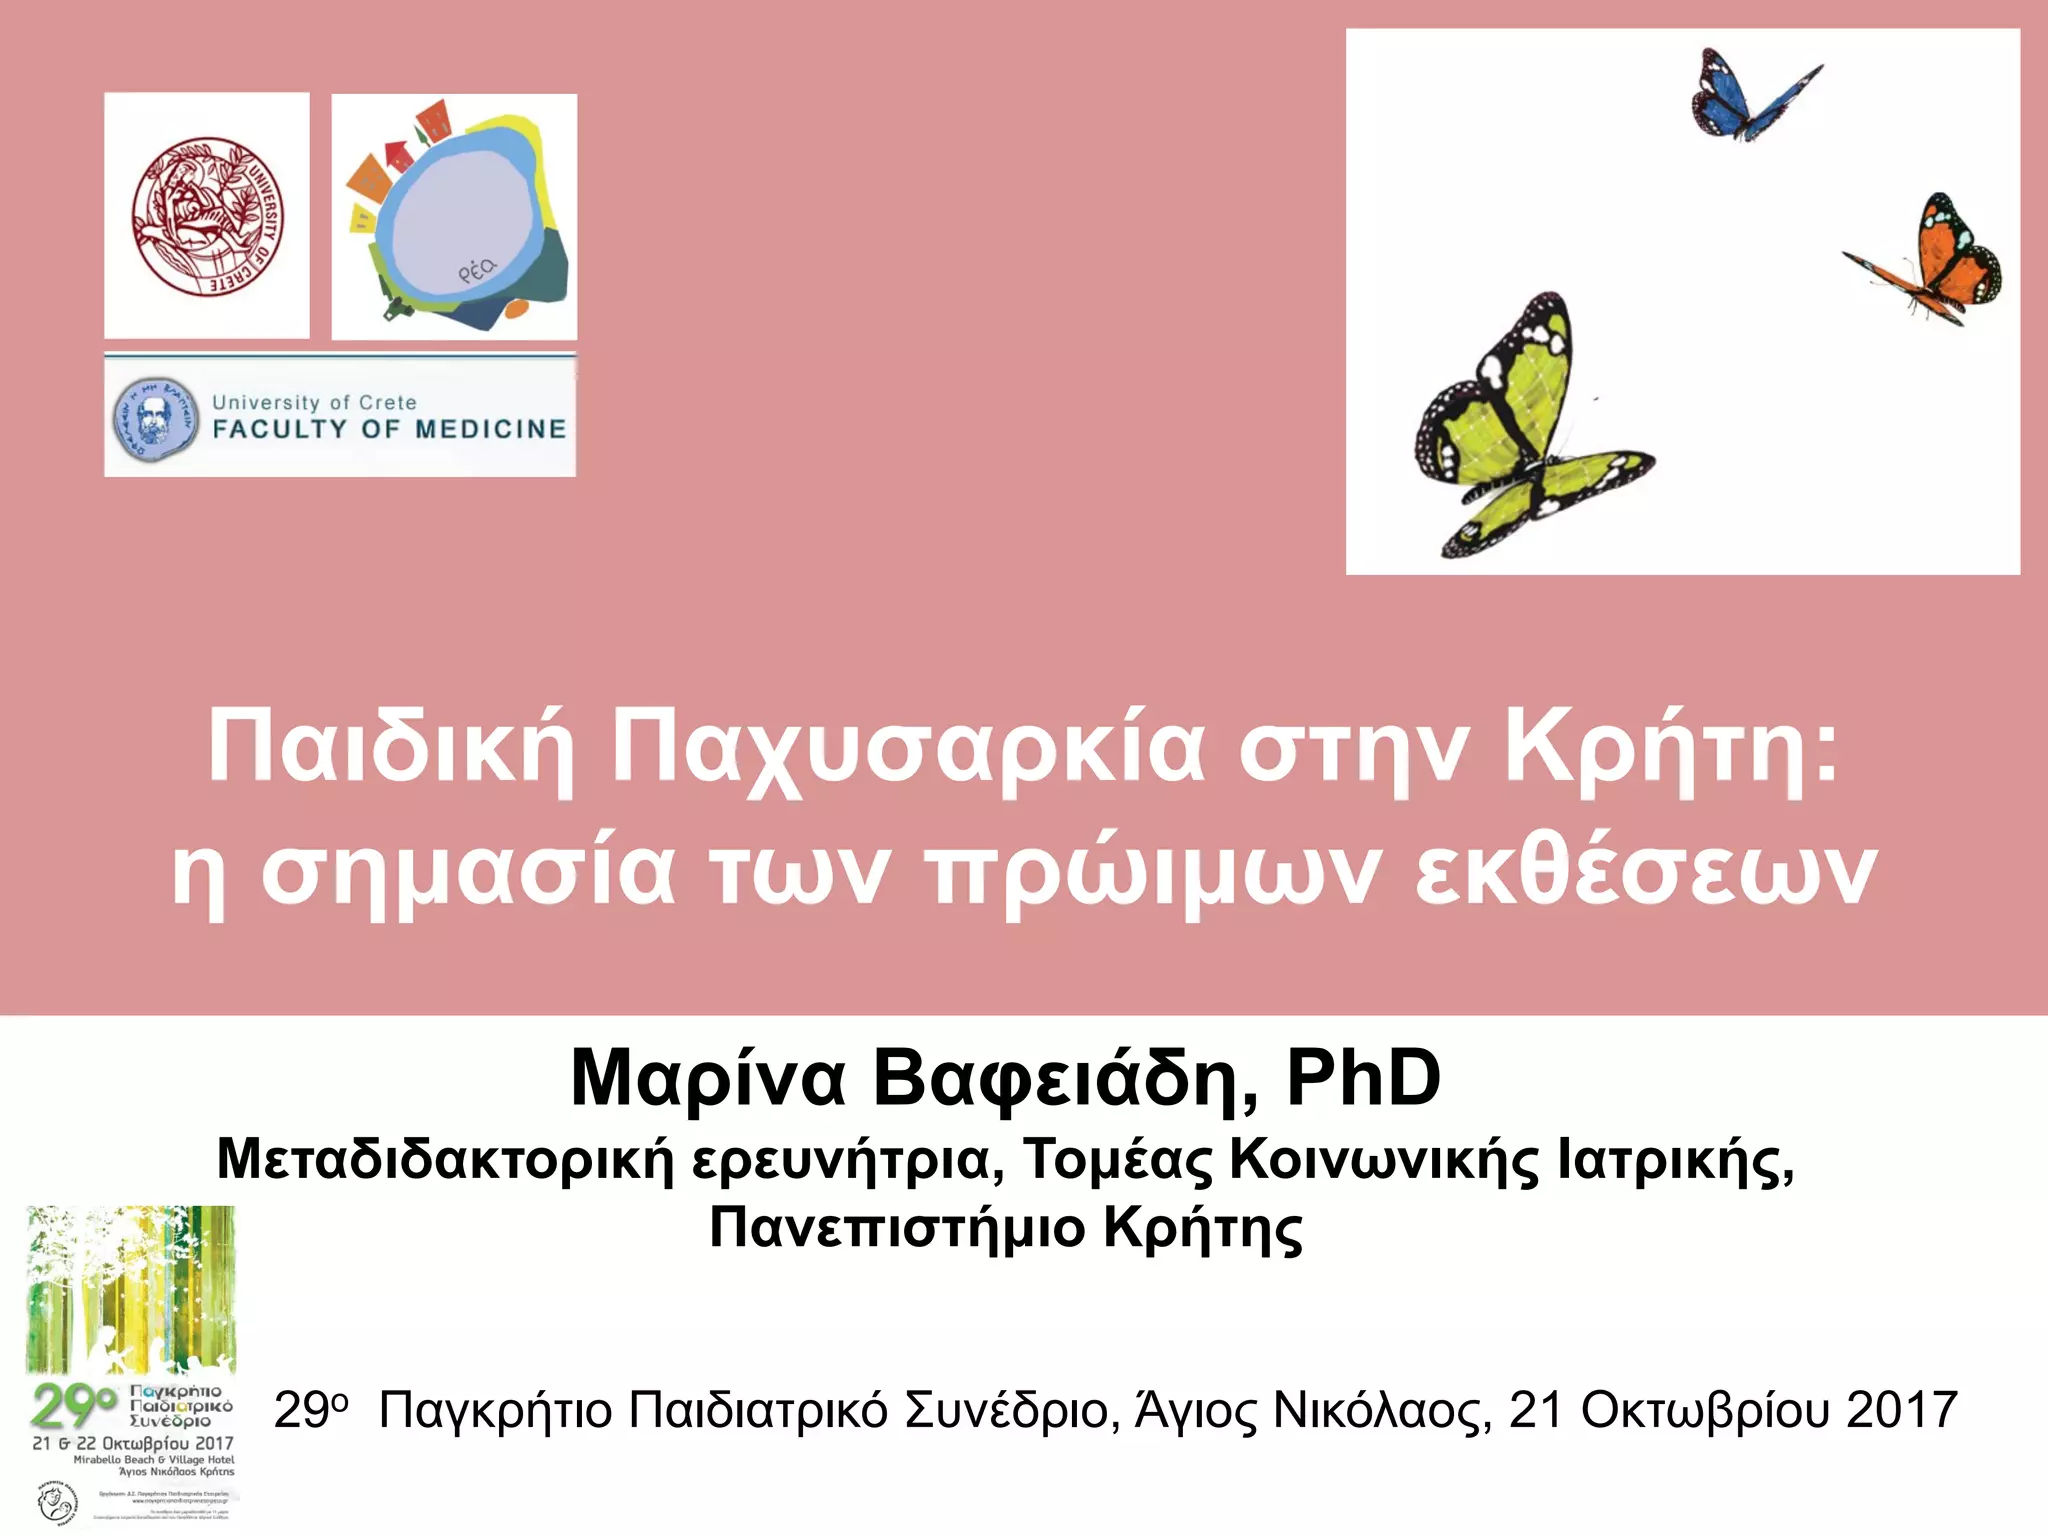
The Childhood ObesityEpidemic in Greece
Measuring overweight (including obesity) among children, 2013 (or nearest year)
3.
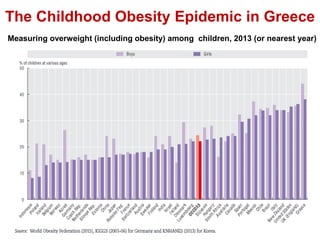
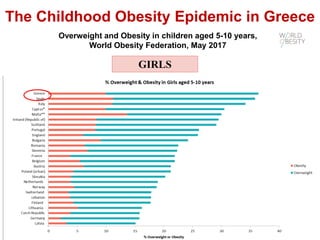
The Childhood ObesityEpidemic in Greece
Overweight and Obesity in children aged 5-10 years,
World Obesity Federation, May 2017
BOYS
4.
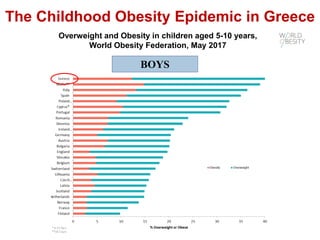
The Childhood ObesityEpidemic in Greece
Overweight and Obesity in children aged 5-10 years,
World Obesity Federation, May 2017
GIRLS
5.
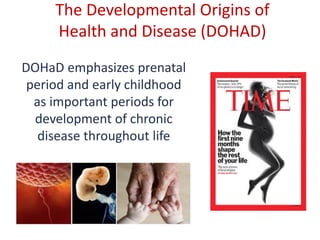
The Developmental Originsof
Health and Disease (DOHAD)
DOHaD emphasizes prenatal
period and early childhood
as important periods for
development of chronic
disease throughout life
6.
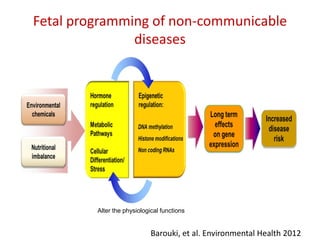
Fetal programming ofnon-communicable
diseases
Barouki, et al. Environmental Health 2012
Altered Developmental programming may lead to disease later in life...
Alter the physiological functions
7.
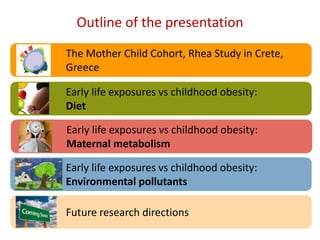
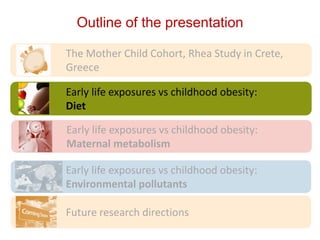
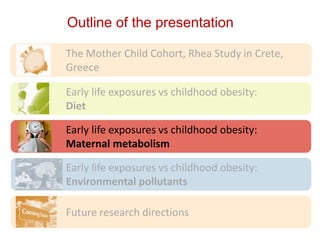
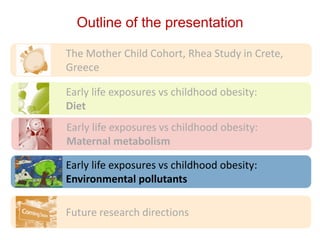
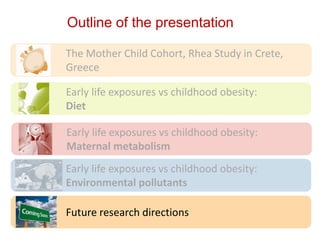
Future research directions
Earlylife exposures vs childhood obesity:
Diet
The Mother Child Cohort, Rhea Study in Crete,
Greece
Outline of the presentation
Early life exposures vs childhood obesity:
Maternal metabolism
Early life exposures vs childhood obesity:
Environmental pollutants
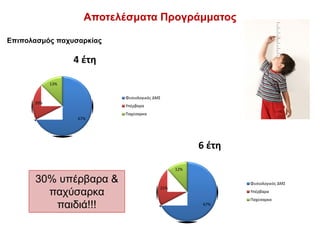
8.
Πληθυσμός Προγράμματος
Ο πληθυσμόςτου προγράμματος προέρχεται από τον ευρύτερο
πληθυσμό της μελέτης Μητέρας-Παιδιού Κρήτης που διεξάγεται τα
τελευταία χρόνια στο νομό Ηρακλείου στην Κρήτη.
9.
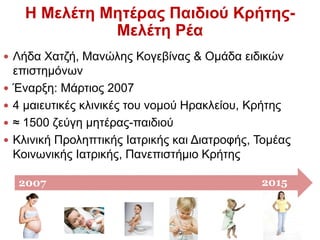
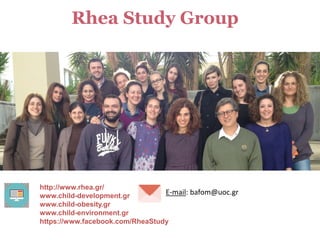
Λήδα Χατζή,Μανώλης Κογεβίνας & Ομάδα ειδικών
επιστημόνων
Έναρξη: Μάρτιος 2007
4 μαιευτικές κλινικές του νομού Ηρακλείου, Κρήτης
≈ 1500 ζεύγη μητέρας-παιδιού
Κλινική Προληπτικής Ιατρικής και Διατροφής, Τομέας
Κοινωνικής Ιατρικής, Πανεπιστήμιο Κρήτης
20152007
Η Μελέτη Μητέρας Παιδιού Κρήτης-
Μελέτη Ρέα
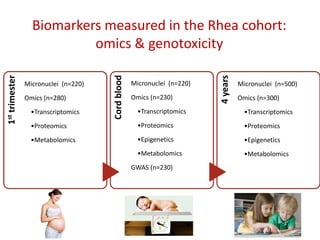
Εκτίμηση της σωματικήςανάπτυξης
Η αξιολόγηση της σωματικής ανάπτυξης των παιδιών στη ηλικία των 4 & 6 ετών,
πραγματοποιήθηκε από εξειδικευμένο επιστημονικό προσωπικό στο Πανεπιστημιακό
Νοσοκομείο Ηρακλείου και σε δημόσια Κέντρα Υγείας στην επαρχία του νομού Ηρακλείου
• Σωματική ανάπτυξη: Ύψος, βάρος & Δείκτης Μάζας Σώματος (ΔΜΣ)
• Διάγνωση παιδικής παχυσαρκίας: αξιολόγηση της παχυσαρκίας
σύμφωνα με του 3 επικρατέστερους, παγκοσμίως, ορισμούς: CDC, IOTF,
WHO
• Περίμετρος μέσης: προκειμένου να εκτιμηθεί η κεντρικού τύπου
παχυσαρκία
• Δερματικές πτυχές: υποδόριο λίπος σε 4 ανατομικά σημεία (τρικέφαλος,
υποωμοπλατιαία, υπερλαγόνια), υπολογισμός % λίπους & μάζας
σωματικού λίπους
Συμπληρωματικά συλλέχθηκαν δεδομένα από τα βιβλιάρια υγείας των παιδιών (βάρος, ύψος &
περίμετρος κεφαλής) από τη γέννηση μέχρι την προσχολική ηλικία, στο πλαίσιο των τακτικών
επισκέψεων των παιδιών στον παιδίατρό τους
Σκοπός ήταν η αξιολόγηση του ρυθμού ανάπτυξης έως και την παρούσα ηλικία των παιδιών
15.
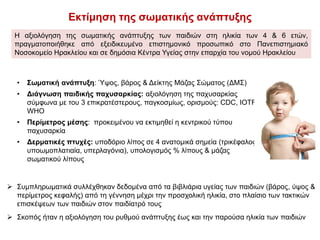
Αρτηριακή πίεση
Μέτρηση αρτηριακήςπίεσης
Πραγματοποιήθηκαν 5 διαδοχικές μετρήσεις (αυτόματο πιεσόμετρο-μόνιτορ
Dinamap Pro-Care 400) σε κάθε παιδί και υπολογίστηκε ο μέσος όρος της
συστολικής και της διαστολικής αρτηριακής πίεσης, καθώς και των παλμών ανά
λεπτό
Εκατοστιαία θέση (ΕΘ) της συστολικής & διαστολικής ΑΠ ανάλογα με το φύλο,
την ηλικία και την ΕΘ του ύψους
Κατάταξη σε φυσιολογικά, προϋπερτασικά και υπερτασικά επίπεδα,
χρησιμοποιήθηκαν οι πίνακες που έχουν δημοσιευθεί από την Ομάδα Εργασίας
του Εθνικού Προγράμματος των ΗΠΑ το 2004 και έχουν υιοθετηθεί τόσο από την
Ευρωπαϊκή Εταιρεία Υπέρτασης το 2009 όσο και από την Ελληνική Εταιρεία
Υπέρτασης το 2011
Φυσιολογικά επίπεδα: συστολική ή διαστολική ΑΠ <90η
εκατοστιαία θέση
σύμφωνα με την ηλικία, το φύλο και την εκατοστιαία θέση του ύψους.
Προϋπερτασικά επίπεδα: συστολική ή διαστολική ΑΠ ≥90η
εκατοστιαία θέση και
<95η
εκ. θέση σύμφωνα με την ηλικία, το φύλο και την εκατοστιαία θέση του
ύψους.
Υπερτασικά επίπεδα: συστολική ή διαστολική ΑΠ ≥95η
εκατοστιαία θέση
σύμφωνα με την ηλικία, το φύλο και την εκατοστιαία θέση του ύψους.
16.
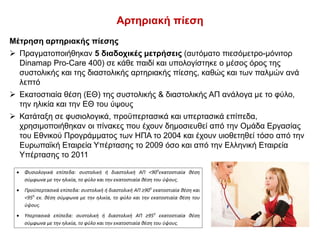
Λιπίδια αίματος &Άλλοι Παράγοντες
Μέτρηση βιοδεικτών παχυσαρκίας
Από το αίμα που συλλέχθηκε πραγματοποιήθηκε ο προσδιορισμός των λιπιδίων
αίματος: ολική χοληστερίνη, LDL- χοληστερίνη, HDL- χοληστερίνη & τριγλυκερίδια
Μέτρηση λεπτίνης-αδιπονεκτίνης στο αίμα
Άλλοι Παράγοντες
Παράλληλα με την κλινική αξιολόγηση των παιδιών πραγματοποιήθηκε
προσωπική συνέντευξη στο γονέα
Σκοπός της συνέντευξης ήταν η λήψη πληροφοριών σχετικά με:
το ιατρικό ιστορικό και τον τρόπο ζωής των παιδιών, την έκθεσή τους σε
ορισμένους περιβαλλοντικούς παράγοντες (έκθεση στον ήλιο, κατανάλωση
νερού, κ.λ.π.), τον ύπνο τους, την απασχόλησή τους κατά τη διάρκεια της
ημέρας (τηλεθέαση, ημερήσιο χρόνο ενασχόλησης των γονέων με τα παιδιά,
κ.λ.π.), καθώς και ορισμένα κοινωνικο-δημογραφικά χαρακτηριστικά
(εργασία γονέων, οικογενειακή κατάσταση και αριθμός παιδιών)
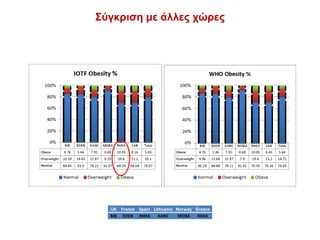
Σύγκριση με άλλεςχώρες
UK France Spain Lithuania Norway Greece
BIB EDEN INMA KANC MOBA RHEA
19.
Future research directions
Earlylife exposures vs childhood obesity:
Diet
The Mother Child Cohort, Rhea Study in Crete,
Greece
Outline of the presentation
Early life exposures vs childhood obesity:
Maternal metabolism
Early life exposures vs childhood obesity:
Environmental pollutants
20.
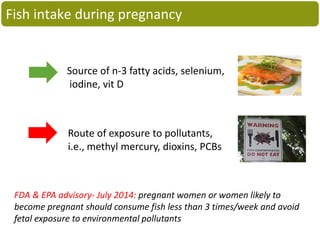
Source of n-3fatty acids, selenium,
iodine, vit D
Route of exposure to pollutants,
i.e., methyl mercury, dioxins, PCBs
FDA & EPA advisory- July 2014: pregnant women or women likely to
become pregnant should consume fish less than 3 times/week and avoid
fetal exposure to environmental pollutants
Fish intake during pregnancy
21.
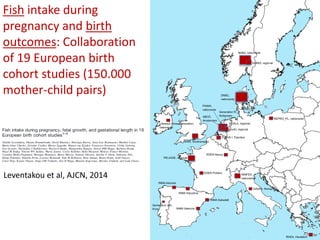
Fish intake during
pregnancyand birth
outcomes: Collaboration
of 19 European birth
cohort studies (150.000
mother-child pairs)
Leventakou et al, AJCN, 2014
22.
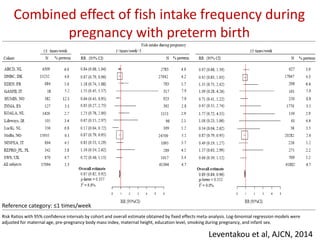
Combined effect offish intake frequency during
pregnancy with preterm birth
Reference category: ≤1 times/week
Leventakou et al, AJCN, 2014
Risk Ratios with 95% confidence intervals by cohort and overall estimate obtained by fixed effects meta-analysis. Log-binomial regression models were
adjusted for maternal age, pre-pregnancy body mass index, maternal height, education level, smoking during pregnancy, and infant sex.
23.
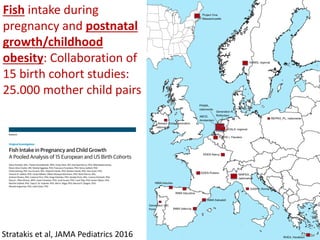
Fish intake during
pregnancyand postnatal
growth/childhood
obesity: Collaboration of
15 birth cohort studies:
25.000 mother child pairs
Stratakis et al, JAMA Pediatrics 2016
24.
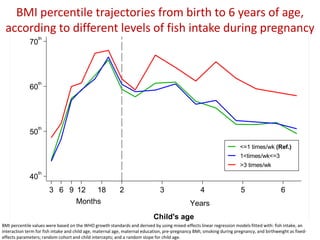
BMI percentile trajectoriesfrom birth to 6 years of age,
according to different levels of fish intake during pregnancy
40
th
50
th
60
th
70
th
3 6 9 21812 43 5 6
Child's age
<=1 times/wk (Ref.)
1<times/wk<=3
>3 times/wk
Months Years
BMI percentile values were based on the WHO growth standards and derived by using mixed-effects linear regression models fitted with: fish intake, an
interaction term for fish intake and child age, maternal age, maternal education, pre-pregnancy BMI, smoking during pregnancy, and birthweight as fixed-
effects parameters; random cohort and child intercepts; and a random slope for child age.
25.
0.5
1.0
1.5
2.0
Boys Girls BoysGirls Boys Girls Boys Girls Boys Girls Boys Girls
Rapid growth birth to 2 years Overweight/obesity at 4 years Overweight/obesity at 6 years
Oddsratio(95%CI)
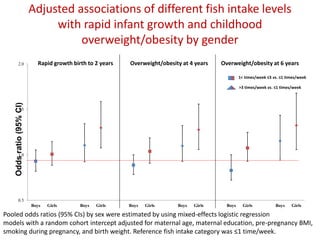
Adjusted associations of different fish intake levels
with rapid infant growth and childhood
overweight/obesity by gender
1< times/week ≤3 vs. ≤1 times/week
>3 times/week vs. ≤1 times/week
Pooled odds ratios (95% CIs) by sex were estimated by using mixed-effects logistic regression
models with a random cohort intercept adjusted for maternal age, maternal education, pre-pregnancy BMI,
smoking during pregnancy, and birth weight. Reference fish intake category was ≤1 time/week.
All models adjustedfor maternal age, pre-pregnancy body mass index, race/ethnicity, education level, parity, smoking during
pregnancy, birth weight for gestation age z- score , breastfeeding duration, fast food intake, TV viewing, child sex and age at
outcome assessment
Chatzi et al, Pediatric Obesity 2016; in press
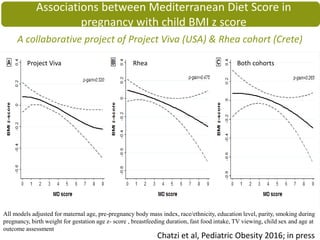
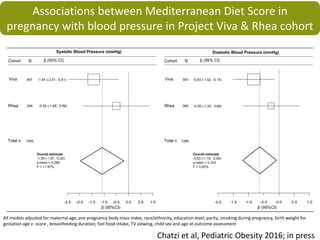
Associations between Mediterranean Diet Score in
pregnancy with child BMI z score
A collaborative project of Project Viva (USA) & Rhea cohort (Crete)
Project Viva Rhea Both cohorts
29.
Associations between MediterraneanDiet Score in
pregnancy with blood pressure in Project Viva & Rhea cohort
All models adjusted for maternal age, pre-pregnancy body mass index, race/ethnicity, education level, parity, smoking during pregnancy, birth weight for
gestation age z- score , breastfeeding duration, fast food intake, TV viewing, child sex and age at outcome assessment
Chatzi et al, Pediatric Obesity 2016; in press
30.
Future research directions
Earlylife exposures vs childhood obesity:
Diet
The Mother Child Cohort, Rhea Study in Crete,
Greece
Outline of the presentation
Early life exposures vs childhood obesity:
Maternal metabolism
Early life exposures vs childhood obesity:
Environmental pollutants
31.
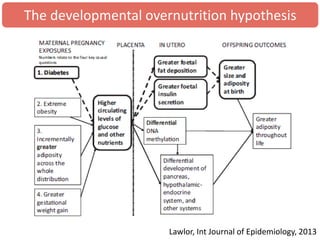
Lawlor, Int Journalof Epidemiology, 2013
The developmental overnutrition hypothesis
32.
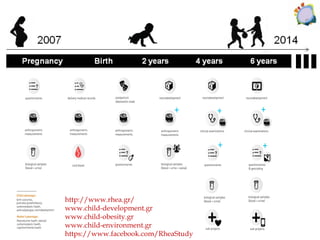
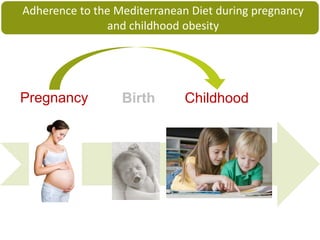
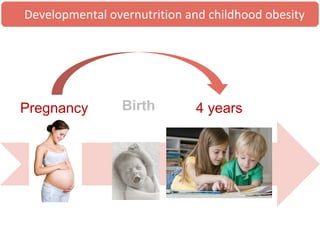
Pregnancy Birth 4years
Developmental overnutrition and childhood obesity
33.
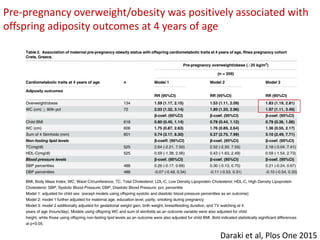
Daraki et al,Plos One 2015
Pre-pregnancy overweight/obesity was positively associated with
offspring adiposity outcomes at 4 years of age
34.
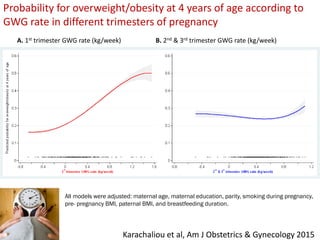
A. 1st trimesterGWG rate (kg/week) B. 2nd & 3rd trimester GWG rate (kg/week)
Probability for overweight/obesity at 4 years of age according to
GWG rate in different trimesters of pregnancy
Karachaliou et al, Am J Obstetrics & Gynecology 2015
All models were adjusted: maternal age, maternal education, parity, smoking during pregnancy,
pre- pregnancy BMI, paternal BMI, and breastfeeding duration.
35.
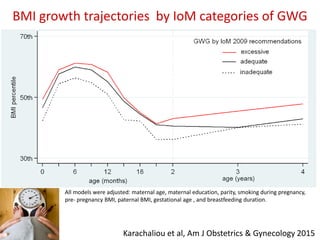
BMI growth trajectoriesby IoM categories of GWG
Karachaliou et al, Am J Obstetrics & Gynecology 2015
All models were adjusted: maternal age, maternal education, parity, smoking during pregnancy,
pre- pregnancy BMI, paternal BMI, gestational age , and breastfeeding duration.
36.
Future research directions
Earlylife exposures vs childhood obesity:
Diet
The Mother Child Cohort, Rhea Study in Crete,
Greece
Outline of the presentation
Early life exposures vs childhood obesity:
Maternal metabolism
Early life exposures vs childhood obesity:
Environmental pollutants
37.
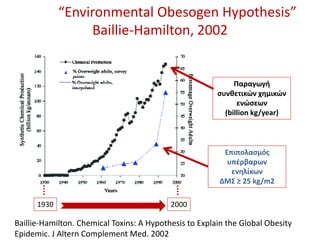
«””’,, “Environmental ObesogenHypothesis”
Baillie-Hamilton, 2002
Baillie-Hamilton. Chemical Toxins: A Hypothesis to Explain the Global Obesity
Epidemic. J Altern Complement Med. 2002
1930 2000
Παραγωγή
συνθετικών χημικών
ενώσεων
(billion kg/year)
Επιπολασμός
υπέρβαρων
ενηλίκων
ΔΜΣ ≥ 25 kg/m2
38.
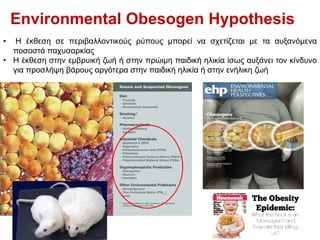
Environmental Obesogen Hypothesis
•Η έκθεση σε περιβαλλοντικούς ρύπους μπορεί να σχετίζεται με τα αυξανόμενα
ποσοστά παχυσαρκίας
• Η έκθεση στην εμβρυική ζωή ή στην πρώιμη παιδική ηλικία ίσως αυξάνει τον κίνδυνο
για προσλήψη βάρους αργότερα στην παιδική ηλικία ή στην ενήλικη ζωή
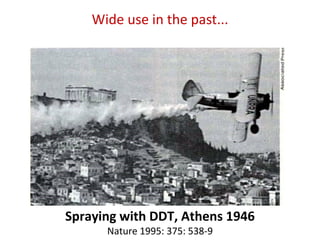
Wide use inthe past...
Spraying with DDT, Athens 1946
Nature 1995: 375: 538-9
41.
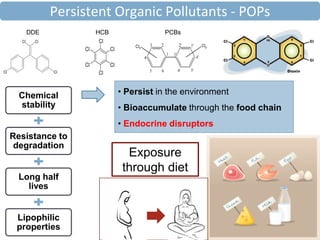
PCBs DDE
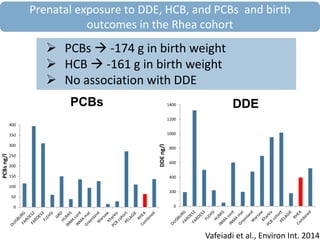
Vafeiadi etal., Environ Int. 2014
0
200
400
600
800
1000
1200
1400
DDEng/l
0
50
100
150
200
250
300
350
400
PCBsng/l
PCBs -174 g in birth weight
HCB -161 g in birth weight
No association with DDE
Prenatal exposure to DDE, HCB, and PCBs and birth
outcomes in the Rhea cohort
42.
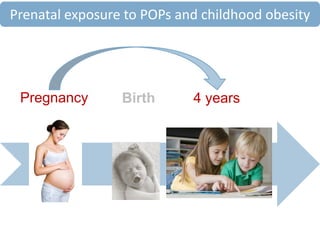
Pregnancy Birth 4years
Prenatal exposure to POPs and childhood obesity
43.
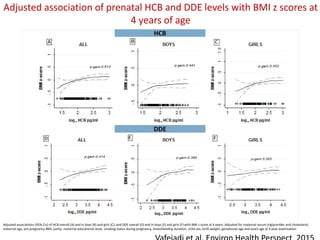
Adjusted association ofprenatal HCB and DDE levels with BMI z scores at
4 years of age
HCB
DDE
Adjusted associations (95% CIs) of HCB overall (A) and in boys (B) and girls (C), and DDE overall (D) and in boys (E) and girls (F) with BMI z score at 4 years. Adjusted for maternal serum triglycerides and cholesterol,
maternal age, pre-pregnancy BMI, parity, maternal educational level, smoking status during pregnancy, breastfeeding duration, child sex, birth weight, gestational age and exact age at 4 year examination
44.
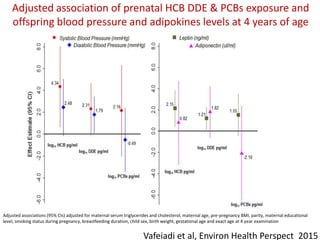
Adjusted association ofprenatal HCB DDE & PCBs exposure and
offspring blood pressure and adipokines levels at 4 years of age
Adjusted associations (95% CIs) adjusted for maternal serum triglycerides and cholesterol, maternal age, pre-pregnancy BMI, parity, maternal educational
level, smoking status during pregnancy, breastfeeding duration, child sex, birth weight, gestational age and exact age at 4 year examination
Vafeiadi et al, Environ Health Perspect 2015
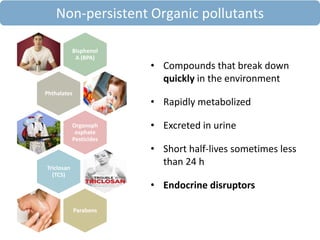
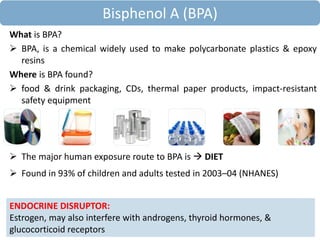
What is BPA?
BPA, is a chemical widely used to make polycarbonate plastics & epoxy
resins
Where is BPA found?
food & drink packaging, CDs, thermal paper products, impact-resistant
safety equipment
The major human exposure route to BPA is DIET
Found in 93% of children and adults tested in 2003–04 (NHANES)
ENDOCRINE DISRUPTOR:
Estrogen, may also interfere with androgens, thyroid hormones, &
glucocorticoid receptors
Bisphenol A (BPA)
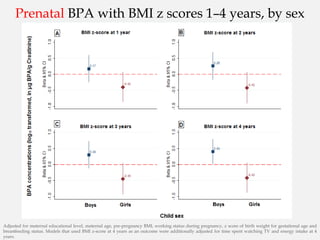
47.
Prenatal BPA withBMI z scores 1–4 years, by sex
Adjusted for maternal educational level, maternal age, pre-pregnancy BMI, working status during pregnancy, z score of birth weight for gestational age and
breastfeeding status. Models that used BMI z-score at 4 years as an outcome were additionally adjusted for time spent watching TV and energy intake at 4
years.
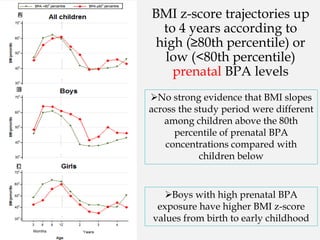
48.
BMI z-score trajectoriesup
to 4 years according to
high (≥80th percentile) or
low (<80th percentile)
prenatal BPA levels
Boys with high prenatal BPA
exposure have higher BMI z-score
values from birth to early childhood
No strong evidence that BMI slopes
across the study period were different
among children above the 80th
percentile of prenatal BPA
concentrations compared with
children below
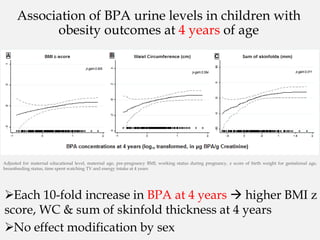
49.
Association of BPAurine levels in children with
obesity outcomes at 4 years of age
Each 10-fold increase in BPA at 4 years higher BMI z
score, WC & sum of skinfold thickness at 4 years
No effect modification by sex
Adjusted for maternal educational level, maternal age, pre-pregnancy BMI, working status during pregnancy, z score of birth weight for gestational age,
breastfeeding status, time spent watching TV and energy intake at 4 years
50.
Future research directions
Earlylife exposures vs childhood obesity:
Diet
The Mother Child Cohort, Rhea Study in Crete,
Greece
Outline of the presentation
Early life exposures vs childhood obesity:
Maternal metabolism
Early life exposures vs childhood obesity:
Environmental pollutants
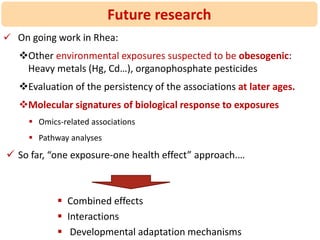
51.
On goingwork in Rhea:
Other environmental exposures suspected to be obesogenic:
Heavy metals (Hg, Cd…), organophosphate pesticides
Evaluation of the persistency of the associations at later ages.
Molecular signatures of biological response to exposures
Omics-related associations
Pathway analyses
So far, “one exposure-one health effect” approach.…
Combined effects
Interactions
Developmental adaptation mechanisms
Future research
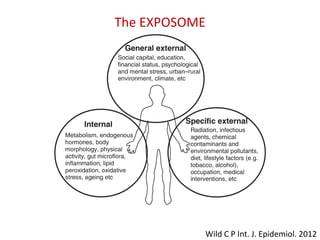
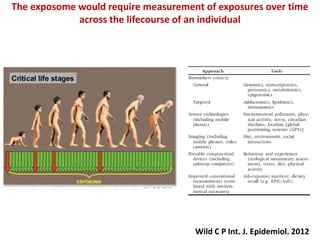
The exposome wouldrequire measurement of exposures over time
across the lifecourse of an individual
Wild C P Int. J. Epidemiol. 2012
54.
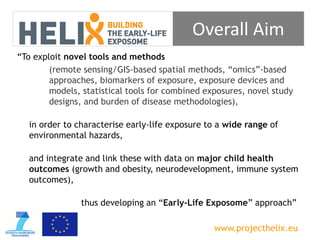
“To exploit noveltools and methods
(remote sensing/GIS-based spatial methods, “omics”-based
approaches, biomarkers of exposure, exposure devices and
models, statistical tools for combined exposures, novel study
designs, and burden of disease methodologies),
in order to characterise early-life exposure to a wide range of
environmental hazards,
and integrate and link these with data on major child health
outcomes (growth and obesity, neurodevelopment, immune system
outcomes),
thus developing an “Early-Life Exposome” approach”
Overall Aim
www.projecthelix.eu
57.
Participation in EUFunded Projects
Environmental Health Risks in
European Birth Cohorts
www.enrieco.org
ESCAPE Project