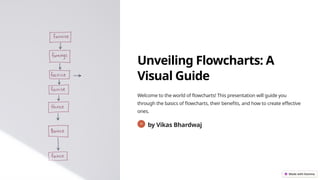
Unveiling Flowcharts: A
Visual Guide
Welcome to the world of flowcharts! This presentation will guide you
through the basics of flowcharts, their benefits, and how to create effective
ones.
VB
by Vikas Bhardwaj
What is a Flowchart?
Visual Representation
A flowchart is a visual representation of a process, showing
steps in a sequential order. It uses symbols and connecting
lines to illustrate the flow of information.
Easy to Understand
Flowcharts provide a clear and concise way to understand
complex processes, making them easier to analyze, interpret,
and troubleshoot.
Benefits of Using Flowcharts
1 1. Enhanced Clarity
Flowcharts provide a clear
visual overview of processes,
promoting better
understanding and
communication.
2 2. Improved Efficiency
By streamlining processes
and identifying inefficiencies,
flowcharts optimize
workflows for better
productivity.
3 3. Easier Collaboration
Visual flowcharts facilitate teamwork, allowing stakeholders to
easily understand and contribute to process improvements.
Basic Flowchart Symbols
Start/End
Represents the beginning or
end of a process, usually an
oval shape.
Process
A rectangular shape
representing a specific task or
action within the process.
Decision
A diamond shape indicating a
point where a choice is made,
with multiple paths branching
out.
Input/Output
A parallelogram shape
indicating data input or output
from the process.
Creating a Flowchart
Define the Process
Clearly define the steps involved in the process you want to flowchart.
Choose Symbols
Select the appropriate symbols to represent each step or decision in the process.
Connect Symbols
Connect the symbols with arrows to show the sequence of steps and decision paths.
Structuring the Flowchart
1 Top-Down
The most common structure, where the flowchart starts at
the top and flows downwards.
2 Left-to-Right
A horizontal structure where the flowchart progresses from
left to right, ideal for sequential processes.
3 Hierarchical
A multi-level structure with branches and sub-processes,
suitable for complex processes with nested steps.
Flowchart Best Practices
Keep it Simple
Avoid unnecessary complexity, using only essential symbols
and clear labels.
Use Consistent Symbols
Maintain consistency with symbol usage throughout the
flowchart for better readability.
Provide Clear Labels
Label each step or decision point clearly and concisely for
easy understanding.
Flowchart Examples
1
Software Development
Flowcharting the process of software development from coding to testing.
2
Business Processes
Mapping out the steps in a customer service or sales process.
3
Decision Trees
Visualizing decision-making scenarios and their potential
outcomes.
Troubleshooting Flowcharts
1
Lack of Clarity
Ensure all steps and decision points are clearly defined and labelled.
2
Symbol Inconsistencies
Maintain consistent symbol usage throughout the flowchart for easy
understanding.
3
Logical Errors
Verify that the flowchart logically represents the process and
accurately reflects decision paths.
Conclusion and Key Takeaways
1
Visualize Processes
Flowcharts provide a clear and concise way to understand and communicate processes.
2
Enhance Efficiency
Optimize workflows, identify inefficiencies, and streamline processes.
3
Improve Collaboration
Flowcharts facilitate teamwork and promote clear communication.

Unveiling-Flowcharts-A-Visual-Guide.pptx

  • 1.
    Unveiling Flowcharts: A VisualGuide Welcome to the world of flowcharts! This presentation will guide you through the basics of flowcharts, their benefits, and how to create effective ones. VB by Vikas Bhardwaj
  • 2.
    What is aFlowchart? Visual Representation A flowchart is a visual representation of a process, showing steps in a sequential order. It uses symbols and connecting lines to illustrate the flow of information. Easy to Understand Flowcharts provide a clear and concise way to understand complex processes, making them easier to analyze, interpret, and troubleshoot.
  • 3.
    Benefits of UsingFlowcharts 1 1. Enhanced Clarity Flowcharts provide a clear visual overview of processes, promoting better understanding and communication. 2 2. Improved Efficiency By streamlining processes and identifying inefficiencies, flowcharts optimize workflows for better productivity. 3 3. Easier Collaboration Visual flowcharts facilitate teamwork, allowing stakeholders to easily understand and contribute to process improvements.
  • 4.
    Basic Flowchart Symbols Start/End Representsthe beginning or end of a process, usually an oval shape. Process A rectangular shape representing a specific task or action within the process. Decision A diamond shape indicating a point where a choice is made, with multiple paths branching out. Input/Output A parallelogram shape indicating data input or output from the process.
  • 5.
    Creating a Flowchart Definethe Process Clearly define the steps involved in the process you want to flowchart. Choose Symbols Select the appropriate symbols to represent each step or decision in the process. Connect Symbols Connect the symbols with arrows to show the sequence of steps and decision paths.
  • 6.
    Structuring the Flowchart 1Top-Down The most common structure, where the flowchart starts at the top and flows downwards. 2 Left-to-Right A horizontal structure where the flowchart progresses from left to right, ideal for sequential processes. 3 Hierarchical A multi-level structure with branches and sub-processes, suitable for complex processes with nested steps.
  • 7.
    Flowchart Best Practices Keepit Simple Avoid unnecessary complexity, using only essential symbols and clear labels. Use Consistent Symbols Maintain consistency with symbol usage throughout the flowchart for better readability. Provide Clear Labels Label each step or decision point clearly and concisely for easy understanding.
  • 8.
    Flowchart Examples 1 Software Development Flowchartingthe process of software development from coding to testing. 2 Business Processes Mapping out the steps in a customer service or sales process. 3 Decision Trees Visualizing decision-making scenarios and their potential outcomes.
  • 9.
    Troubleshooting Flowcharts 1 Lack ofClarity Ensure all steps and decision points are clearly defined and labelled. 2 Symbol Inconsistencies Maintain consistent symbol usage throughout the flowchart for easy understanding. 3 Logical Errors Verify that the flowchart logically represents the process and accurately reflects decision paths.
  • 10.
    Conclusion and KeyTakeaways 1 Visualize Processes Flowcharts provide a clear and concise way to understand and communicate processes. 2 Enhance Efficiency Optimize workflows, identify inefficiencies, and streamline processes. 3 Improve Collaboration Flowcharts facilitate teamwork and promote clear communication.