Downloaded 120 times
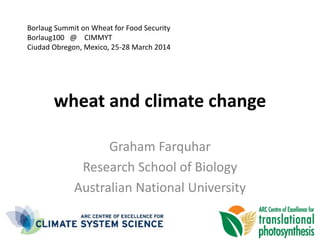
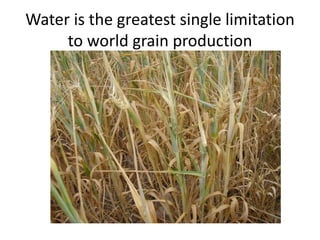

![Effects of [CO2] and T on growth &
yield
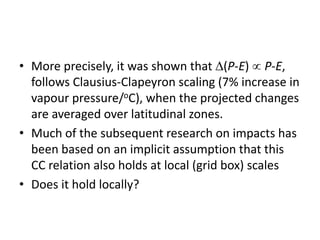
• To what extent can we use responses to today’s
variations in temperature to learn about future
changes in T?
• Effects of T on assimilation rate are different at
different [CO2]
• In the short term there are interfering
correlations with less rainfall
• Effects on sterility or abortion-poorly understood
(see Poster 132)
• Photothermal quotient](https://image.slidesharecdn.com/2-140408141608-phpapp02/85/Wheat-and-climate-change-20-320.jpg)
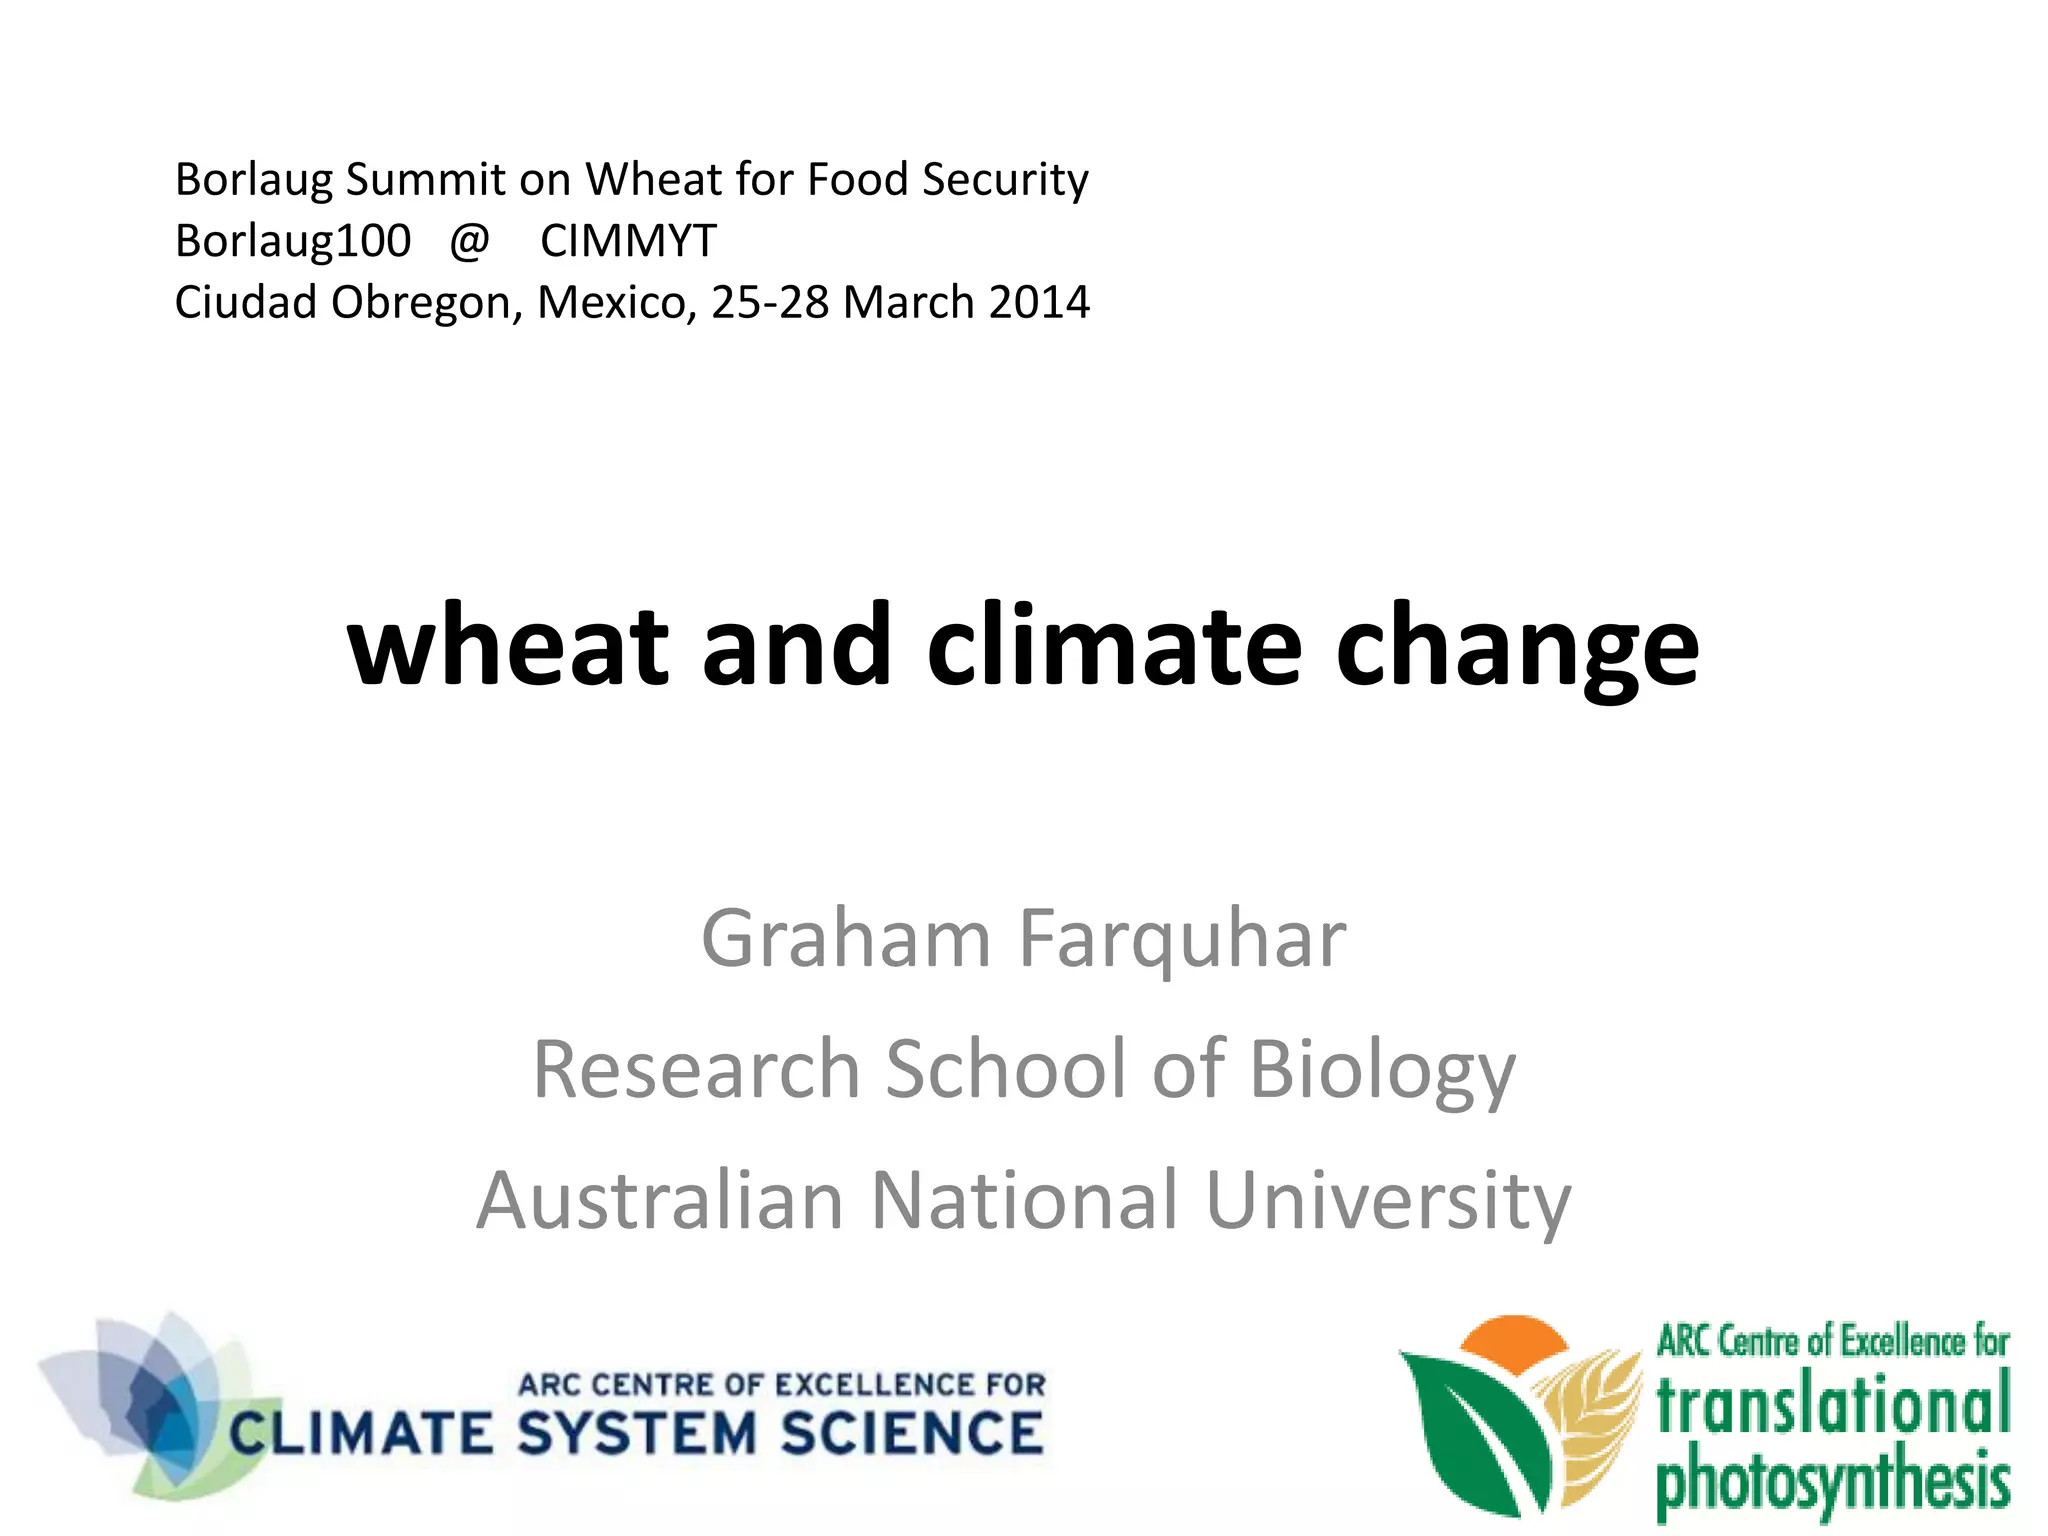
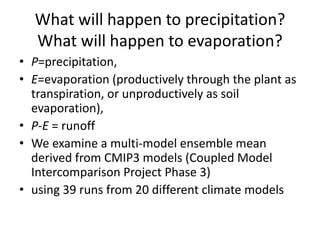
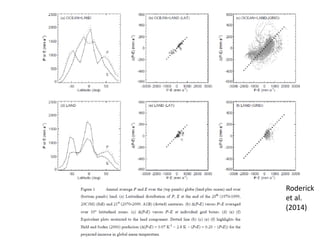
![How does CO2 concentration affect the
water requirements of plant growth?
• At the leaf level doubling the [CO2] is
effectively like almost doubling the rainfall. cf
Wong, Cowan & Farquhar Nature 1979
• So when the [CO2] was only half its present
value, say 20,000 years ago, the rainfall would
only have been about half as effective as that
rainfall would be today.](https://image.slidesharecdn.com/2-140408141608-phpapp02/85/Wheat-and-climate-change-21-320.jpg)
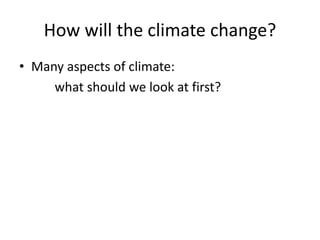
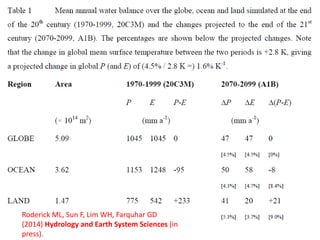
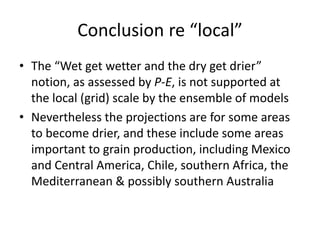
![Impact of CO2 fertilization on maximum foliage
cover across the globe’s warm, arid environments
Randall J. Donohue, Michael L. Roderick, Tim R.
McVicar, and Graham D. Farquhar
GRL 2013
From 1982 to 2010 [CO2] increased 14% and the
responsiveness of foliage cover to precipitation increased
11% in the driest regions](https://image.slidesharecdn.com/2-140408141608-phpapp02/85/Wheat-and-climate-change-23-320.jpg)
![Four Summary Messages
3. Research on water-use efficiency (which should
increase in rain-fed environments under
increasing [CO2]) and drought tolerance, for
present-day problems, will be vital for future
climates, particularly in the context of increased
demand for water, just as will research on
improvement of yield potential.
4. There could be surprises and an understanding
of [CO2] effects on e.g. photosynthesis,
flowering and plant water relations in an
ecological context would be insurance.](https://image.slidesharecdn.com/2-140408141608-phpapp02/85/Wheat-and-climate-change-25-320.jpg)


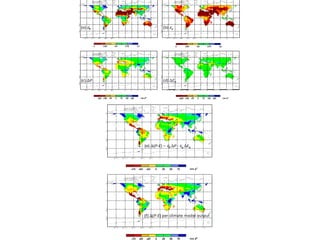
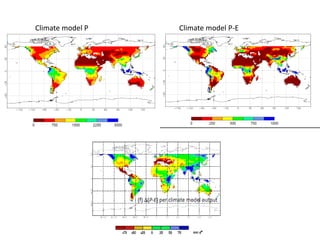

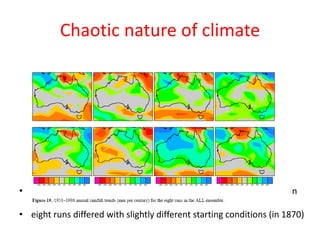
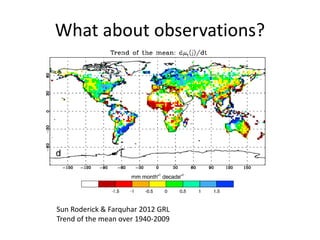
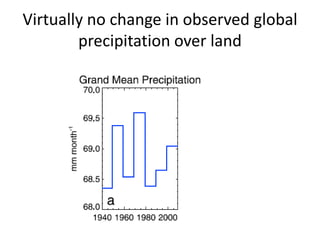
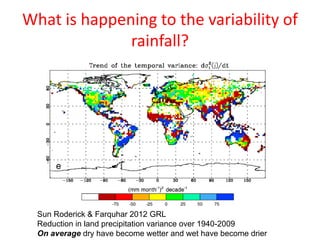
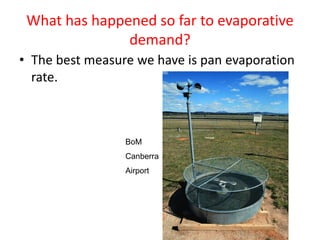
The document discusses the impact of climate change on wheat production, focusing on changes in precipitation and evaporation patterns due to rising temperatures. It highlights the variability of predicted climate outcomes at local scales, contrasting the 'wet get wetter and dry get drier' theory with observed trends. It emphasizes the need for further research on water-use efficiency and the effects of elevated CO2 levels on plant growth and yields while considering the chaotic nature of climate systems.


![谷歌留痕技术 [ 𝙩𝙤𝙥 𝟮𝟯𝟯. 𝙘 𝙤𝙢 ]](https://cdn.slidesharecdn.com/ss_thumbnails/top233-260130174328-3833018c-thumbnail.jpg?width=640&height=640&fit=bounds)


