Downloaded 152 times

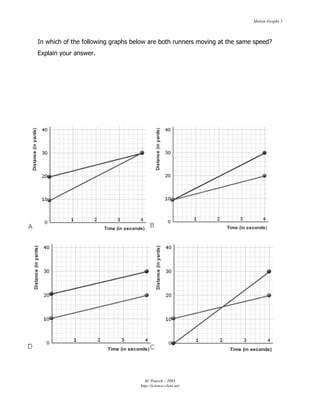
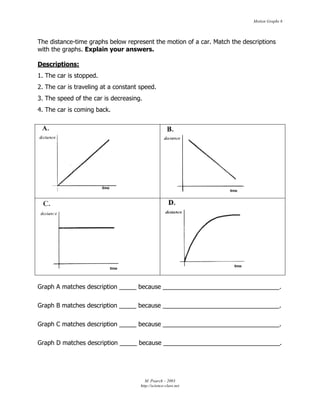

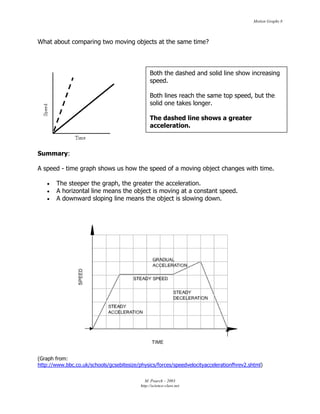
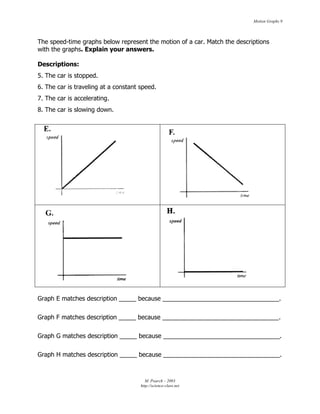
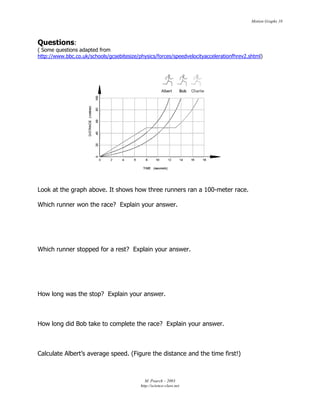
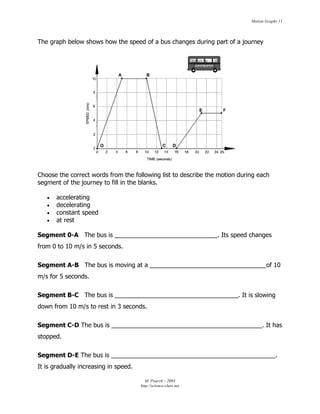

\n\nThe document explains how to use and interpret distance-time and speed-time graphs to analyze motion. It provides examples of different types of motion graphs and their meanings. Distance-time graphs show how distance changes over time and can indicate if an object is moving at constant speed, accelerating, or decelerating. Speed-time graphs show how speed changes over time and also indicate constant, increasing, or decreasing speed. Key features of the graphs like slope and curvature are used to determine properties of the motion like speed, acceleration, and changes therein.


![Getting Started with Apache Spark: Big Data Made Simple [Free Meetup]](https://cdn.slidesharecdn.com/ss_thumbnails/apachesparkgettingstarted-260203175547-8361bcc3-thumbnail.jpg?width=640&height=640&fit=bounds)


