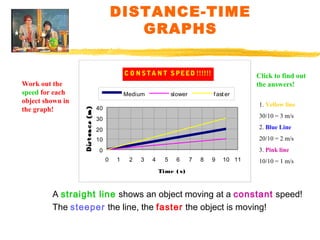
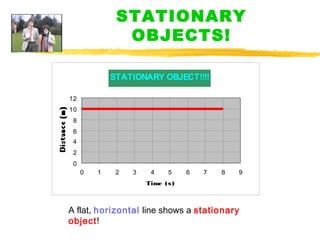
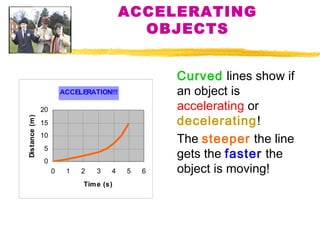
DISTANCE-TIME
GRAPHS
C O N S T A N T S PEED !!!!!!

Work out the
speed for each
object shown in
the graph!

Medium

slower

Click to find out
the answers!
f ast er

1. Yellow line

40
30

30/10 = 3 m/s

20

2. Blue Line

10

20/10 = 2 m/s

0

3. Pink line
0

1

2

3

4

5

6

7

8

9

10 11

10/10 = 1 m/s

Time ( s)

A straight line shows an object moving at a constant speed!
The steeper the line, the faster the object is moving!
STATIONARY
OBJECTS!
STATIONARY OBJECT!!!!
12
10
8
6
4
2
0
0

1

2

3

4

5

6

7

8

9

Time ( s )

A flat, horizontal line shows a stationary
object!
ACCELERATING
OBJECTS

ACCELERATION!!!

Distance (m )

20
15
10
5
0
0

1

2

3

4

Tim e (s)

5

6

Curved lines show if
an object is
accelerating or
decelerating!
The steeper the line
gets the faster the
object is moving!
GRAPH
QUESTIONS!
MAN WALKING A CAT
14
12
10
8

)
m
(
e
c
n
a
t
s
i
D

6
4
2
0
0

1

2

3
4
Time (s)

5

6

7

1. What is the speed of the
man during the first three
seconds?
2. What is the man doing
between 3 and 5 seconds?
3. Calculate the speed of the
man between 5 and 7 seconds.
4. What is the total distance
that he has moved?
5. Calculate the average
speed for the whole journey.
Check
here for
answers!

• 1. 12/3 = 4 m/s
•2. Stationary
•3. 12/2 = 6 m/s
•4. 24 m
•5. 3.4 m/s
Draw a distance-time graph showing your
journey to school!
Try to include different gradients to show
different speeds. Remember – steep slope is
fast, gentle slope slow!!
Try to include rough distances and times at
key points on your graph.
Sketch a distance -time graph for a parachute jump!
Think carefully!!!!
Describe the motion of the jogger in each section of the graph!

Distance time graphs

  • 2.
    DISTANCE-TIME GRAPHS C O NS T A N T S PEED !!!!!! Work out the speed for each object shown in the graph! Medium slower Click to find out the answers! f ast er 1. Yellow line 40 30 30/10 = 3 m/s 20 2. Blue Line 10 20/10 = 2 m/s 0 3. Pink line 0 1 2 3 4 5 6 7 8 9 10 11 10/10 = 1 m/s Time ( s) A straight line shows an object moving at a constant speed! The steeper the line, the faster the object is moving!
  • 3.
  • 4.
    ACCELERATING OBJECTS ACCELERATION!!! Distance (m ) 20 15 10 5 0 0 1 2 3 4 Time (s) 5 6 Curved lines show if an object is accelerating or decelerating! The steeper the line gets the faster the object is moving!
  • 5.
    GRAPH QUESTIONS! MAN WALKING ACAT 14 12 10 8 ) m ( e c n a t s i D 6 4 2 0 0 1 2 3 4 Time (s) 5 6 7 1. What is the speed of the man during the first three seconds? 2. What is the man doing between 3 and 5 seconds? 3. Calculate the speed of the man between 5 and 7 seconds. 4. What is the total distance that he has moved? 5. Calculate the average speed for the whole journey. Check here for answers! • 1. 12/3 = 4 m/s •2. Stationary •3. 12/2 = 6 m/s •4. 24 m •5. 3.4 m/s
  • 6.
    Draw a distance-timegraph showing your journey to school! Try to include different gradients to show different speeds. Remember – steep slope is fast, gentle slope slow!! Try to include rough distances and times at key points on your graph. Sketch a distance -time graph for a parachute jump! Think carefully!!!!
  • 7.
    Describe the motionof the jogger in each section of the graph!