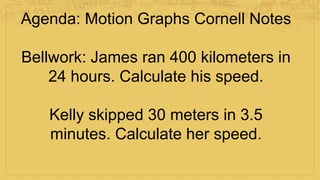
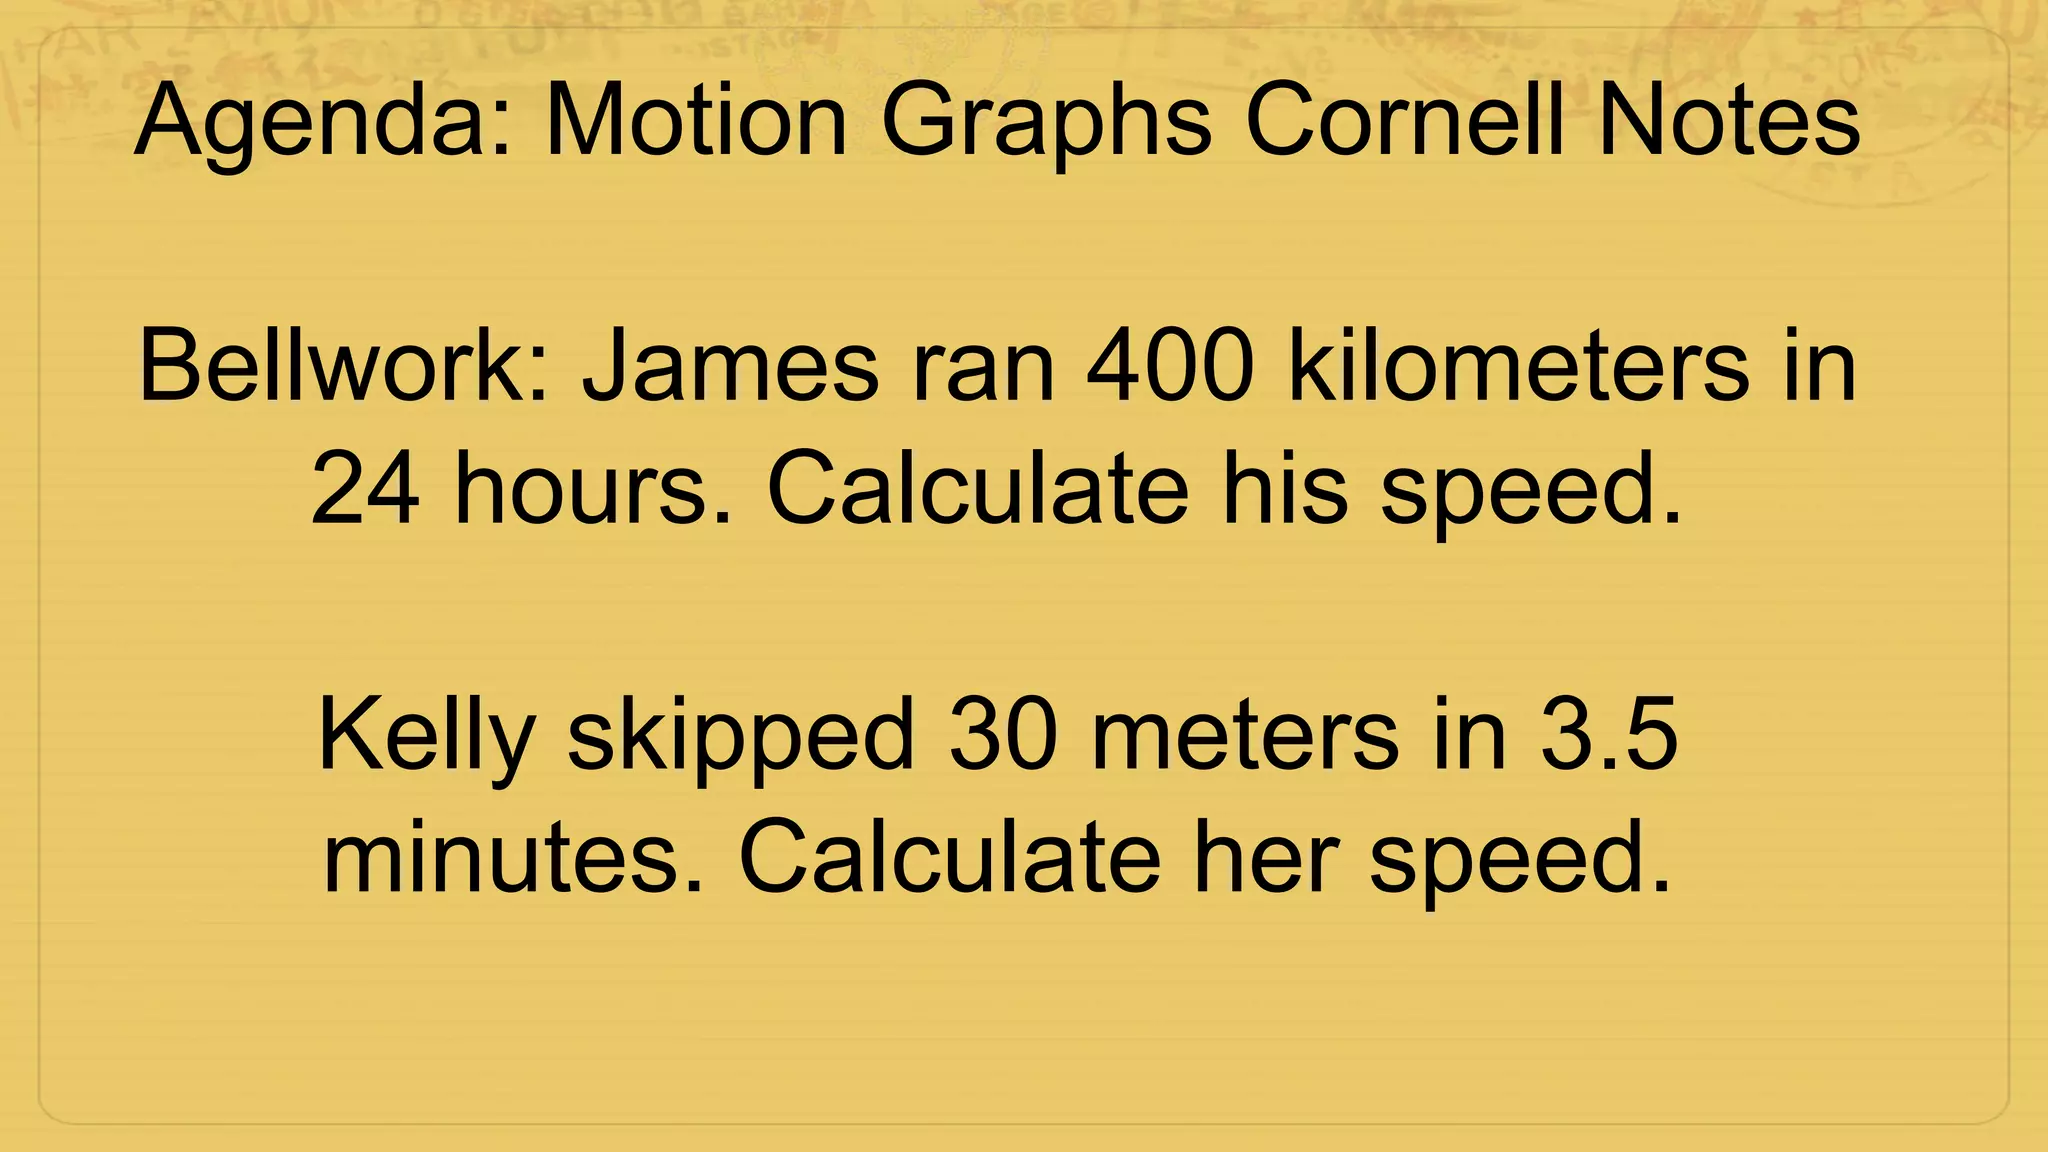
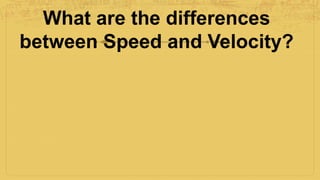
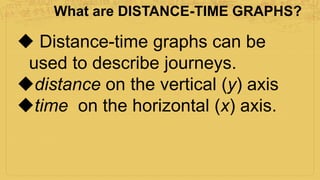
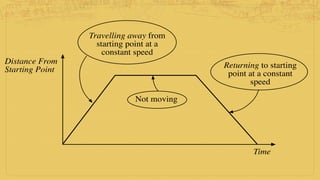
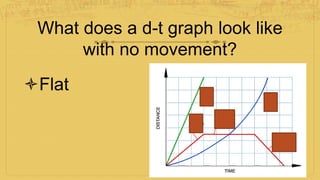
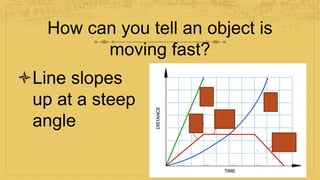
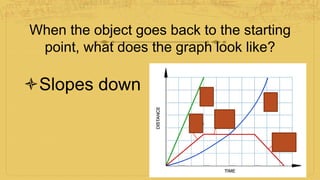
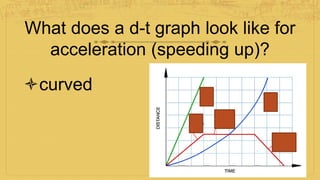
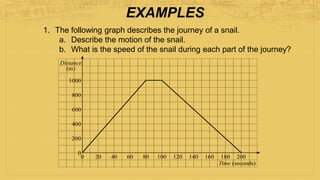
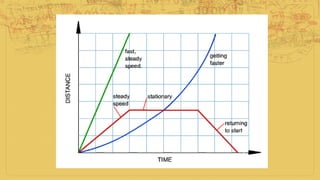
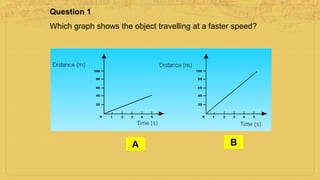
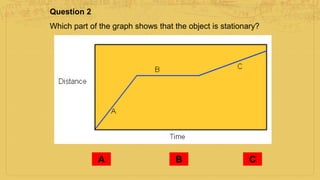
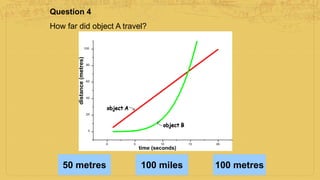
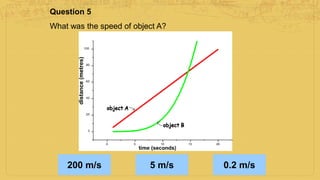
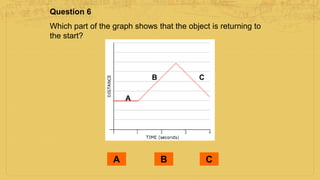
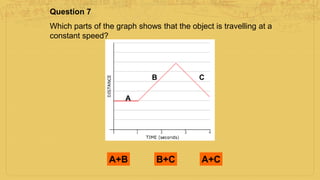
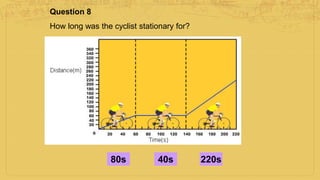
Agenda: Motion Graphs Cornell Notes
Bellwork: James ran 400 kilometers in
24 hours. Calculate his speed.
Kelly skipped 30 meters in 3.5
minutes. Calculate her speed.
What are the differences
between Speed and Velocity?
How do we calculate Speed,
Distance and Time?
Speed =
Distance
Time
Distance = Speed ´ time
Time =
Distance
Speed
What are DISTANCE-TIME GRAPHS?
 Distance-time graphs can be
used to describe journeys.
distance on the vertical (y) axis
time on the horizontal (x) axis.
What does a d-t graph look like
with no movement?
Flat
How can you tell an object is
moving fast?
Line slopes
up at a steep
angle
When the object goes back to the starting
point, what does the graph look like?
Slopes down
What does a d-t graph look like for
acceleration (speeding up)?
curved
EXAMPLES
1. The following graph describes the journey of a snail.
a. Describe the motion of the snail.
b. What is the speed of the snail during each part of the journey?
MEP Y8 Practice Book B18.4
Example 1
The graph shows how far a child is from home.
Distance
(m)
200
400
0
600
800
1000
0 20 40 60 80 100 120 140 160 180 200
Time (seconds)
Question 1
Which graph shows the object travelling at a faster speed?
A B
Question 2
Which part of the graph shows that the object is stationary?
A B C
Question 3
Which line shows an object that is accelerating?
A B
Question 4
How far did object A travel?
50 metres 100 miles 100 metres
Question 5
What was the speed of object A?
200 m/s 5 m/s 0.2 m/s
Question 6
Which part of the graph shows that the object is returning to
the start?
A
B C
A B C
Question 7
Which parts of the graph shows that the object is travelling at a
constant speed?
A
B C
A+B B+C A+C
Question 8
How long was the cyclist stationary for?
A
B C
80s 40s 220s

D t graph cornell notes

  • 1.
    Agenda: Motion GraphsCornell Notes Bellwork: James ran 400 kilometers in 24 hours. Calculate his speed. Kelly skipped 30 meters in 3.5 minutes. Calculate her speed.
  • 2.
    What are thedifferences between Speed and Velocity?
  • 3.
    How do wecalculate Speed, Distance and Time? Speed = Distance Time Distance = Speed ´ time Time = Distance Speed
  • 4.
    What are DISTANCE-TIMEGRAPHS?  Distance-time graphs can be used to describe journeys. distance on the vertical (y) axis time on the horizontal (x) axis.
  • 6.
    What does ad-t graph look like with no movement? Flat
  • 7.
    How can youtell an object is moving fast? Line slopes up at a steep angle
  • 8.
    When the objectgoes back to the starting point, what does the graph look like? Slopes down
  • 9.
    What does ad-t graph look like for acceleration (speeding up)? curved
  • 10.
    EXAMPLES 1. The followinggraph describes the journey of a snail. a. Describe the motion of the snail. b. What is the speed of the snail during each part of the journey? MEP Y8 Practice Book B18.4 Example 1 The graph shows how far a child is from home. Distance (m) 200 400 0 600 800 1000 0 20 40 60 80 100 120 140 160 180 200 Time (seconds)
  • 12.
    Question 1 Which graphshows the object travelling at a faster speed? A B
  • 13.
    Question 2 Which partof the graph shows that the object is stationary? A B C
  • 14.
    Question 3 Which lineshows an object that is accelerating? A B
  • 15.
    Question 4 How fardid object A travel? 50 metres 100 miles 100 metres
  • 16.
    Question 5 What wasthe speed of object A? 200 m/s 5 m/s 0.2 m/s
  • 17.
    Question 6 Which partof the graph shows that the object is returning to the start? A B C A B C
  • 18.
    Question 7 Which partsof the graph shows that the object is travelling at a constant speed? A B C A+B B+C A+C
  • 19.
    Question 8 How longwas the cyclist stationary for? A B C 80s 40s 220s