Where shall wego?
Liverpool Football
Club ground
Sydney Opera House
The Taj Mahal Tower Bridge in
London
Let’s find out, as a class, the
distance between our school
and one of these
destinations.
How long would it take to
get there, and what means
of travel should we consider?
3.
Today, you will...
Explainwhat a
distance-time graph
is and what it
represents
Interpret the
slopes in
distance-time
graphs
Calculate the
speeds in
distance-time
graphs
4.
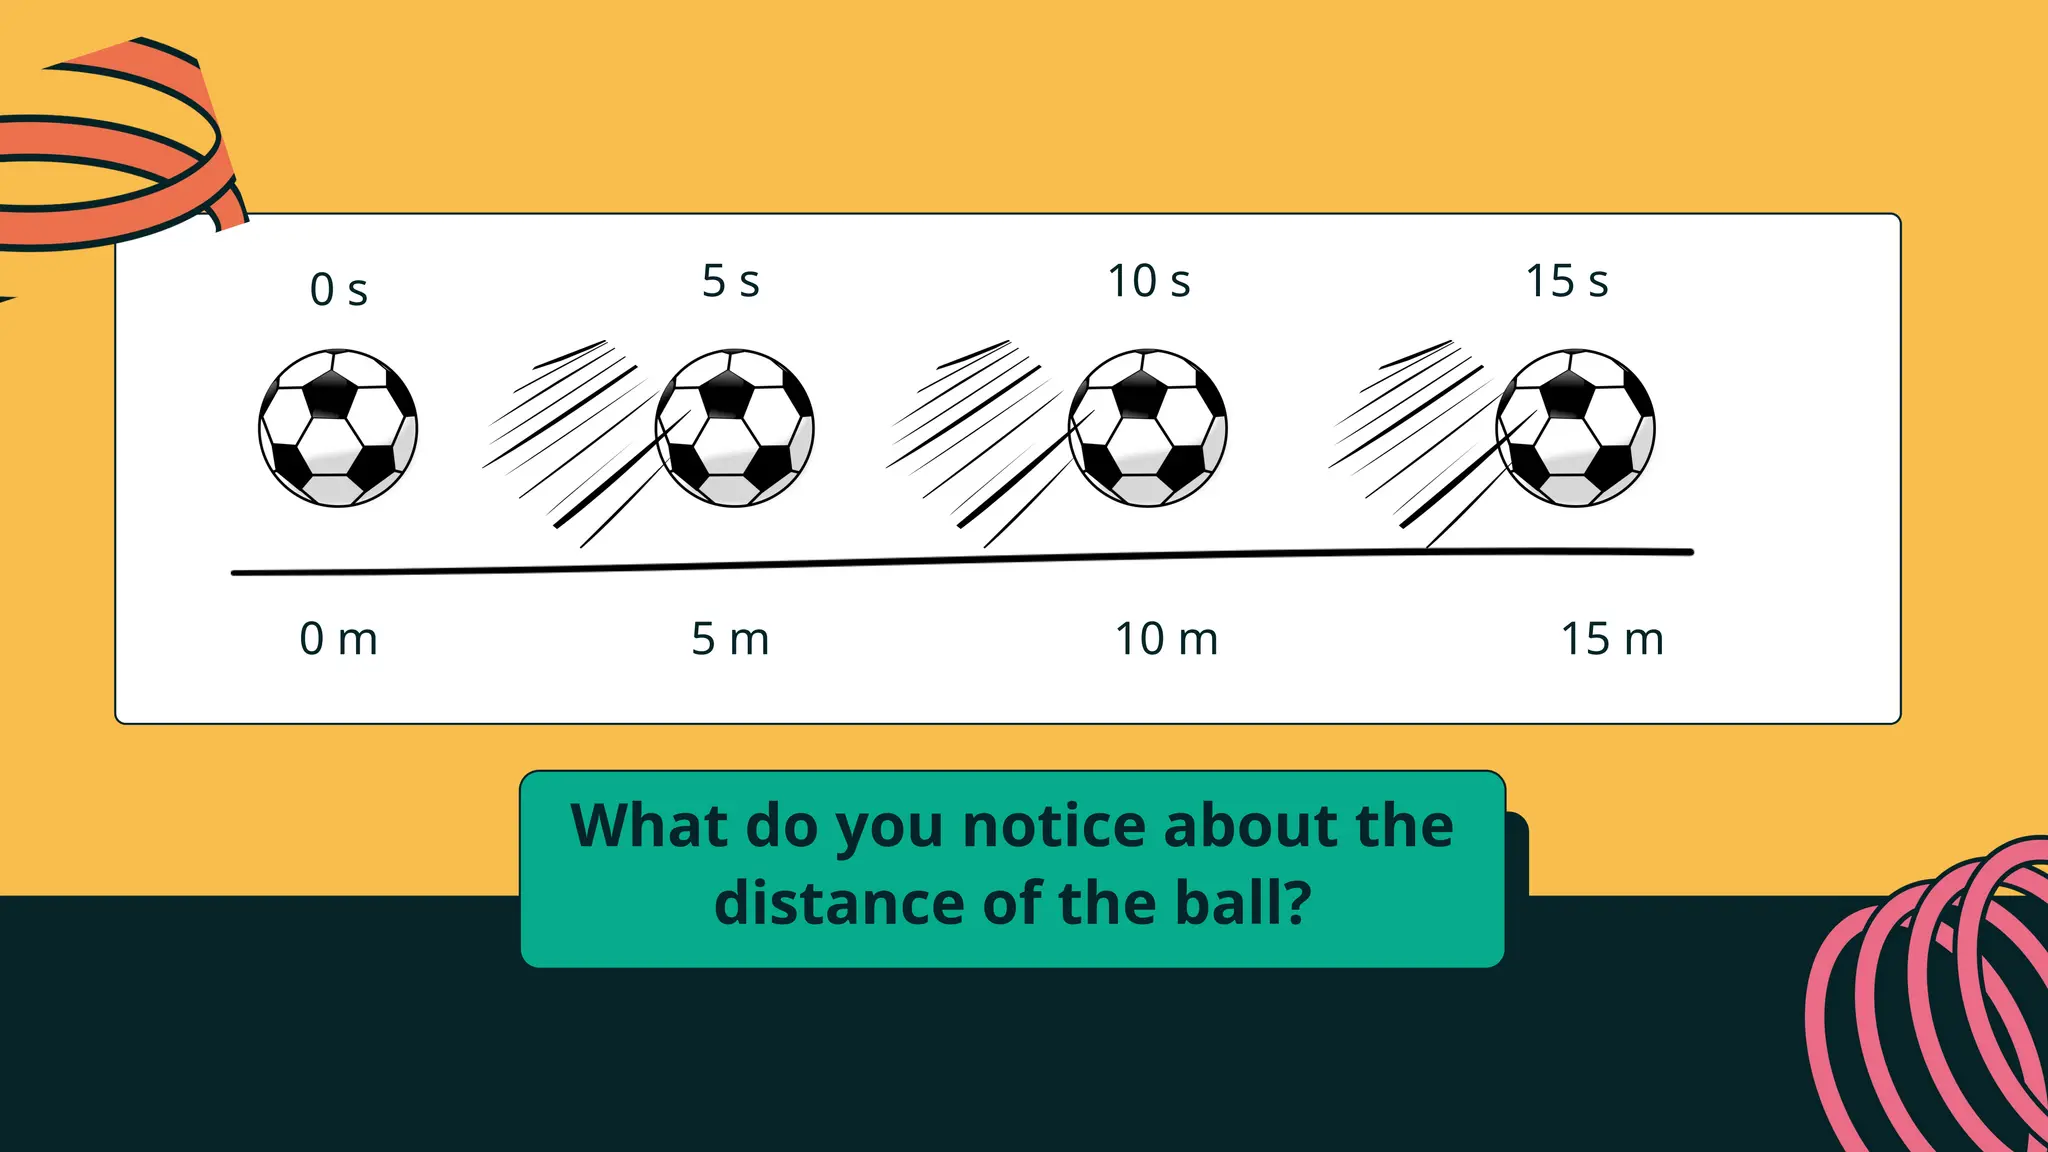
0 m 5m 10 m 15 m
0 s 5 s 10 s 15 s
What do you notice about the
distance of the ball?
5.
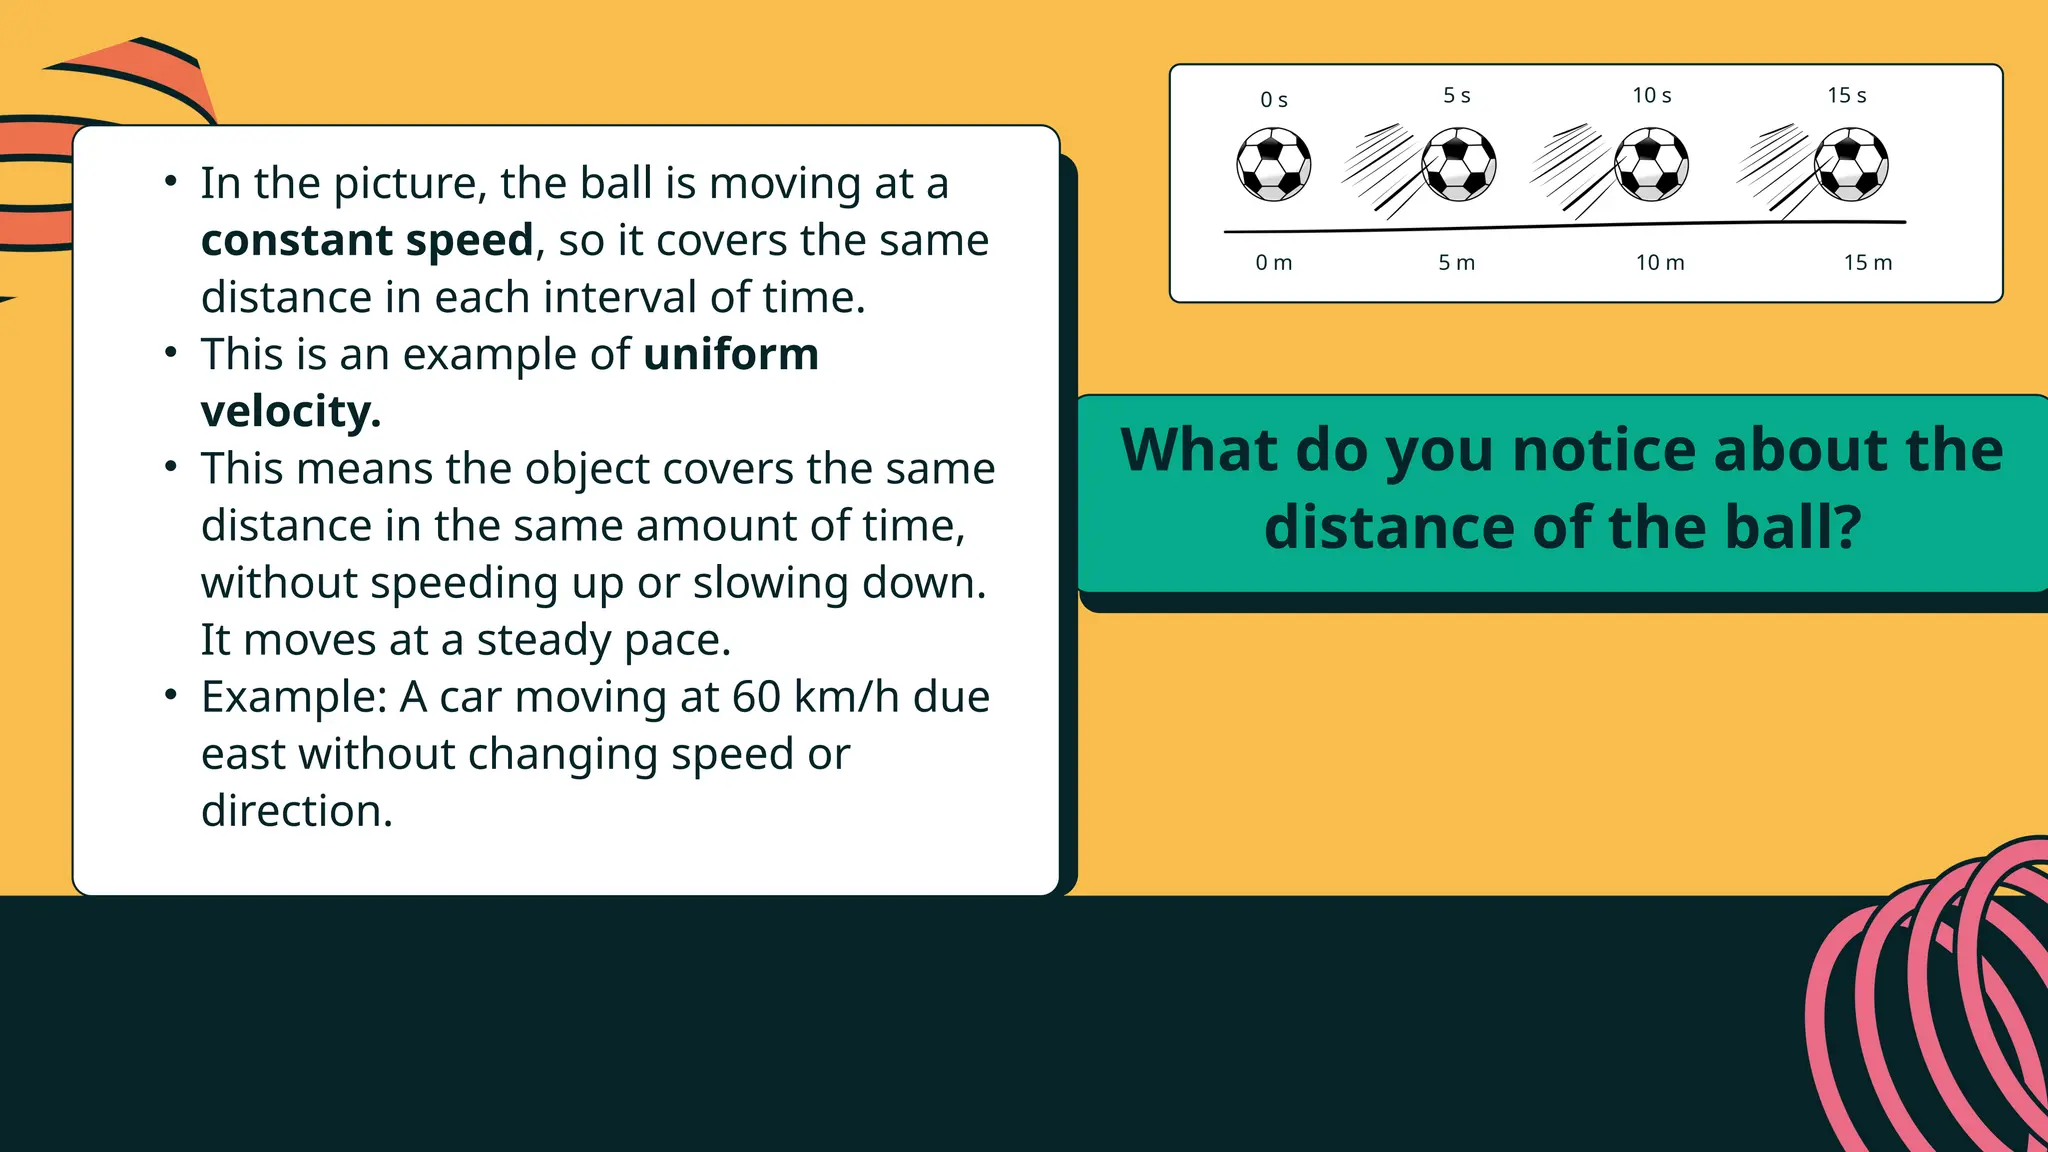
0 m 5m 10 m 15 m
0 s 5 s 10 s 15 s
What do you notice about the
distance of the ball?
• In the picture, the ball is moving at a
constant speed, so it covers the same
distance in each interval of time.
• This is an example of uniform
velocity.
• This means the object covers the same
distance in the same amount of time,
without speeding up or slowing down.
It moves at a steady pace.
• Example: A car moving at 60 km/h due
east without changing speed or
direction.
6.
x-axis
Time
Distance
or
Position
y-axis
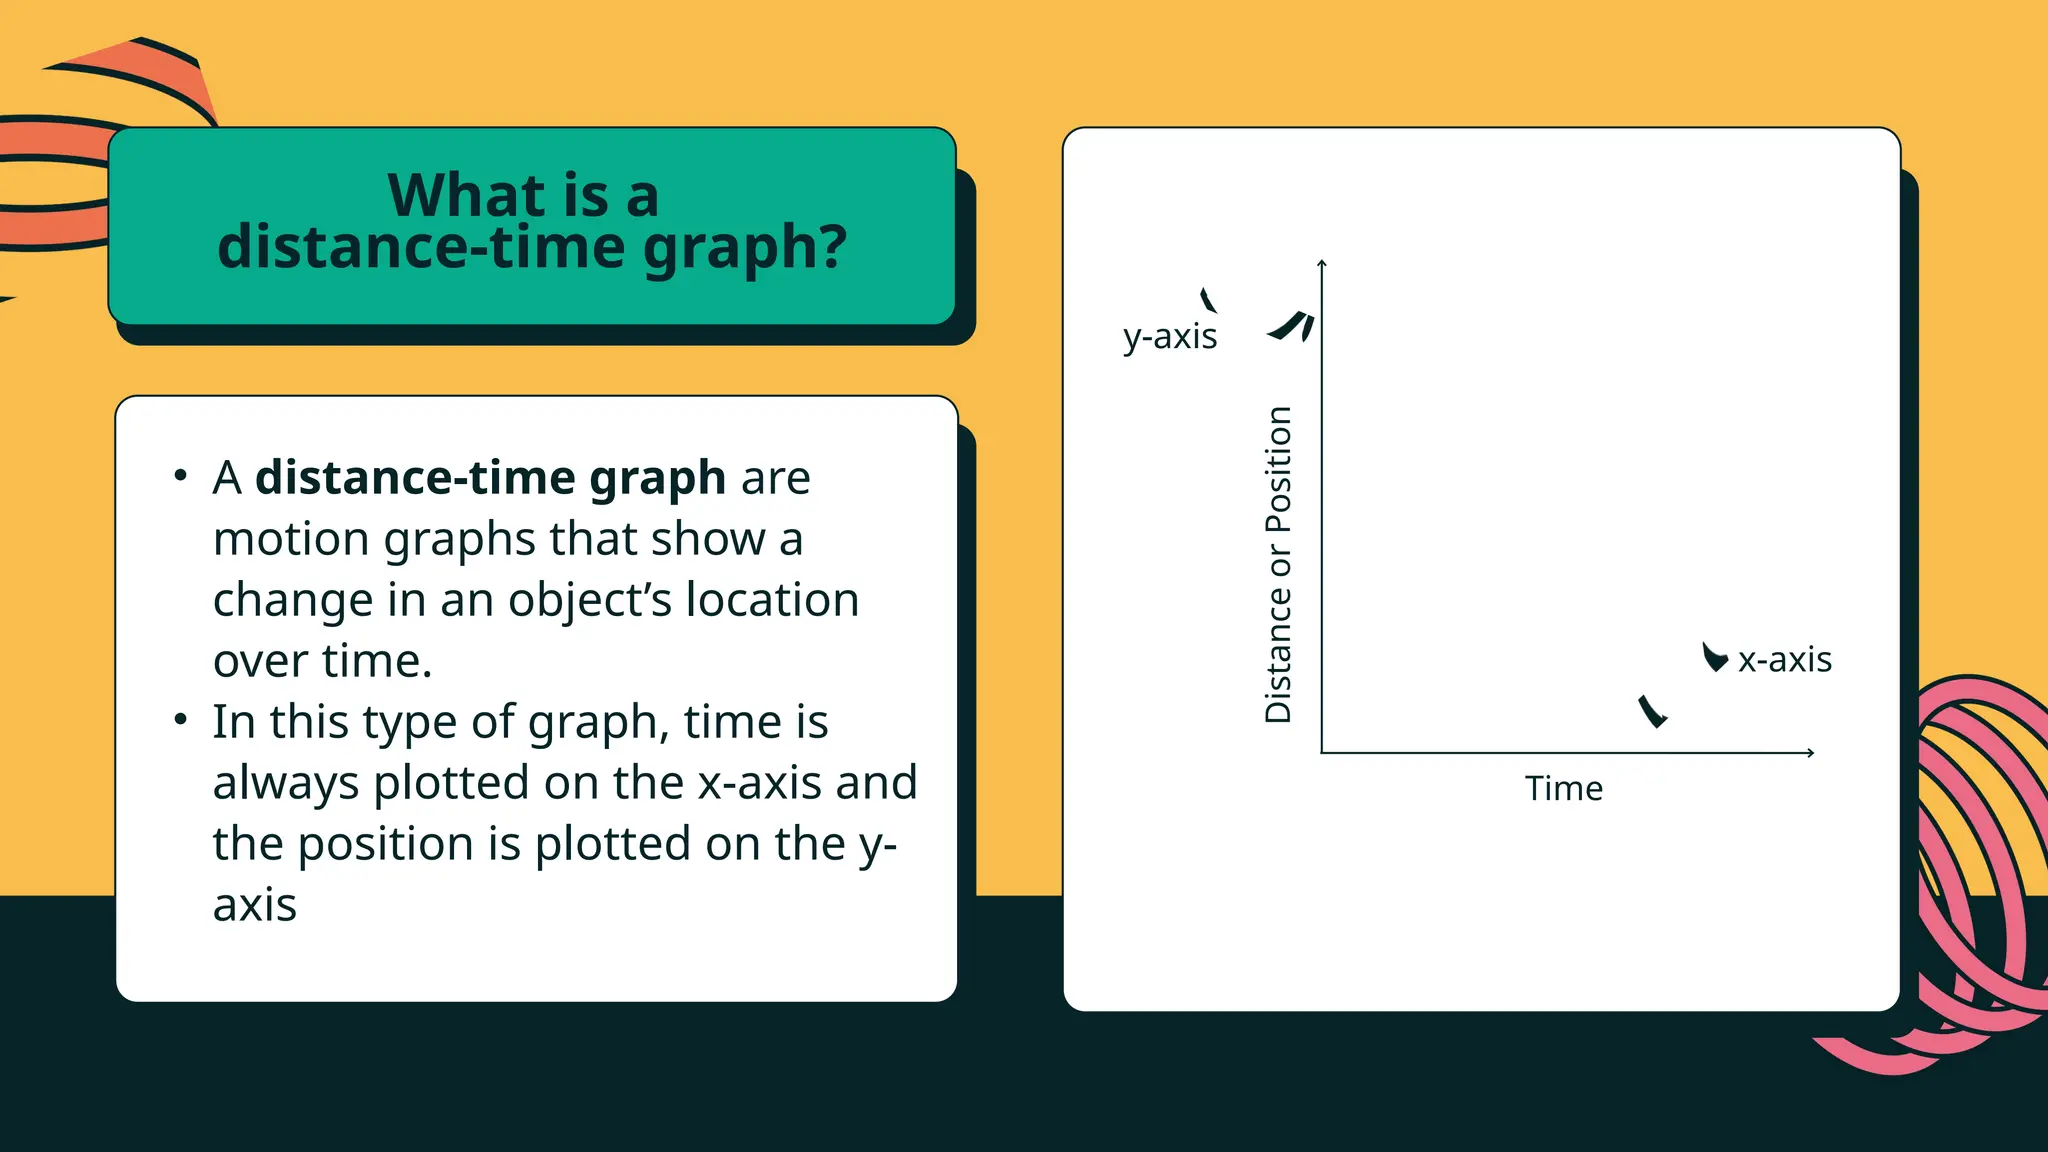
What is a
distance-timegraph?
• A distance-time graph are
motion graphs that show a
change in an object’s location
over time.
• In this type of graph, time is
always plotted on the x-axis and
the position is plotted on the y-
axis
7.
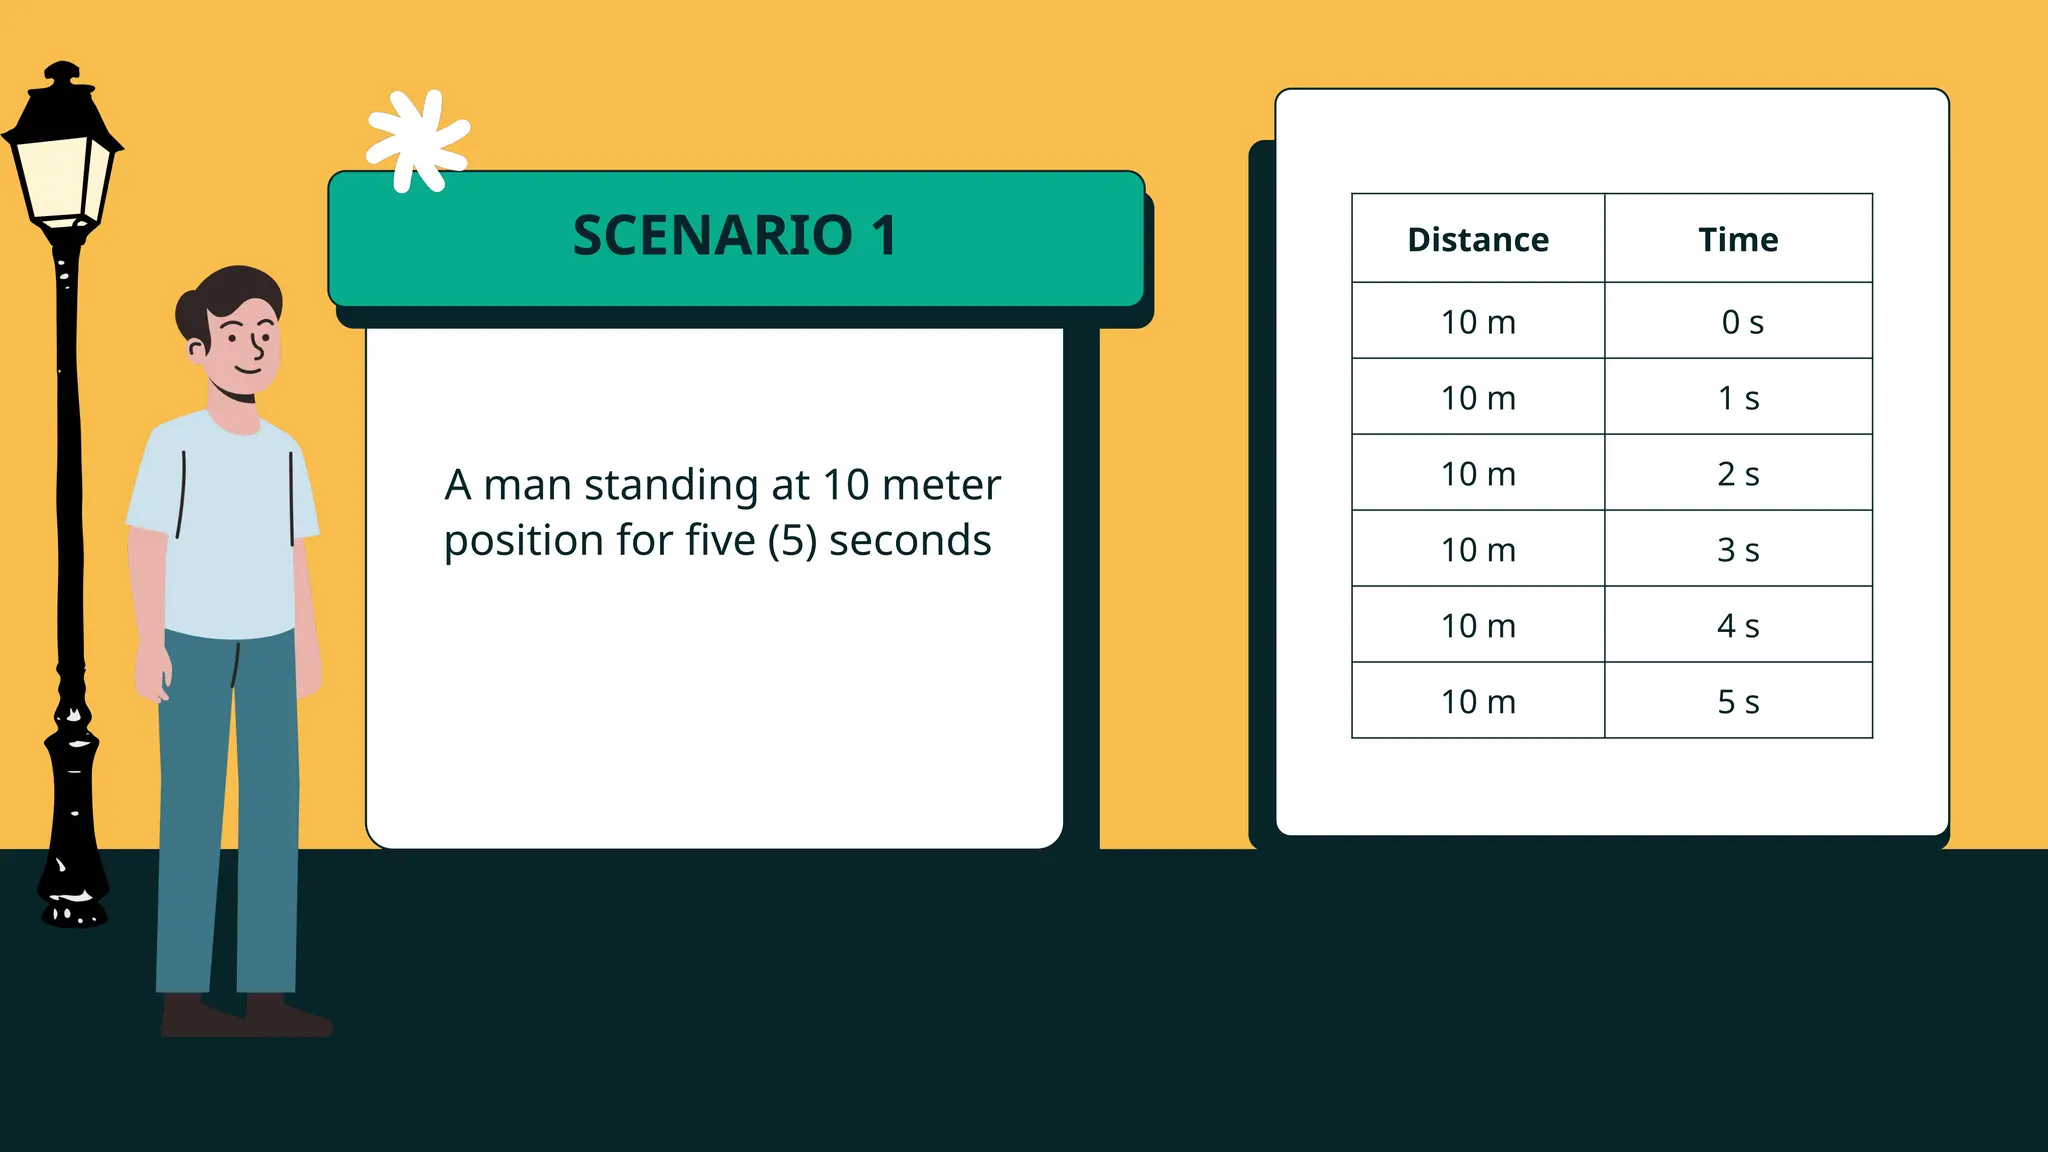
SCENARIO 1
A manstanding at 10 meter
position for five (5) seconds
Distance Time
10 m 0 s
10 m 1 s
10 m 2 s
10 m 3 s
10 m 4 s
10 m 5 s
8.
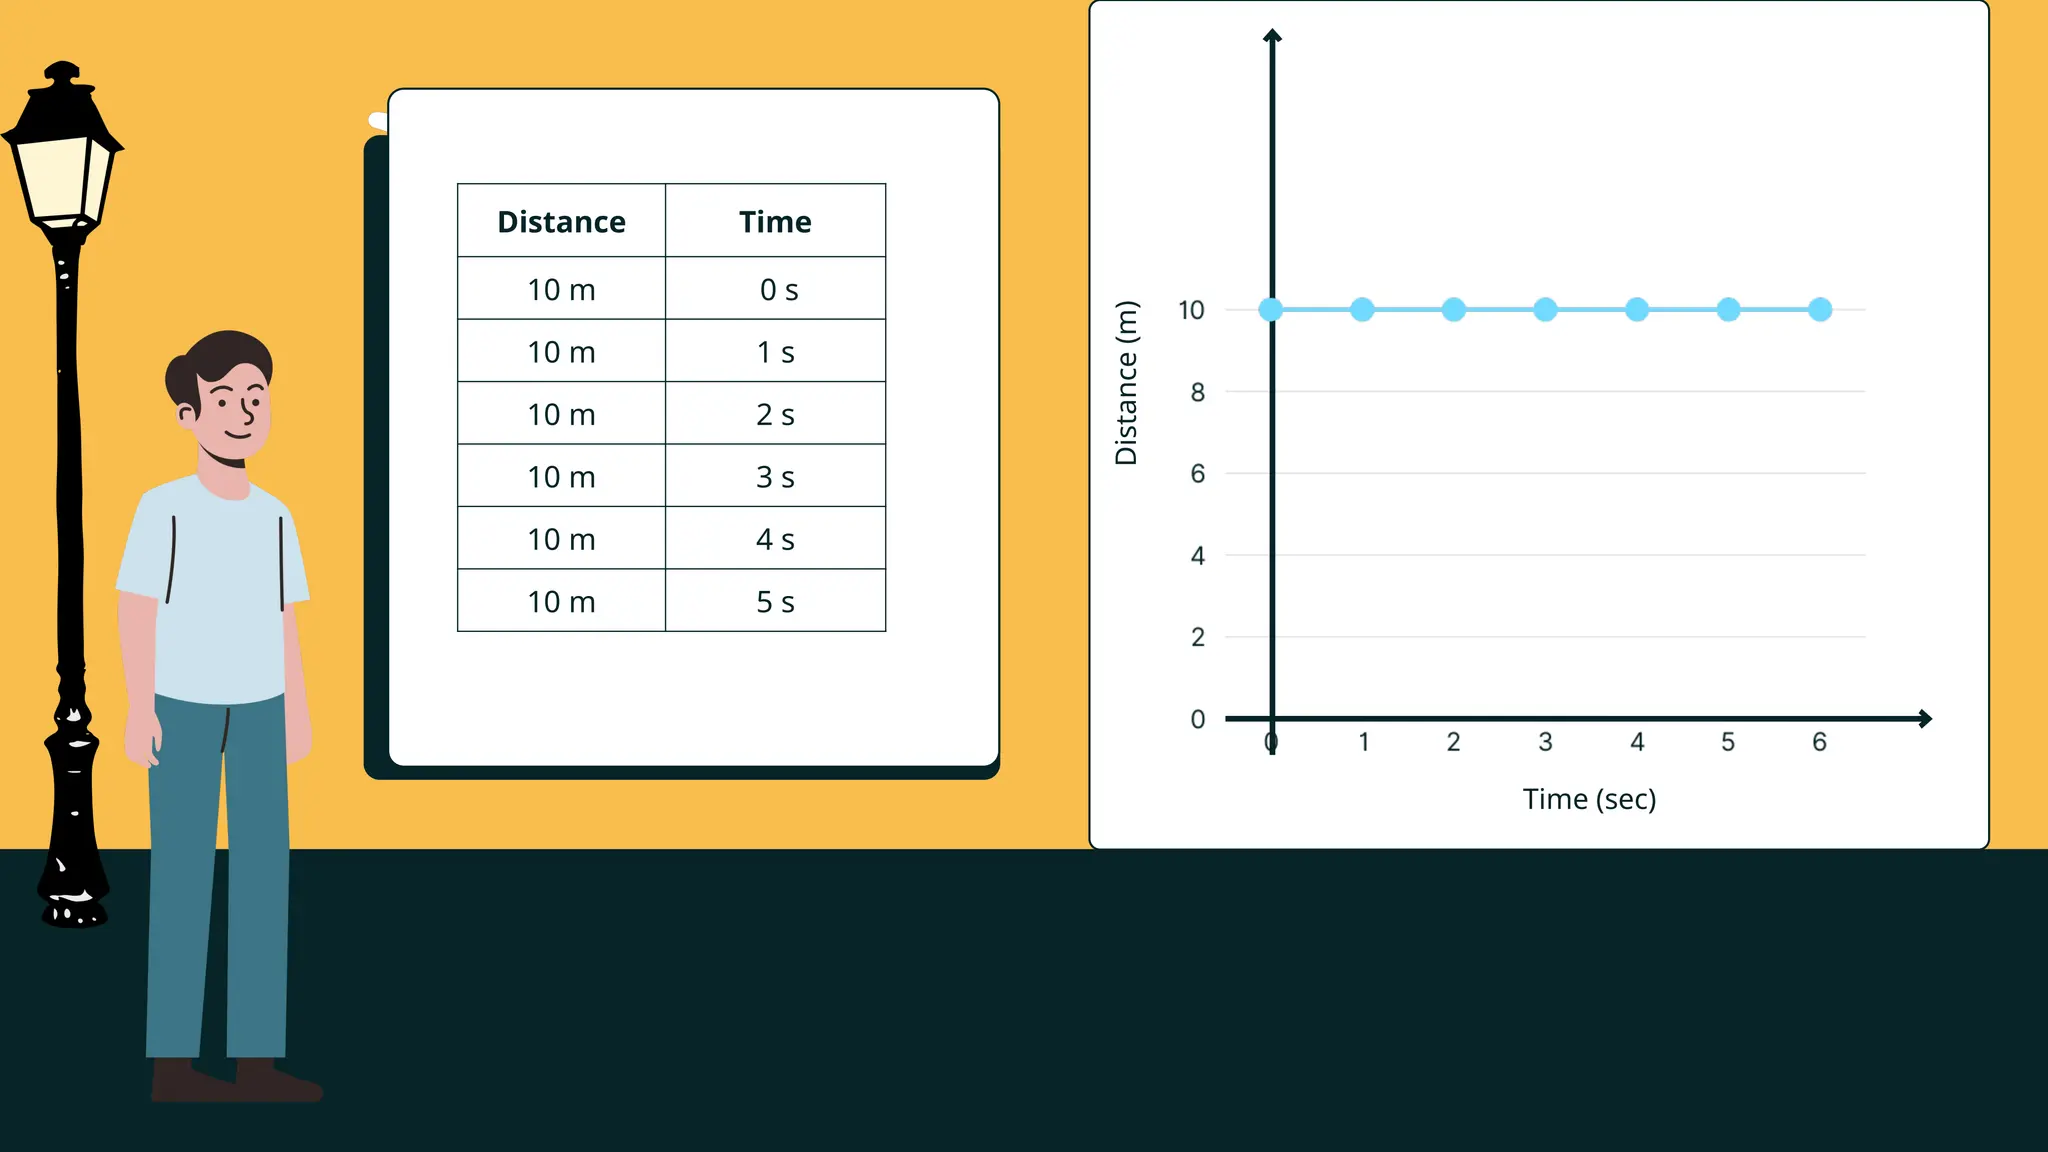
Distance Time
10 m0 s
10 m 1 s
10 m 2 s
10 m 3 s
10 m 4 s
10 m 5 s
Time (sec)
Distance
(m)
9.
Time (sec)
Distance
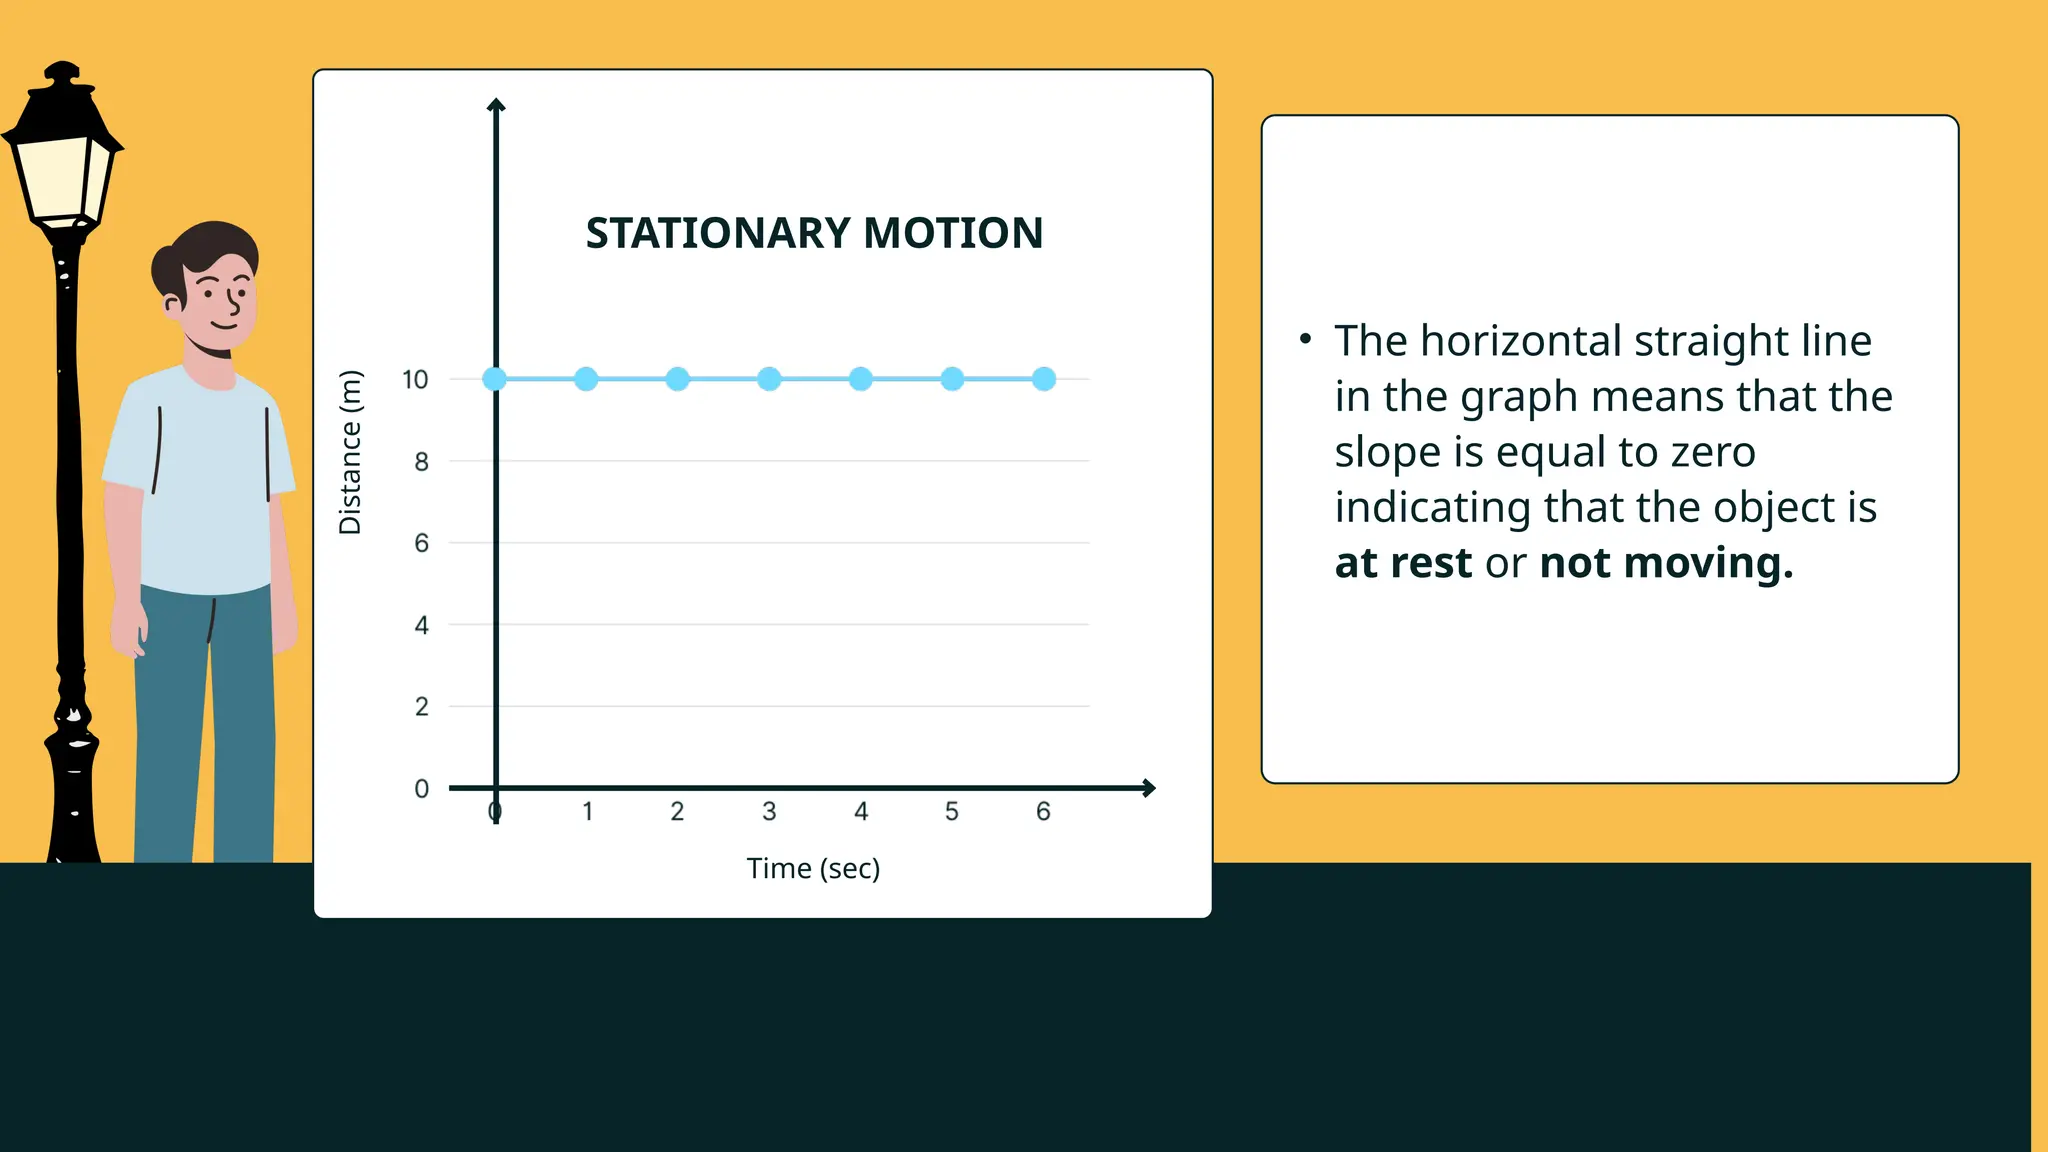
(m) •The horizontal straight line
in the graph means that the
slope is equal to zero
indicating that the object is
at rest or not moving.
STATIONARY MOTION
10.
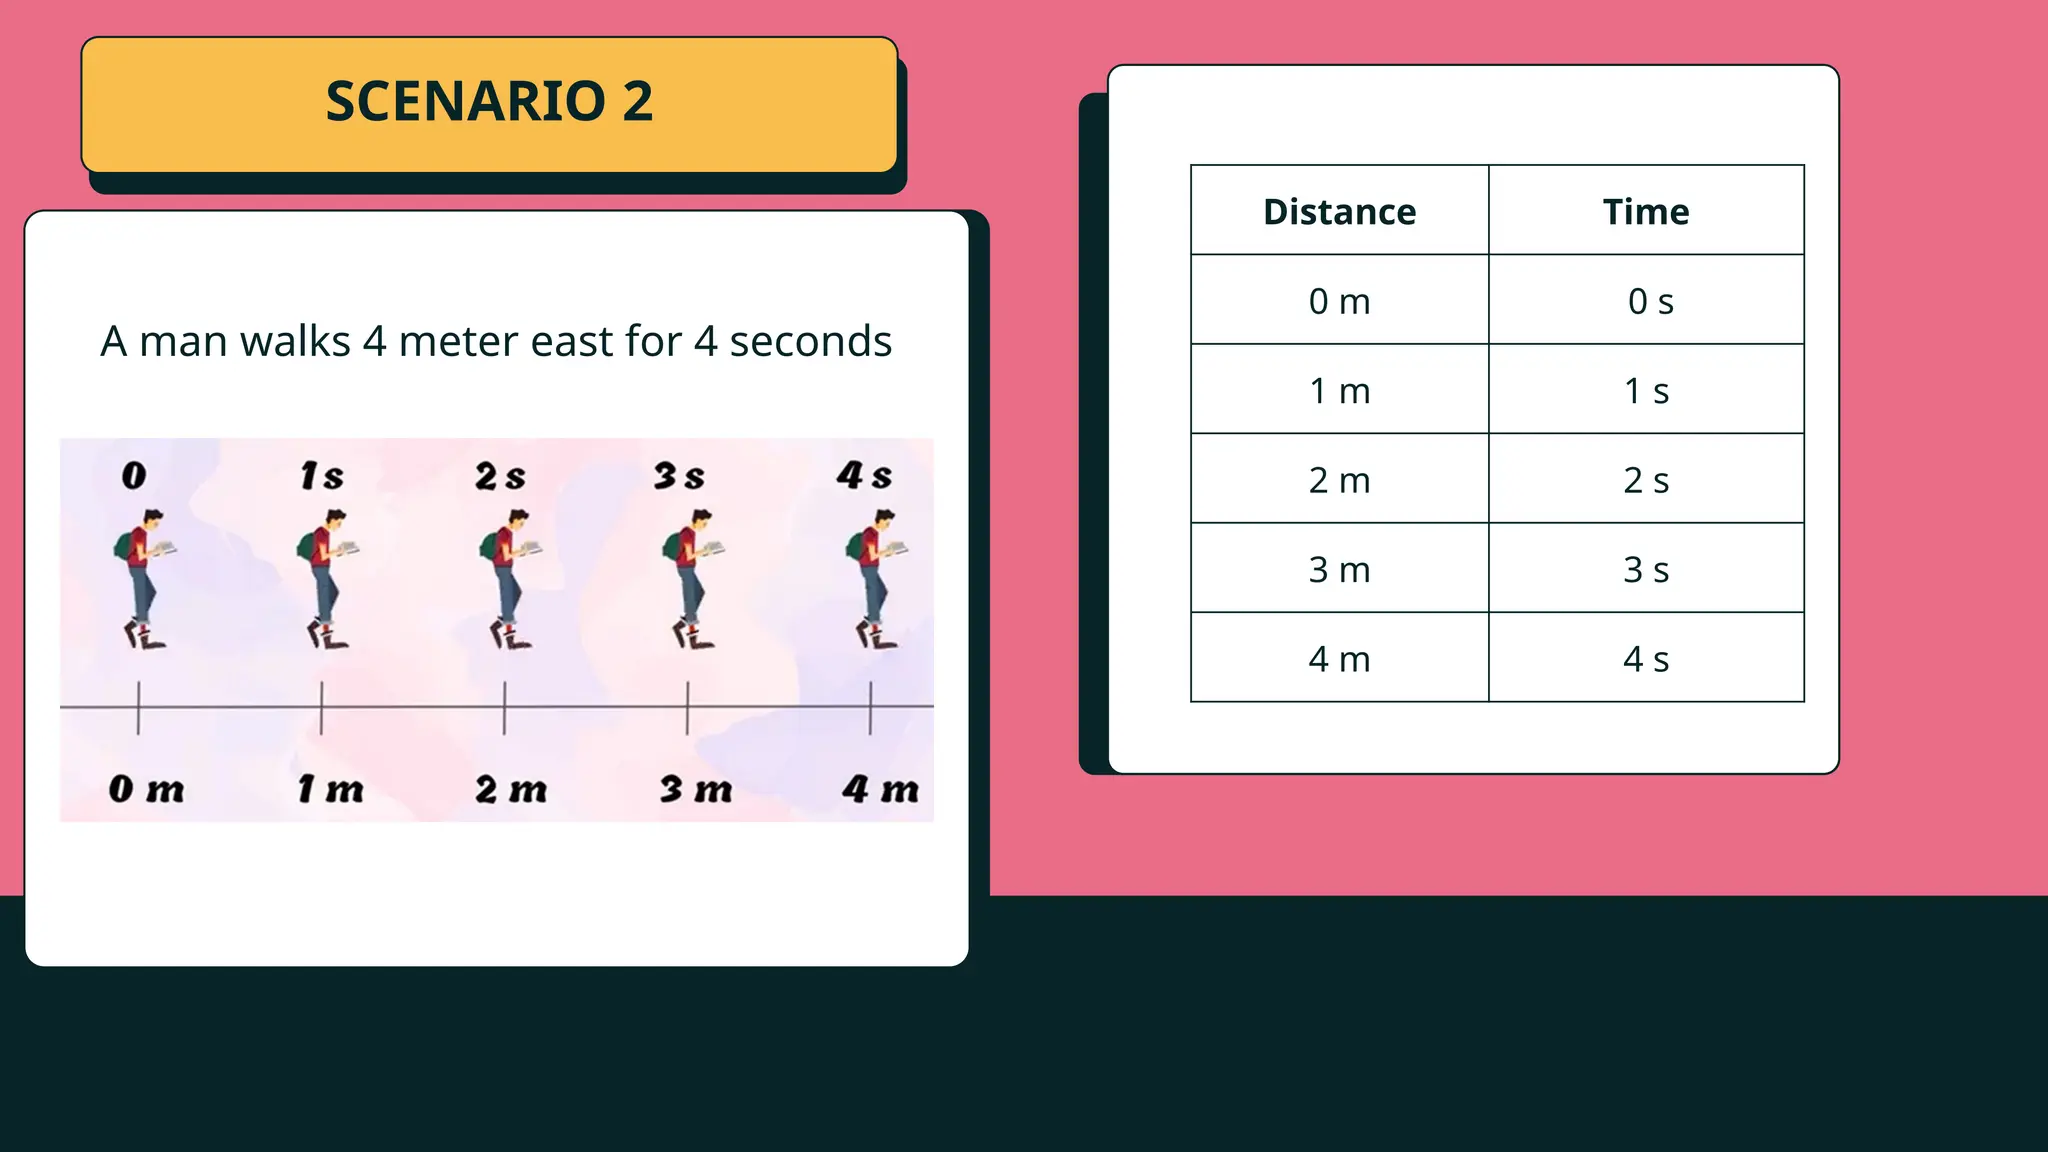
SCENARIO 2
A manwalks 4 meter east for 4 seconds
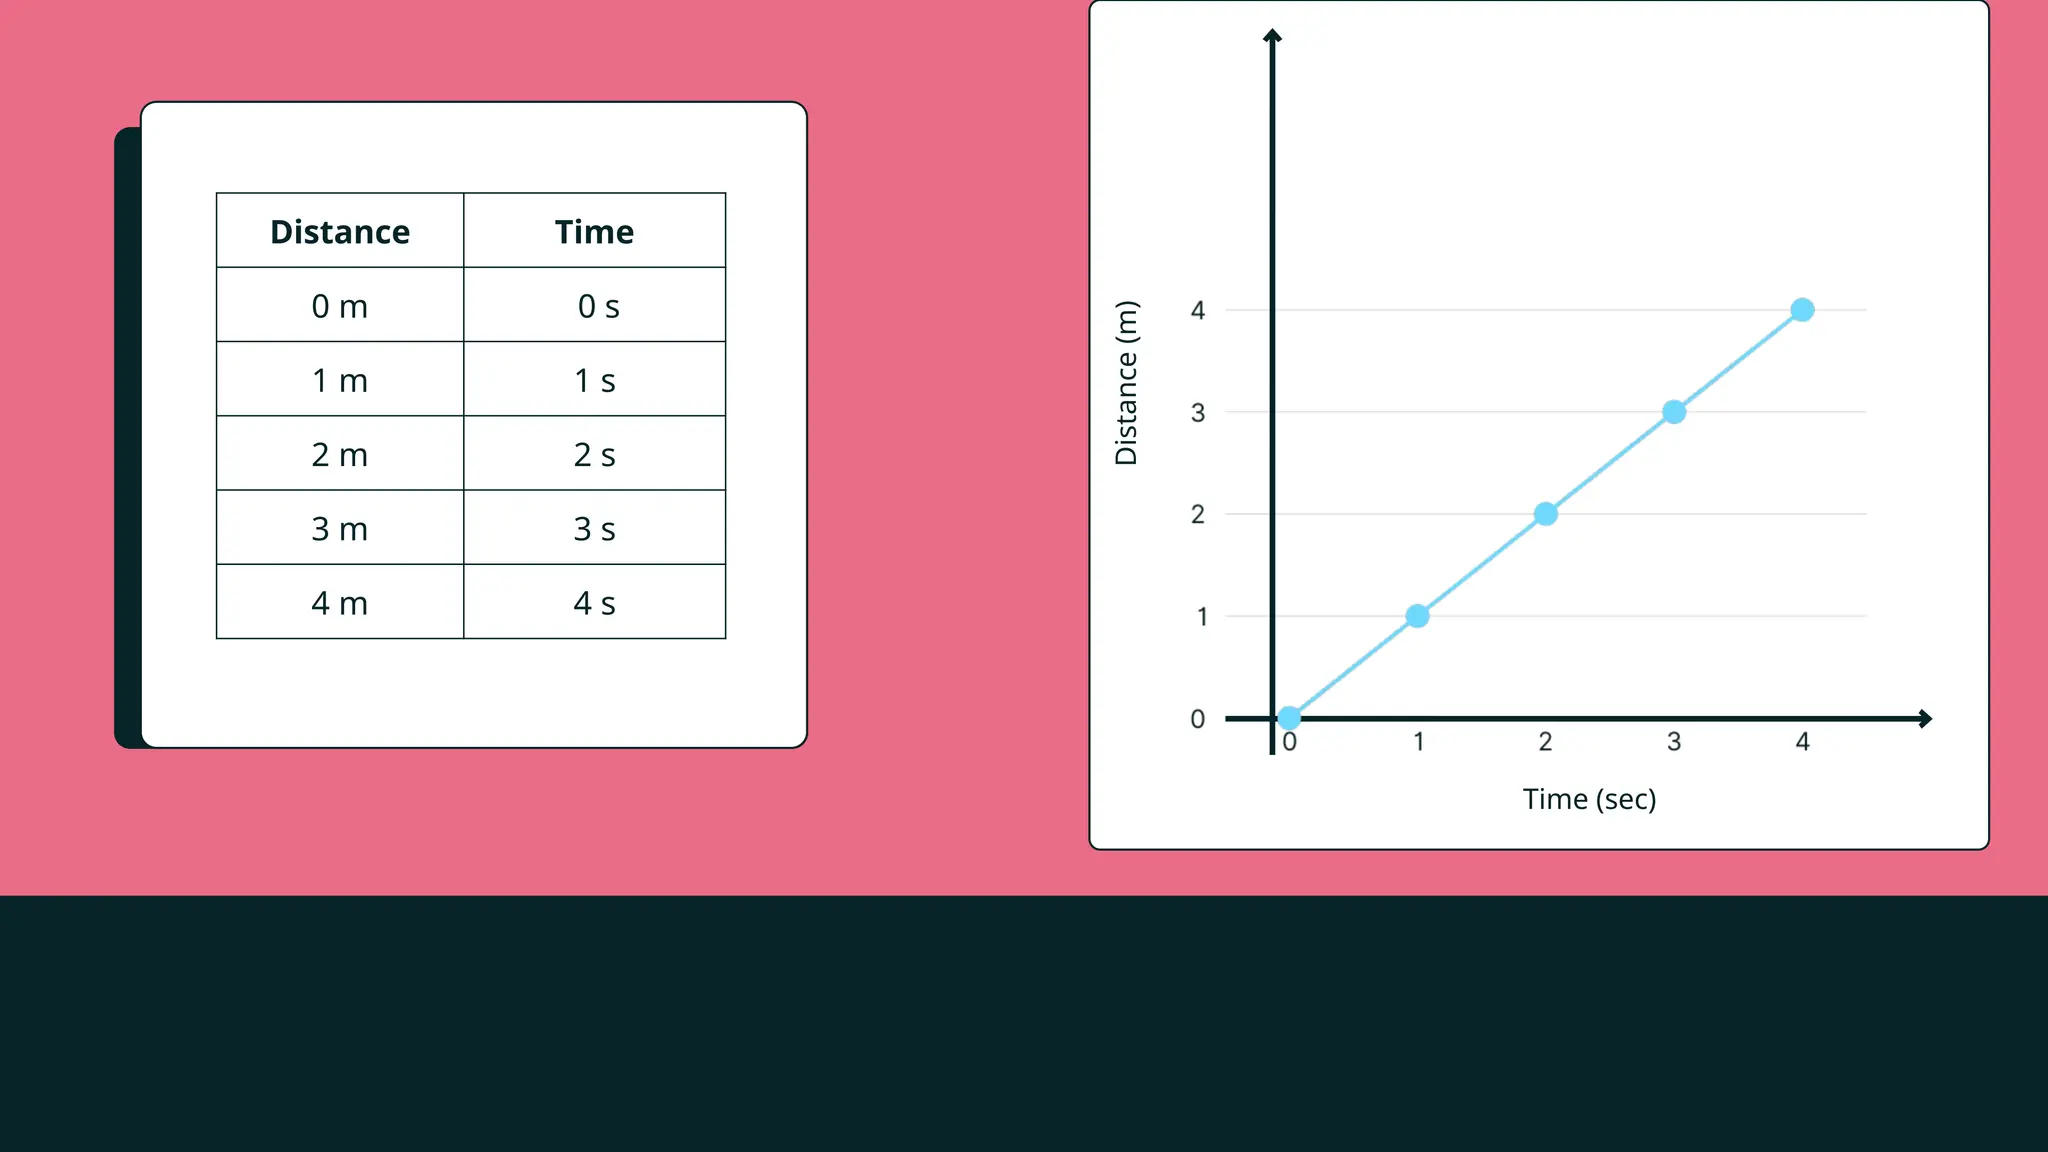
Distance Time
0 m 0 s
1 m 1 s
2 m 2 s
3 m 3 s
4 m 4 s
11.
Distance Time
0 m0 s
1 m 1 s
2 m 2 s
3 m 3 s
4 m 4 s
Time (sec)
Distance
(m)
12.
Time (sec)
Distance
(m)
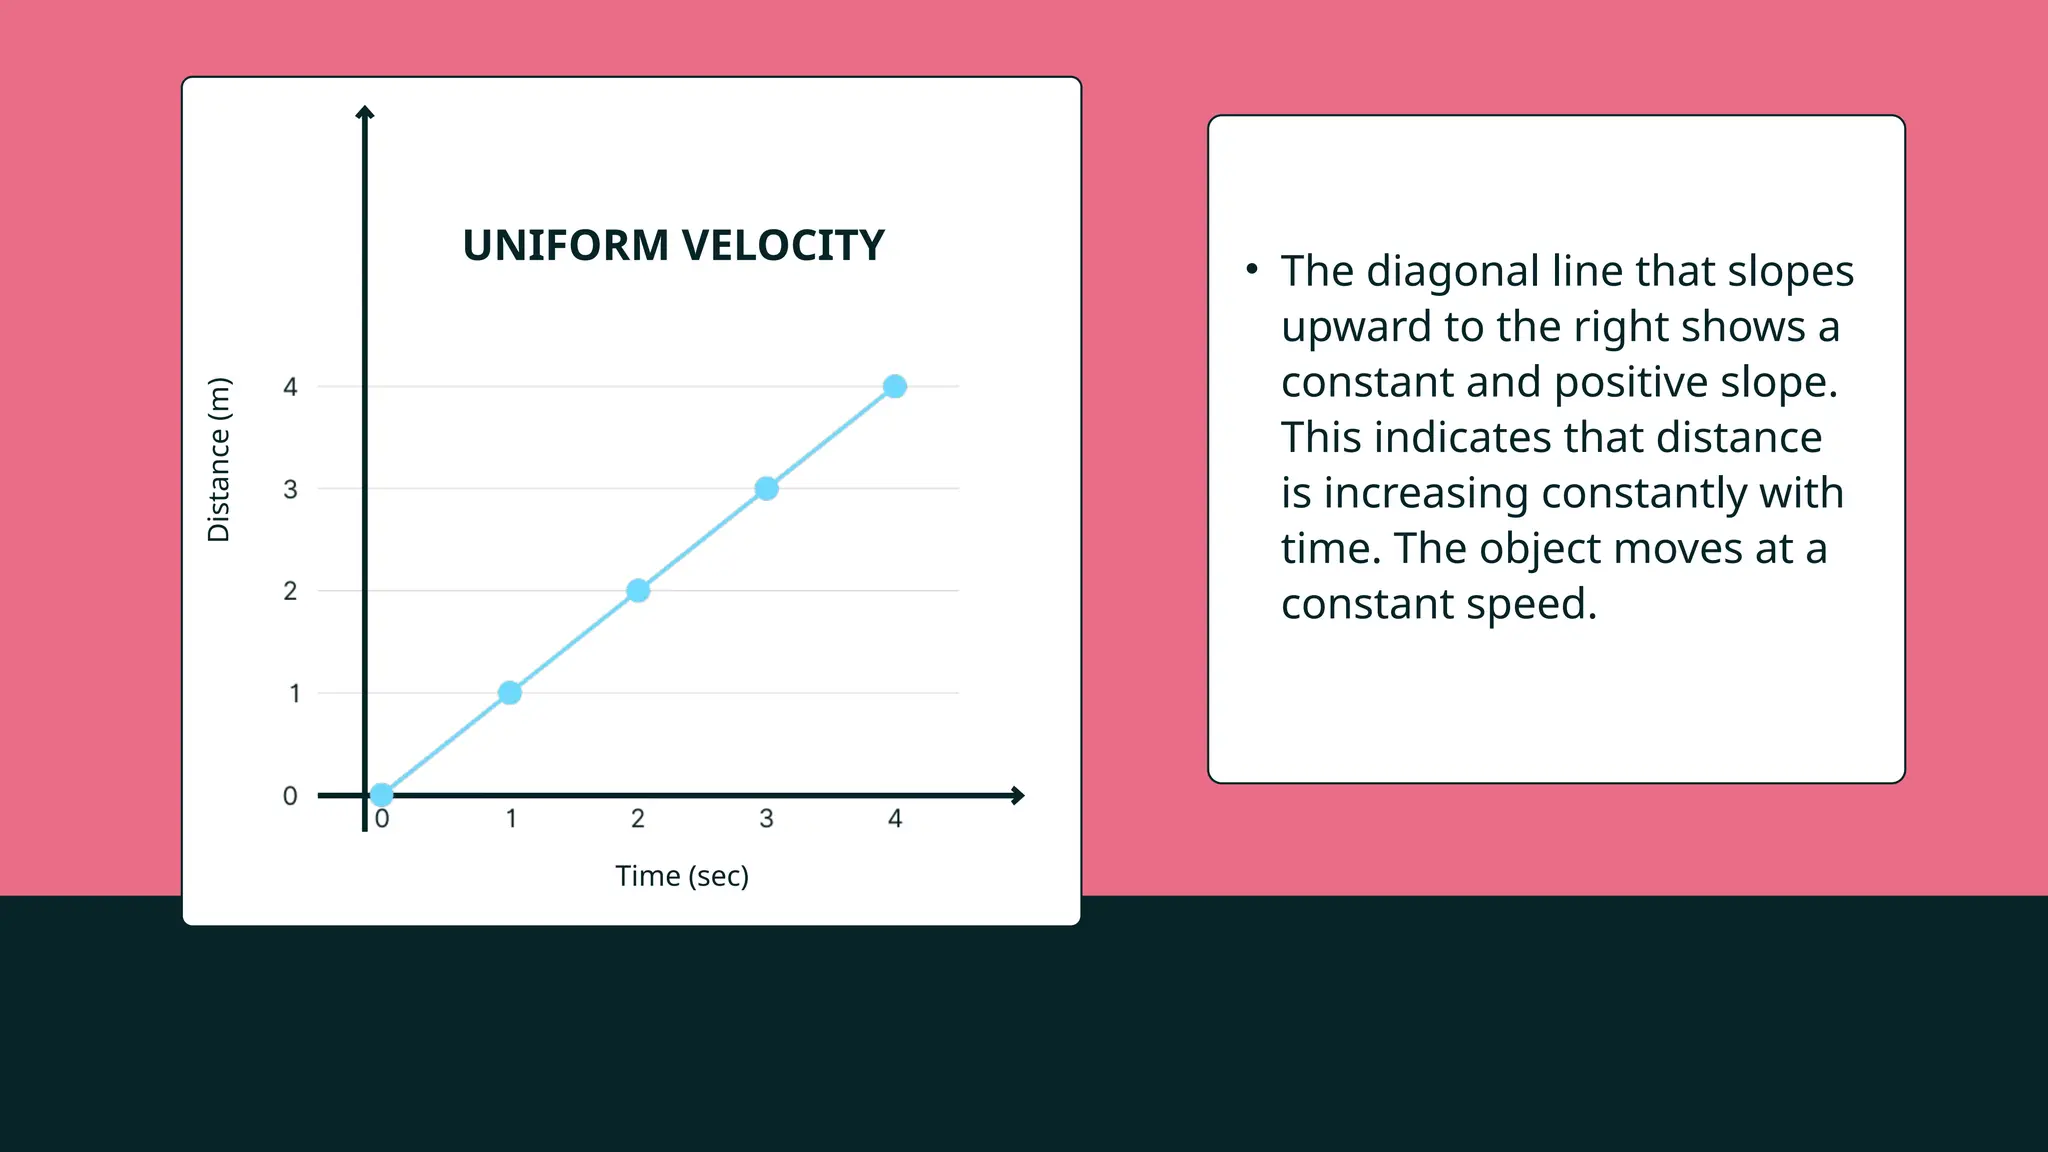
• Thediagonal line that slopes
upward to the right shows a
constant and positive slope.
This indicates that distance
is increasing constantly with
time. The object moves at a
constant speed.
UNIFORM VELOCITY
13.
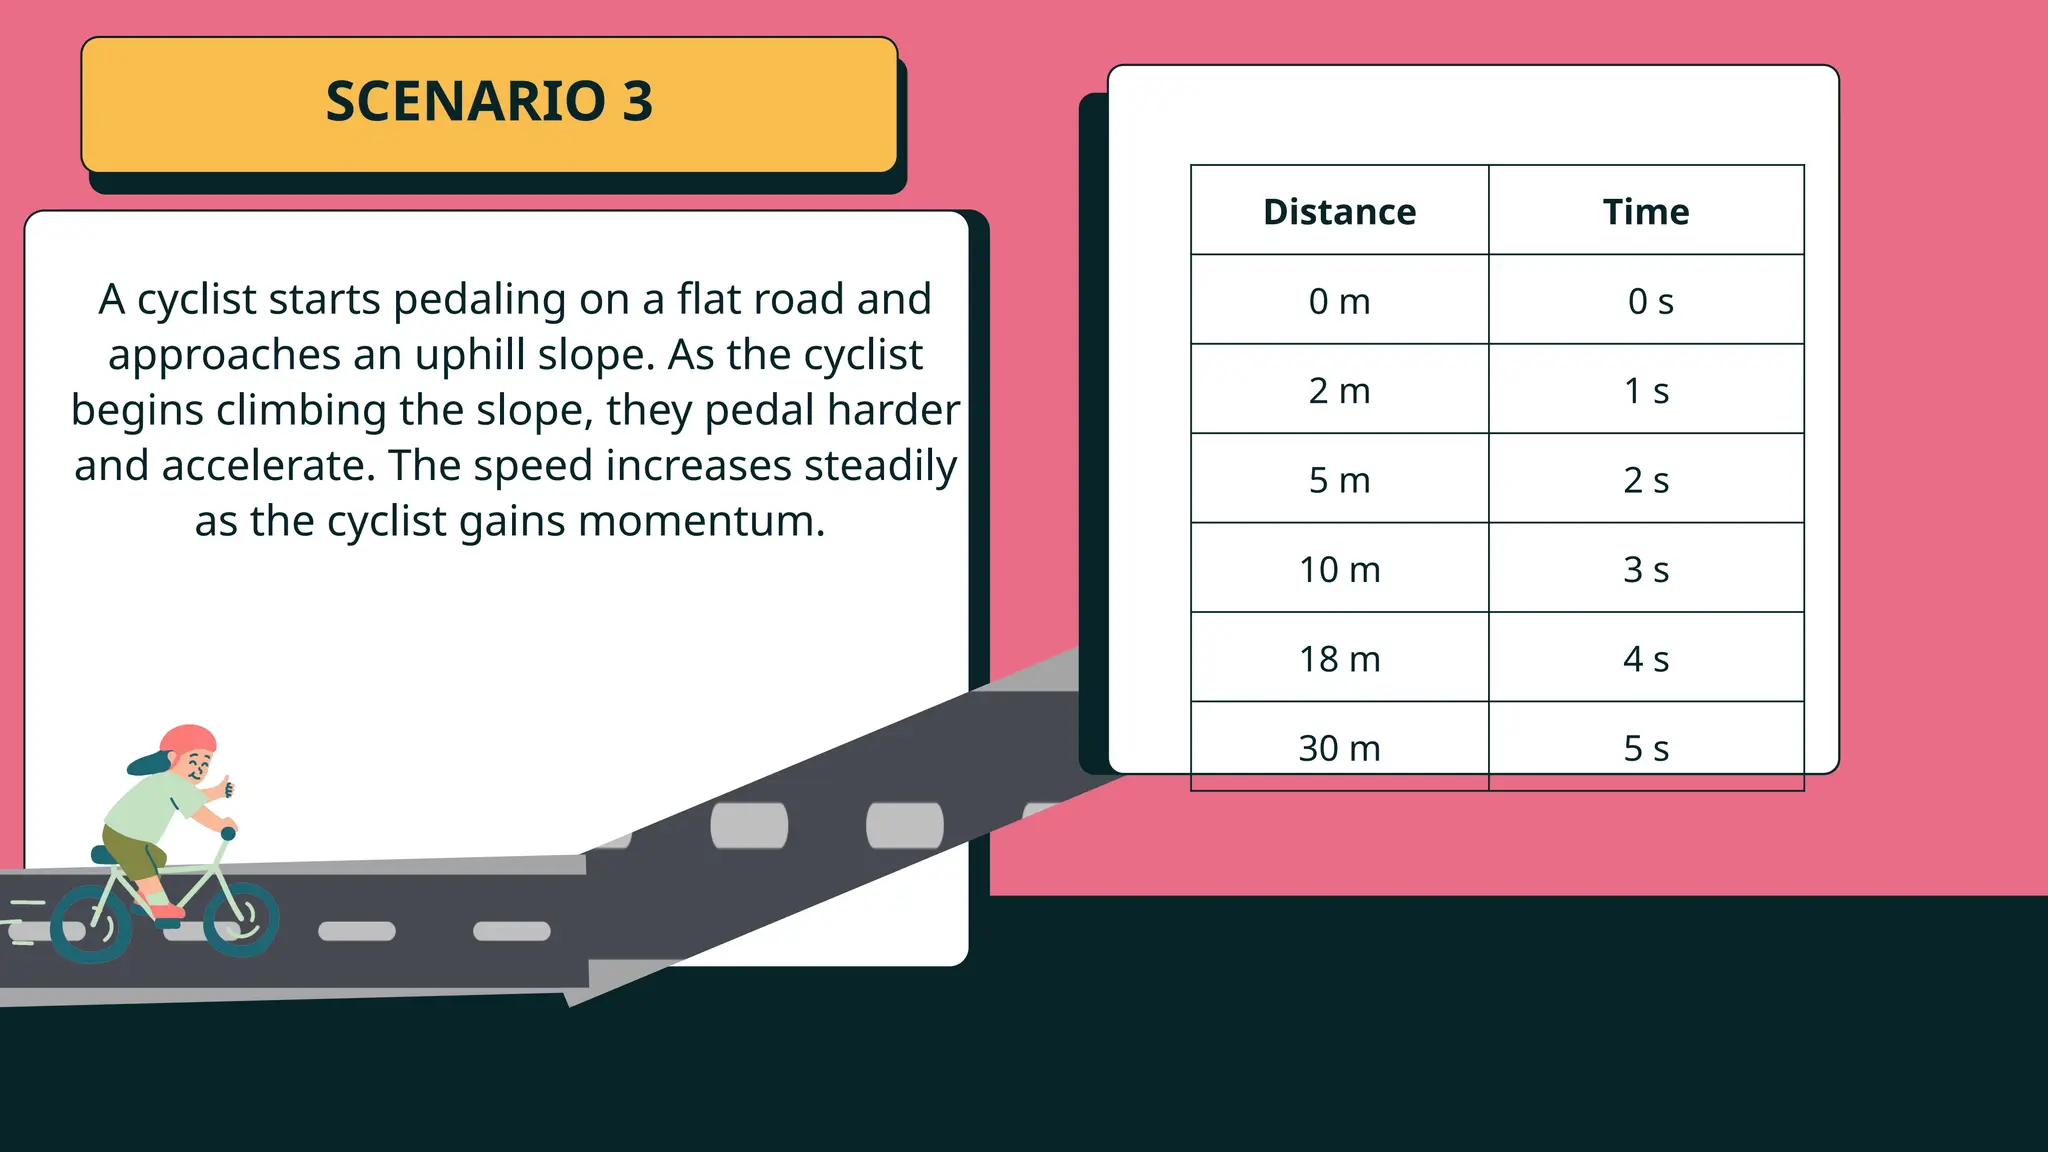
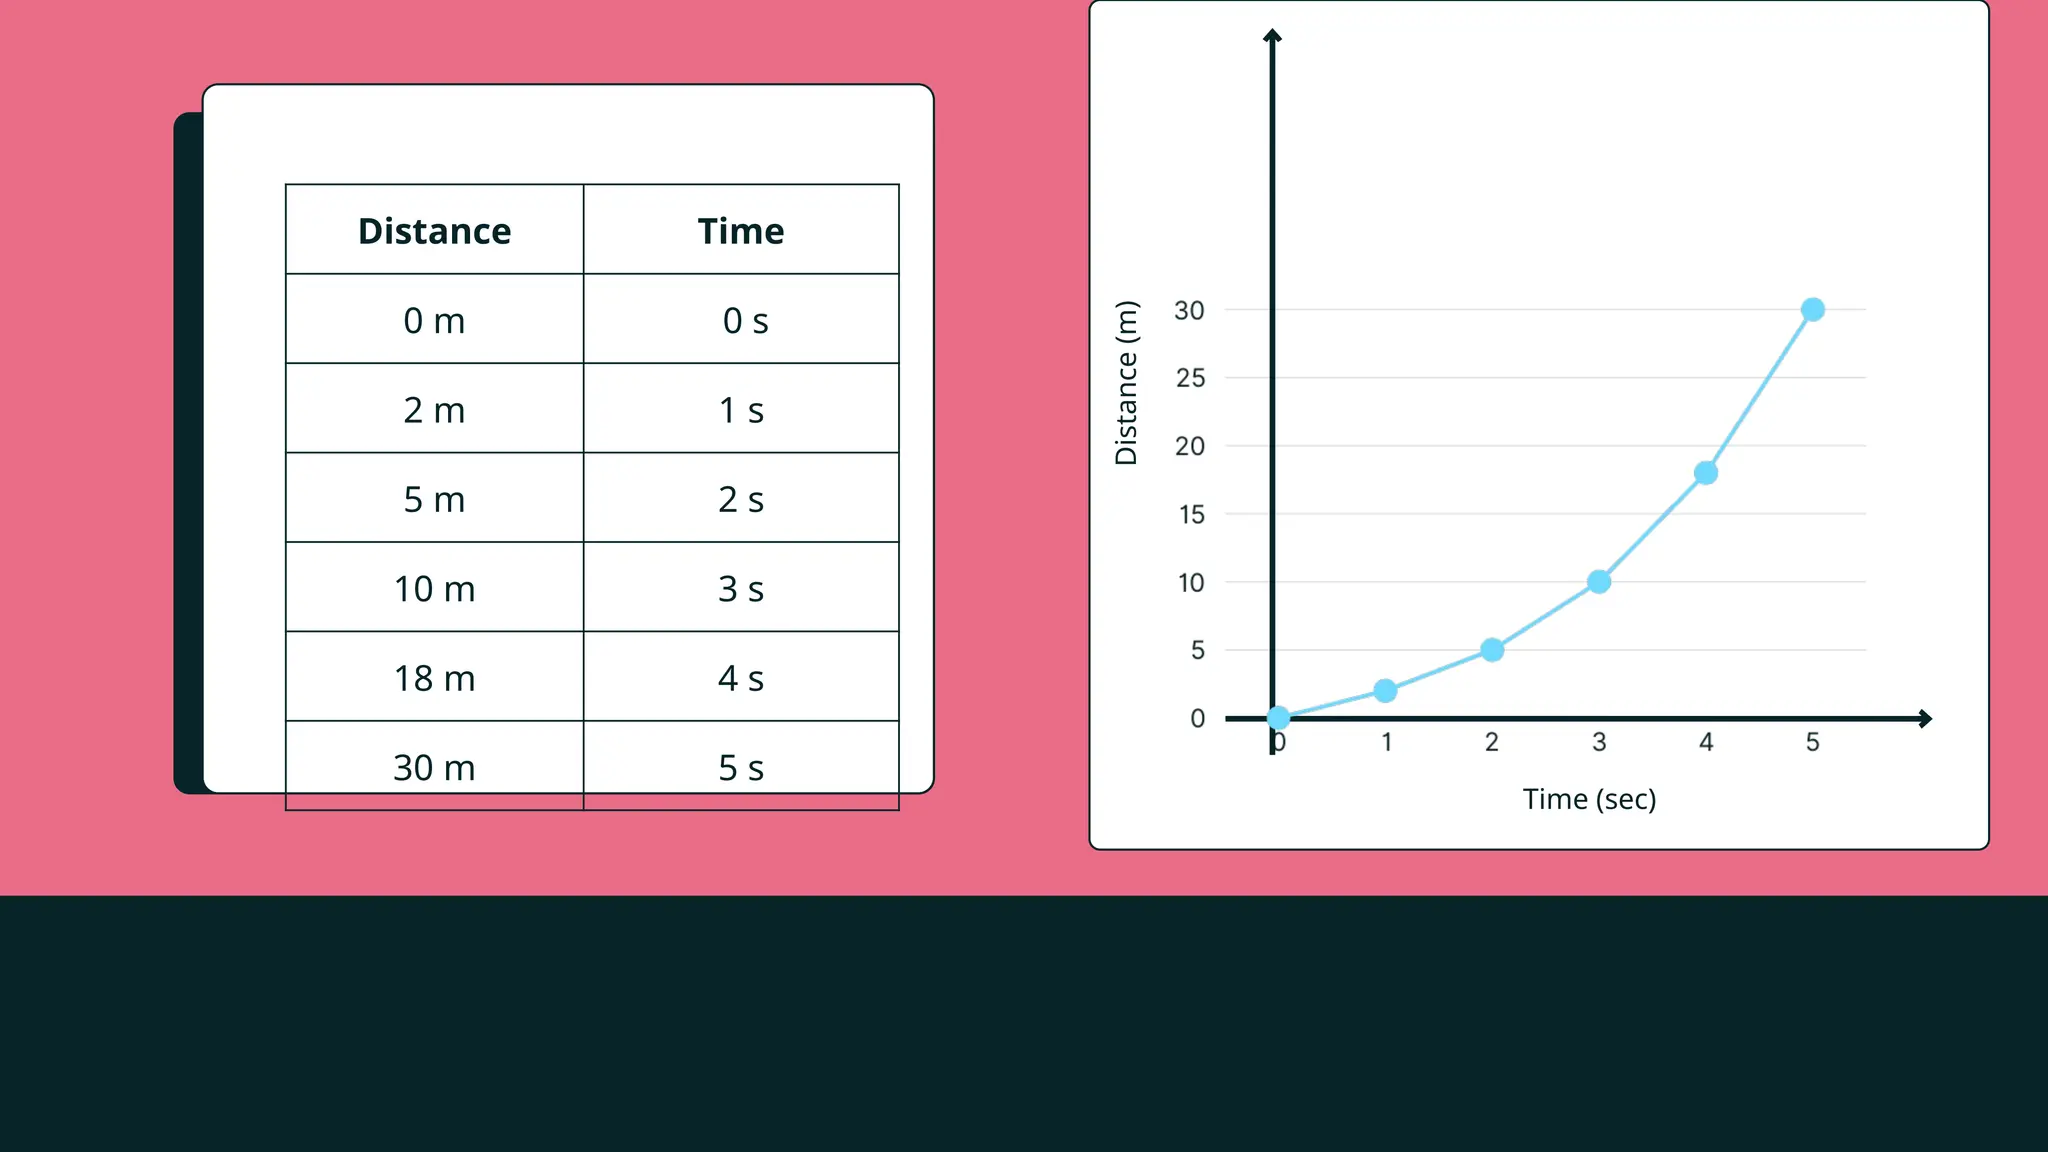
SCENARIO 3
Distance Time
0m 0 s
2 m 1 s
5 m 2 s
10 m 3 s
18 m 4 s
30 m 5 s
A cyclist starts pedaling on a flat road and
approaches an uphill slope. As the cyclist
begins climbing the slope, they pedal harder
and accelerate. The speed increases steadily
as the cyclist gains momentum.
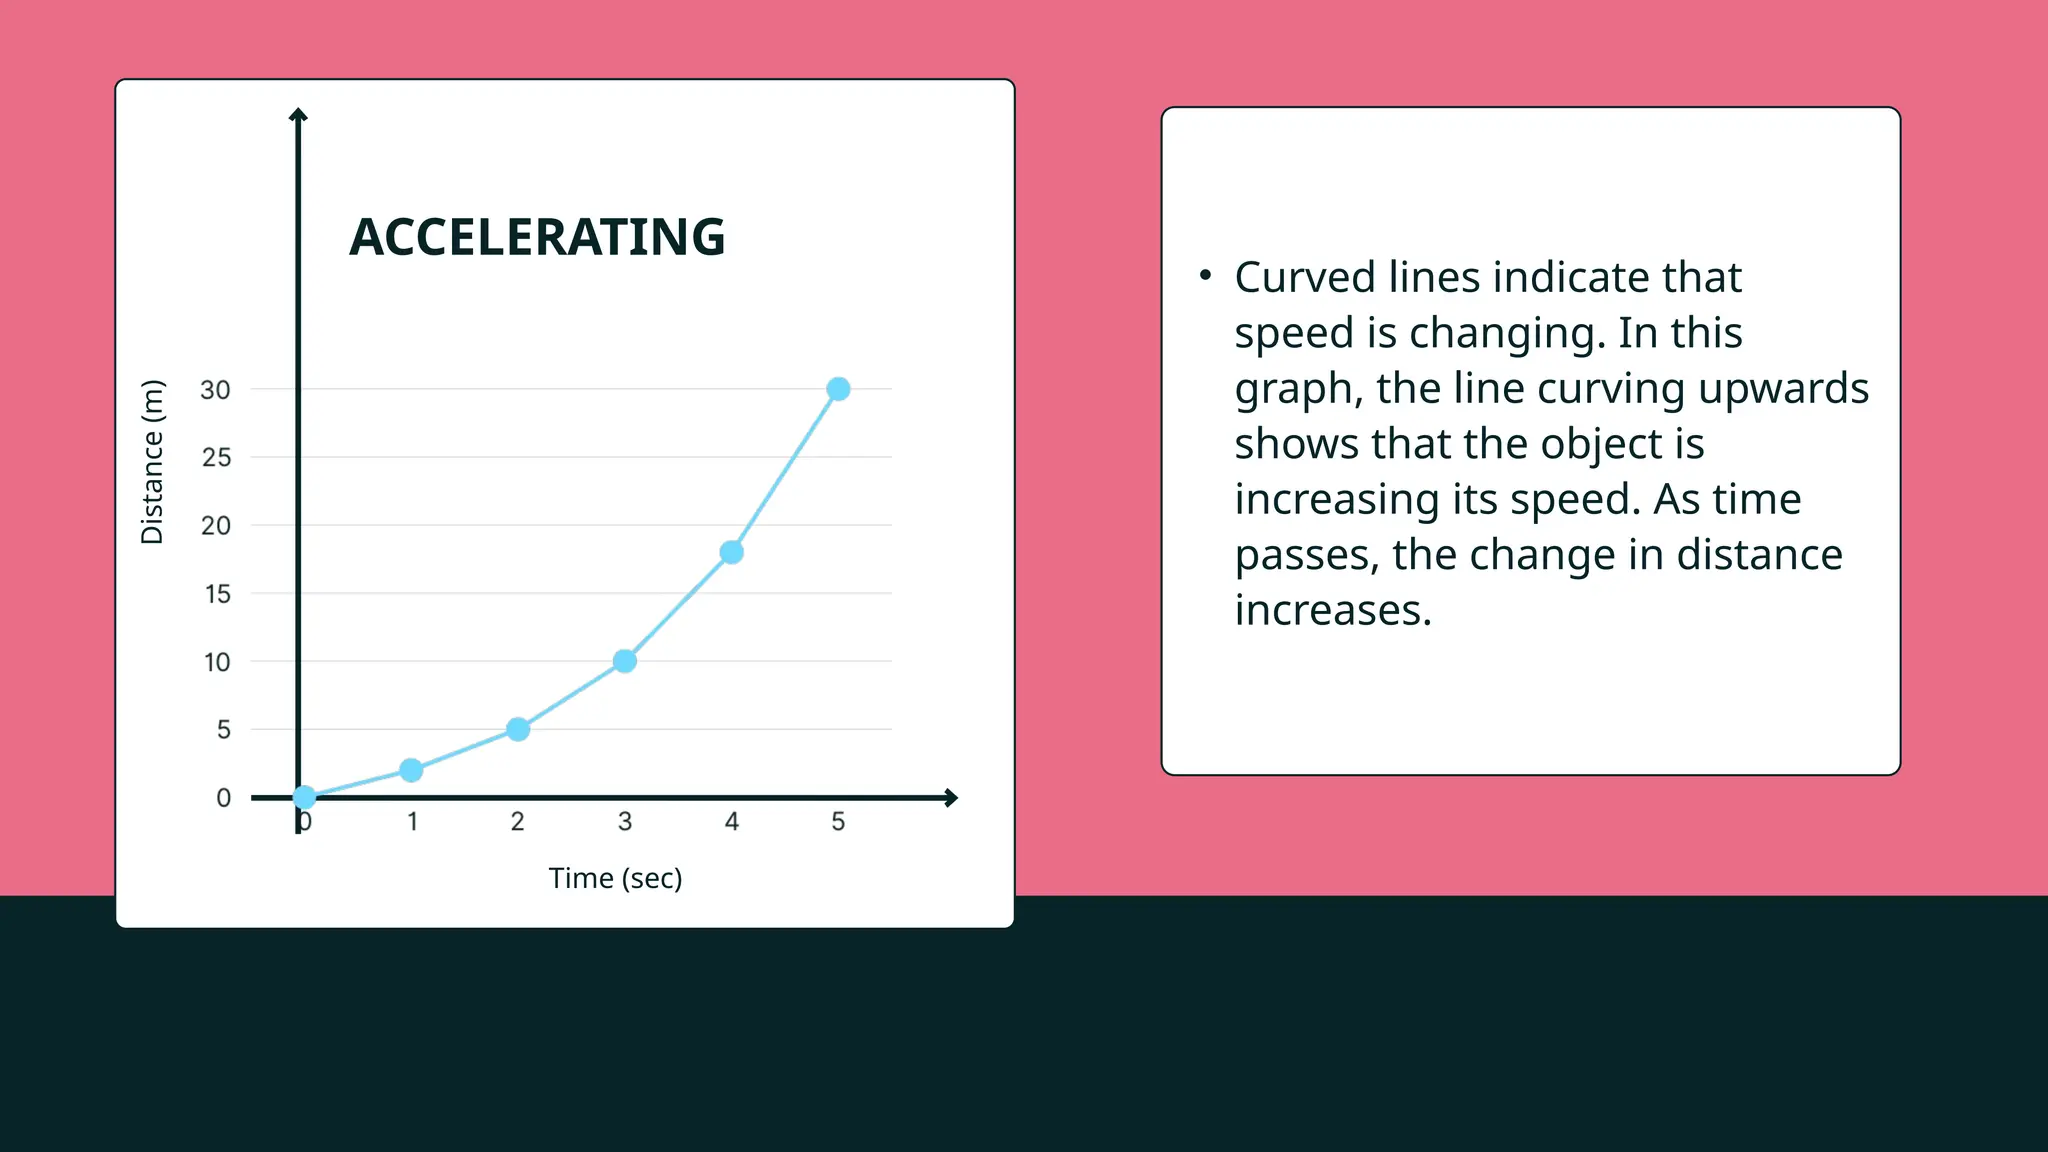
Time (sec)
Distance
(m)
• Curvedlines indicate that
speed is changing. In this
graph, the line curving upwards
shows that the object is
increasing its speed. As time
passes, the change in distance
increases.
ACCELERATING
16.
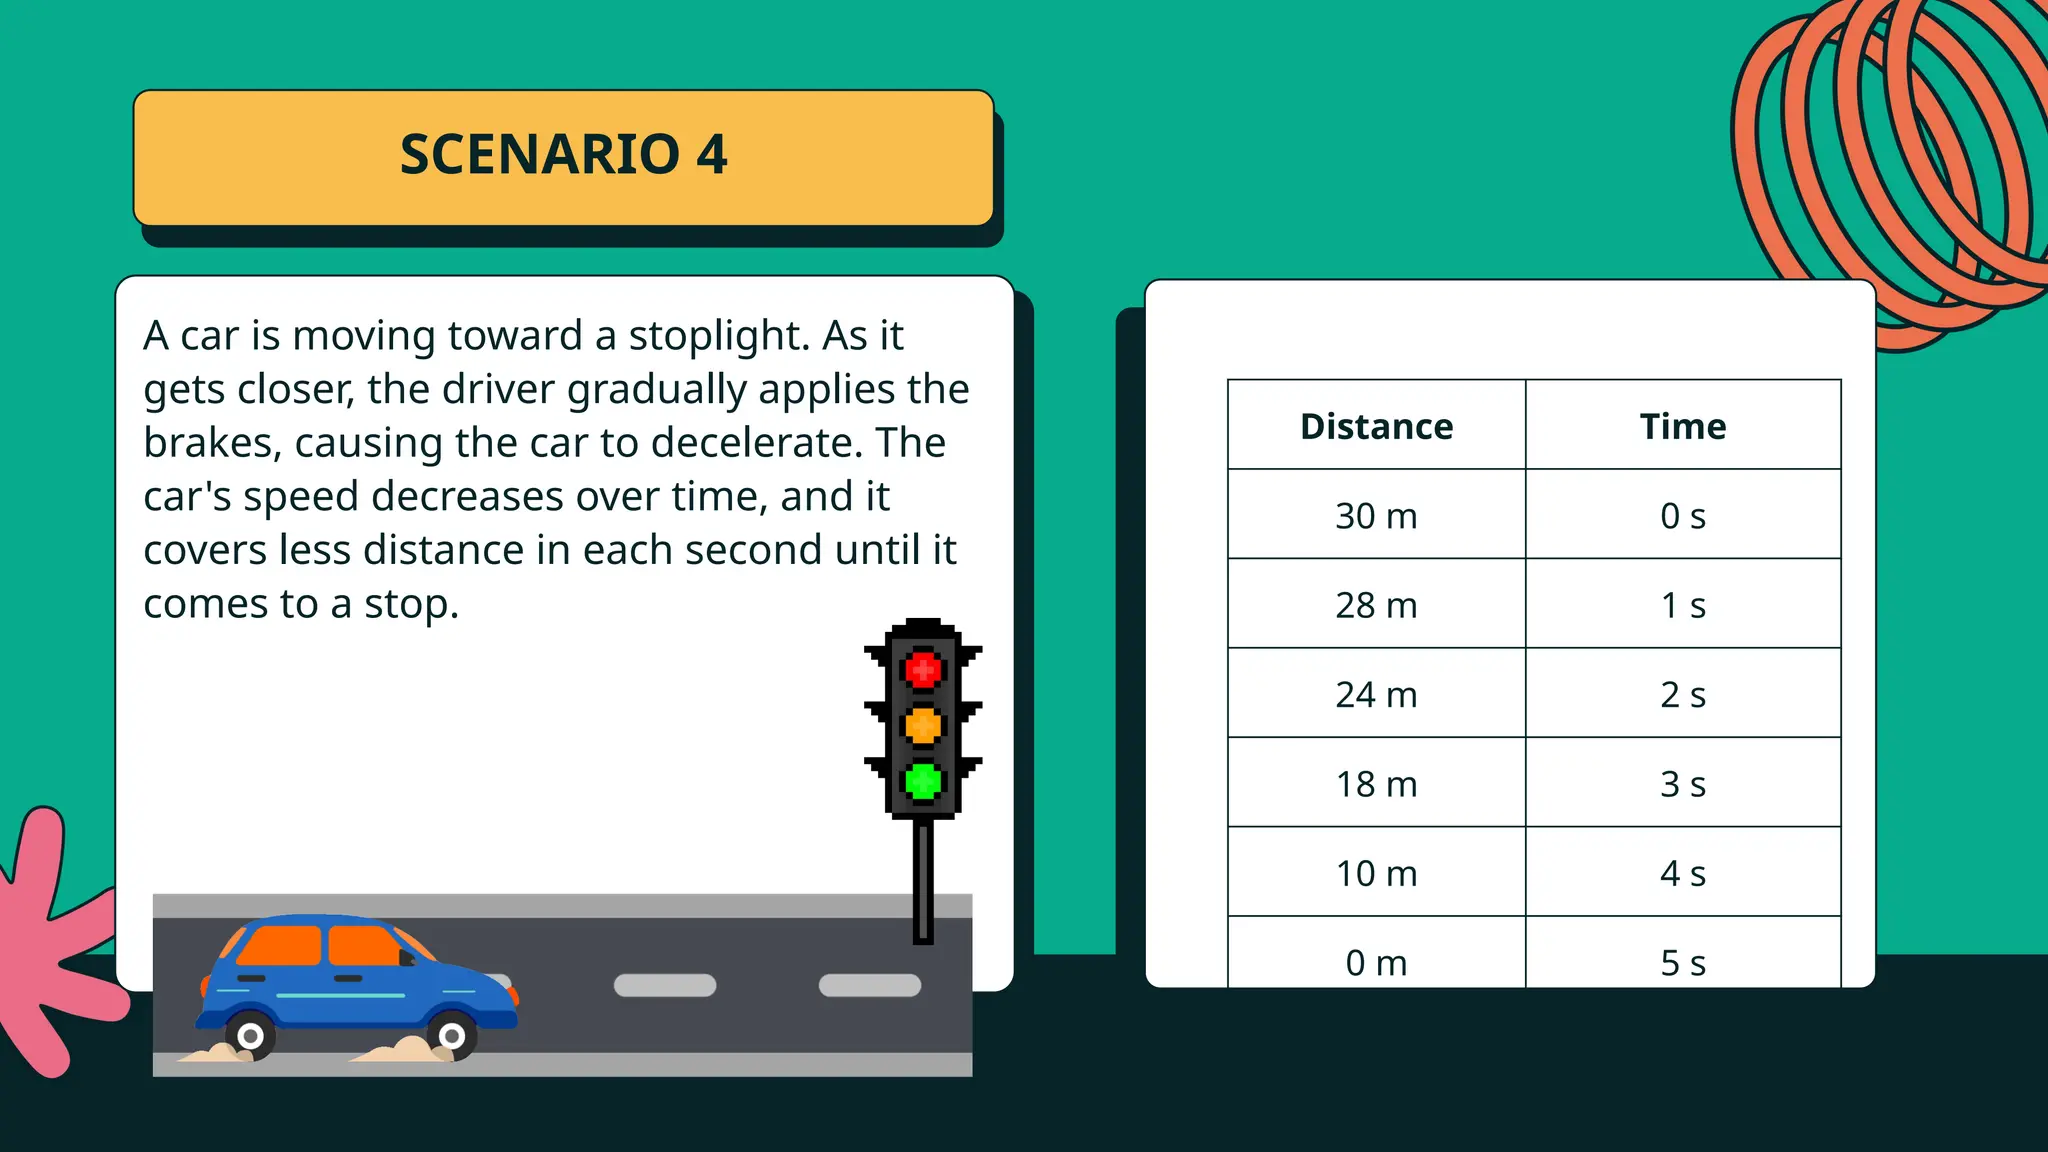
SCENARIO 4
Time
Distance Time
30m 0 s
28 m 1 s
24 m 2 s
18 m 3 s
10 m 4 s
0 m 5 s
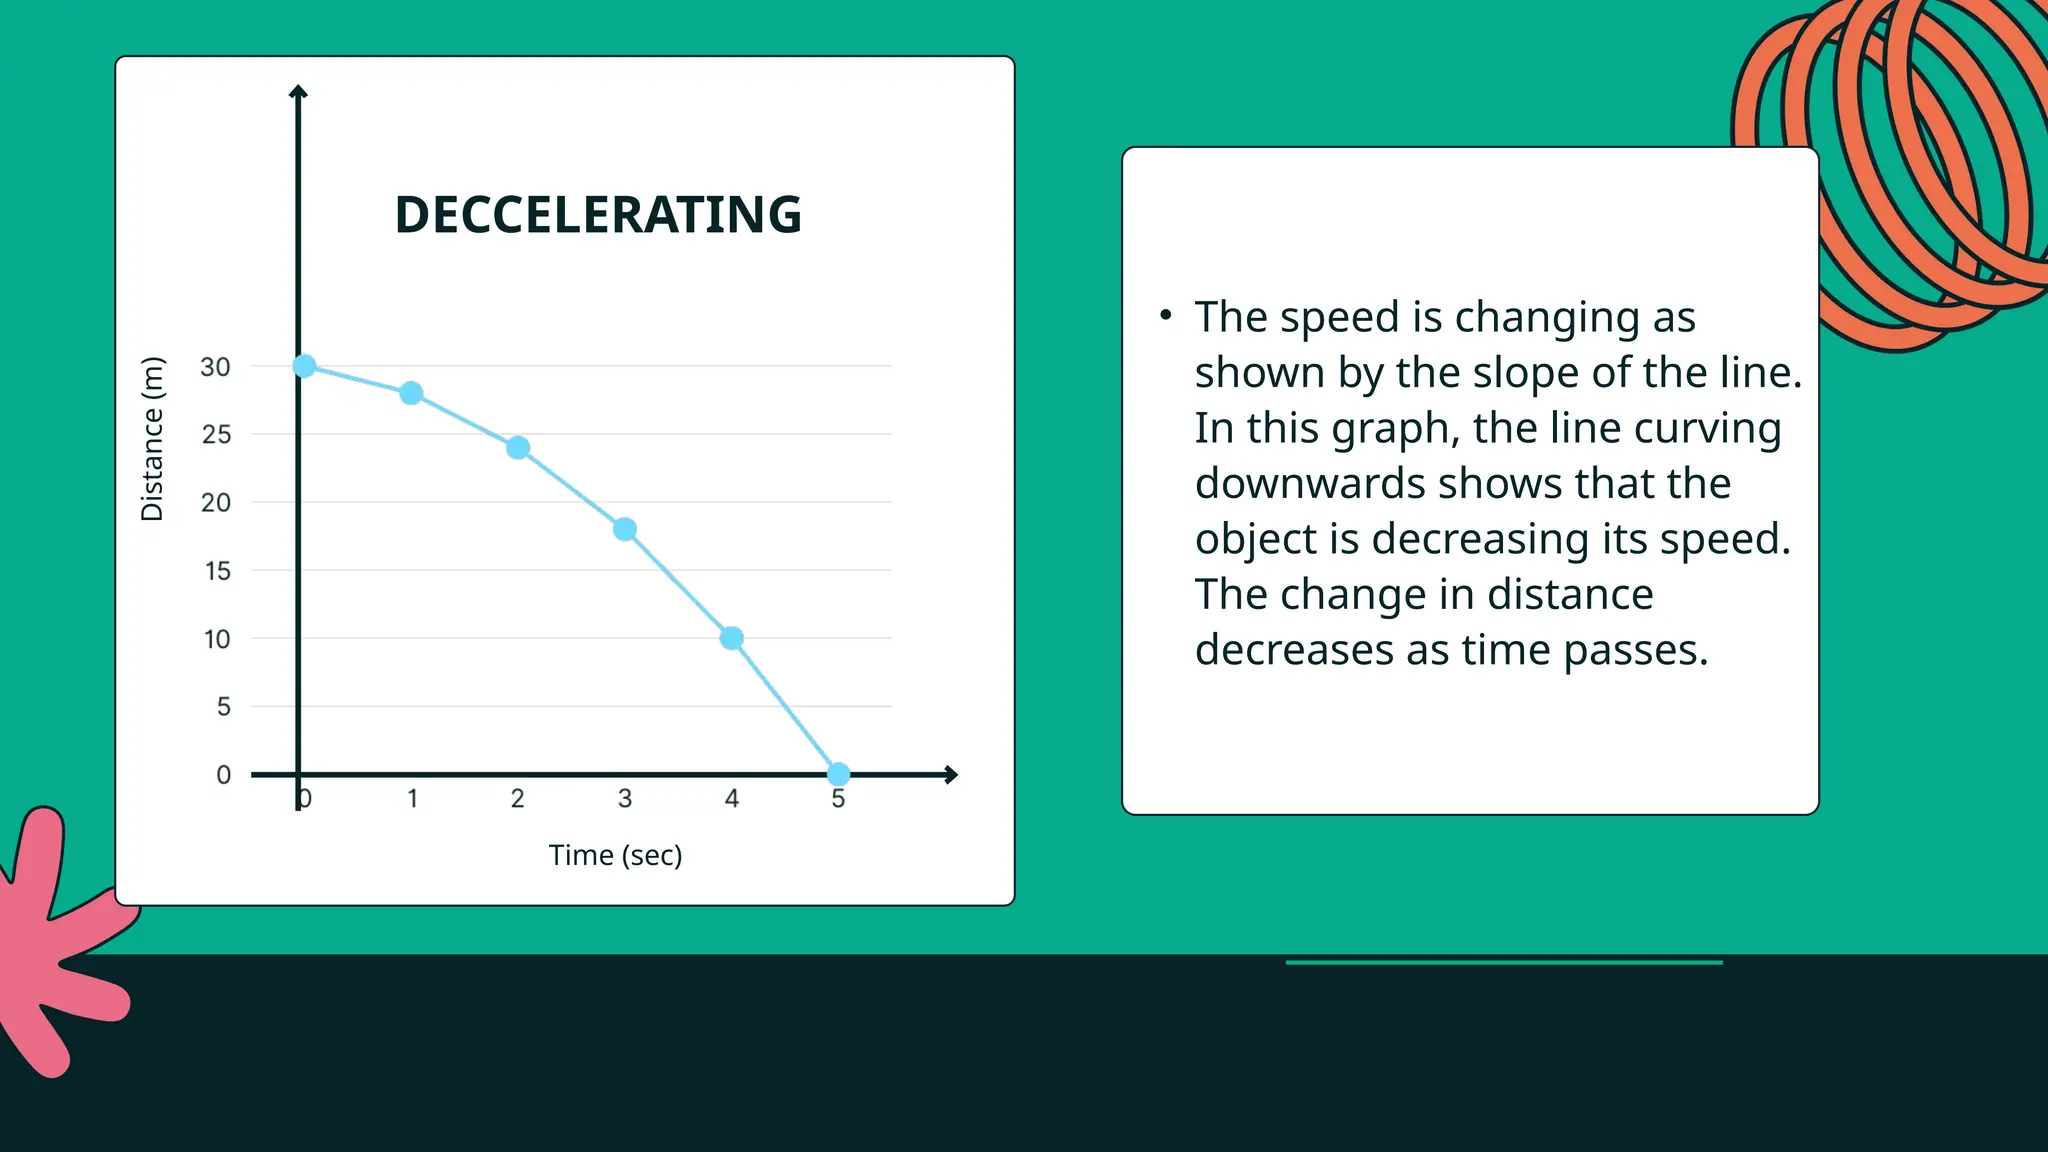
A car is moving toward a stoplight. As it
gets closer, the driver gradually applies the
brakes, causing the car to decelerate. The
car's speed decreases over time, and it
covers less distance in each second until it
comes to a stop.
Time
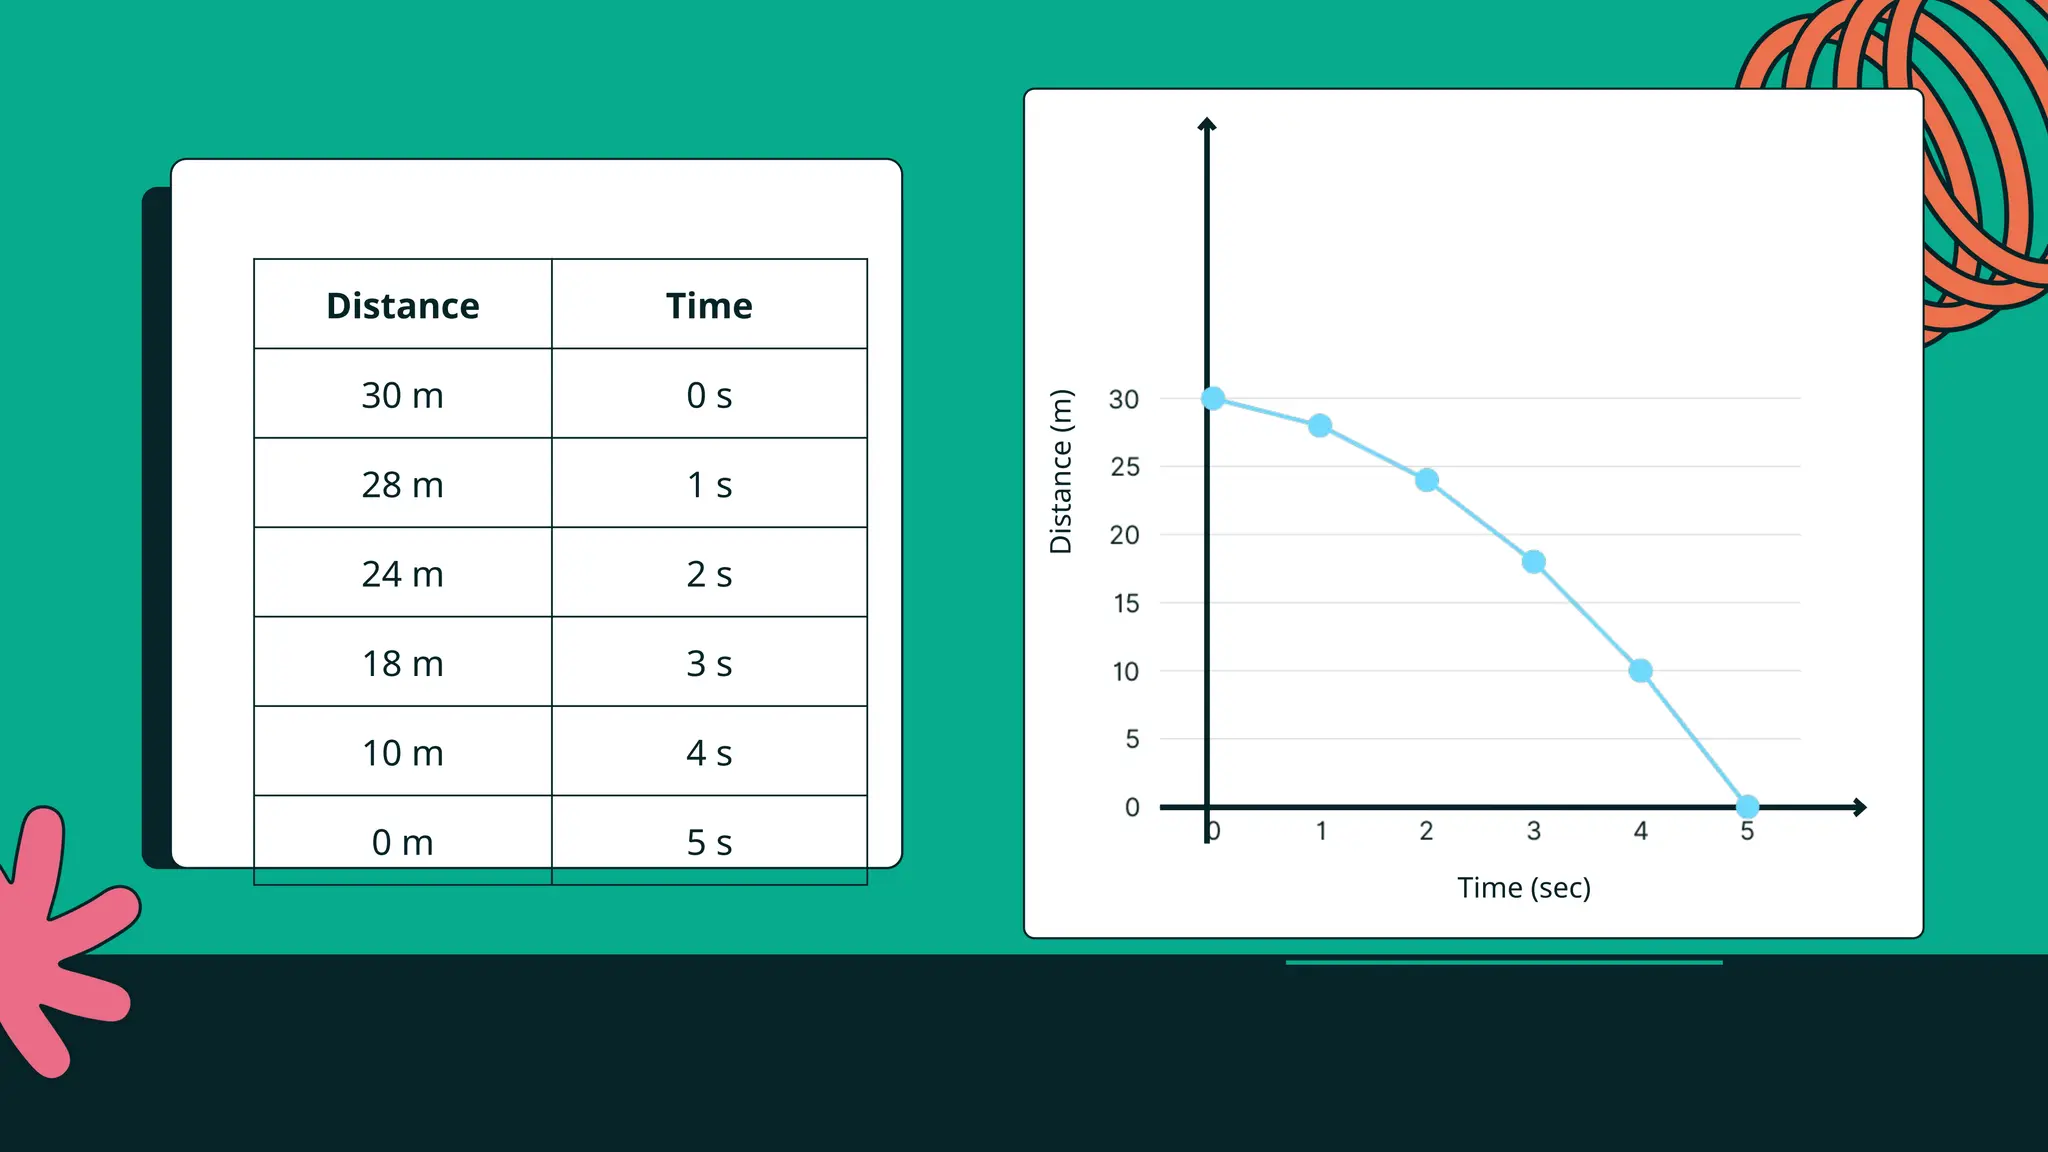
Time (sec)
Distance
(m)
• Thespeed is changing as
shown by the slope of the line.
In this graph, the line curving
downwards shows that the
object is decreasing its speed.
The change in distance
decreases as time passes.
DECCELERATING
19.
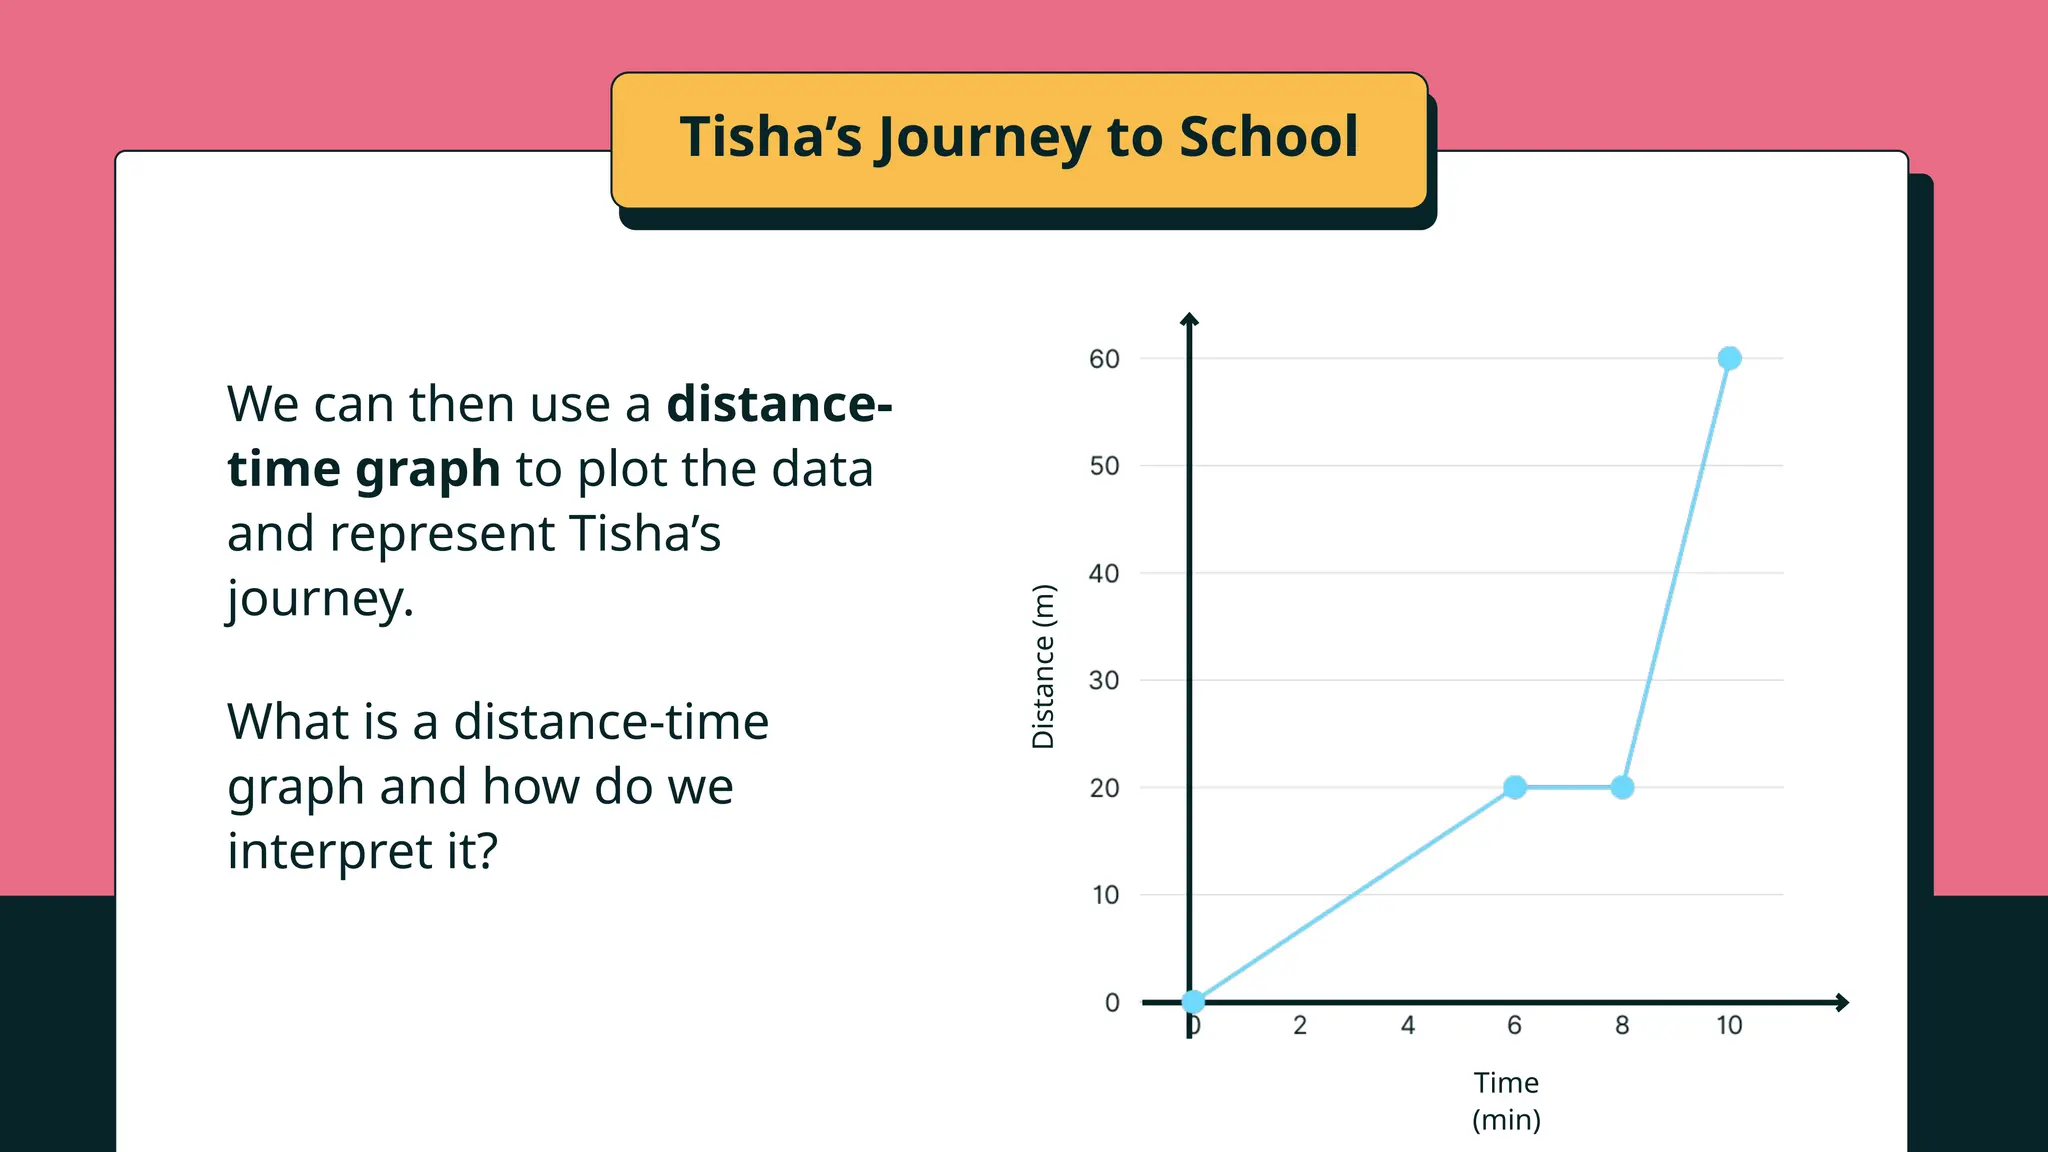
Tisha’s Journey toSchool
Tisha left home and walked at a constant speed for
the first 6 minutes, covering 20 meters. She saw her
best friend, and they stopped at a corner shop for 2
minutes. They realised they would be late for their
class and decided to walk at a constant speed,
covering 60 meters in just 2 minutes.
How can you oganise the given details and model
the change in Tisha’s positions over time?
20.
Tisha’s Journey toSchool
We can start by highlighting the details from Tisha’s journey and
organising them in a table format.
Time elapsed
(min)
Distance (m) from
the starting point
Description
0 0 At home
6 20 Walking at a constant speed
8 20 Stopping and chatting with her best friend
10 60 Walking briskly but at a constant speed
21.
We can thenuse a distance-
time graph to plot the data
and represent Tisha’s
journey.
What is a distance-time
graph and how do we
interpret it?
Time
(min)
Distance
(m)
Tisha’s Journey to School
22.
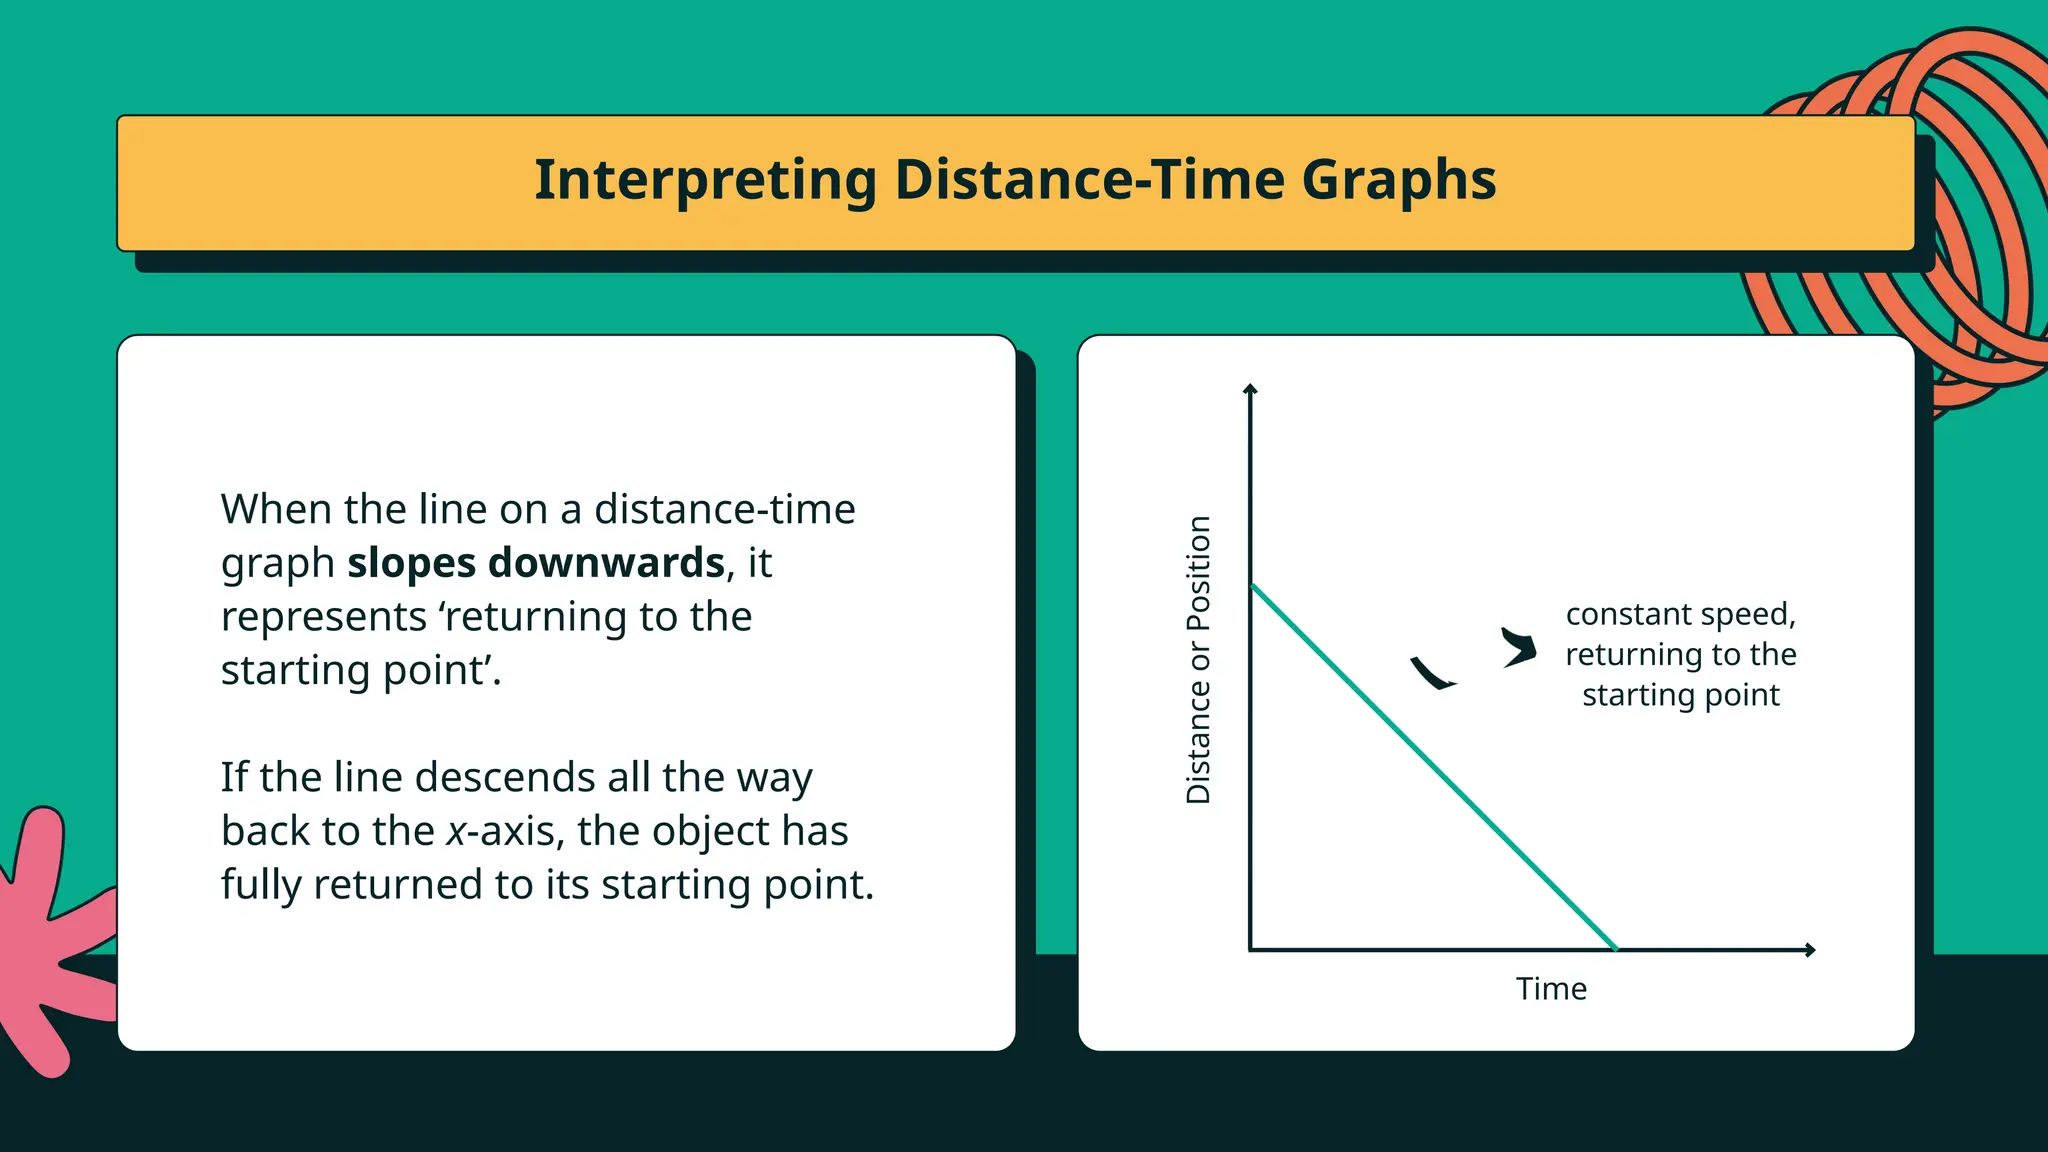
Interpreting Distance-Time Graphs
Time
Distance
or
Position
slope
constantspeed
The gradient of the line (or slope)
on a distance-time graph tells us
about the speed of the object.
A straight diagonal line means
the object is travelling at a constant
speed.
The steeper the slope, the faster
the object is moving.
23.
Interpreting Distance-Time Graphs
Time
Distance
or
Position
slope
constantspeed
The gradient of the line (or slope)
on a distance-time graph tells us
about the speed of the object.
A straight diagonal line means
the object is travelling at a constant
speed.
The steeper the slope, the faster
the object is moving.
24.
Time
Distance
or
Position
constant speed,
returning tothe
starting point
When the line on a distance-time
graph slopes downwards, it
represents ‘returning to the
starting point’.
If the line descends all the way
back to the x-axis, the object has
fully returned to its starting point.
Interpreting Distance-Time Graphs
25.
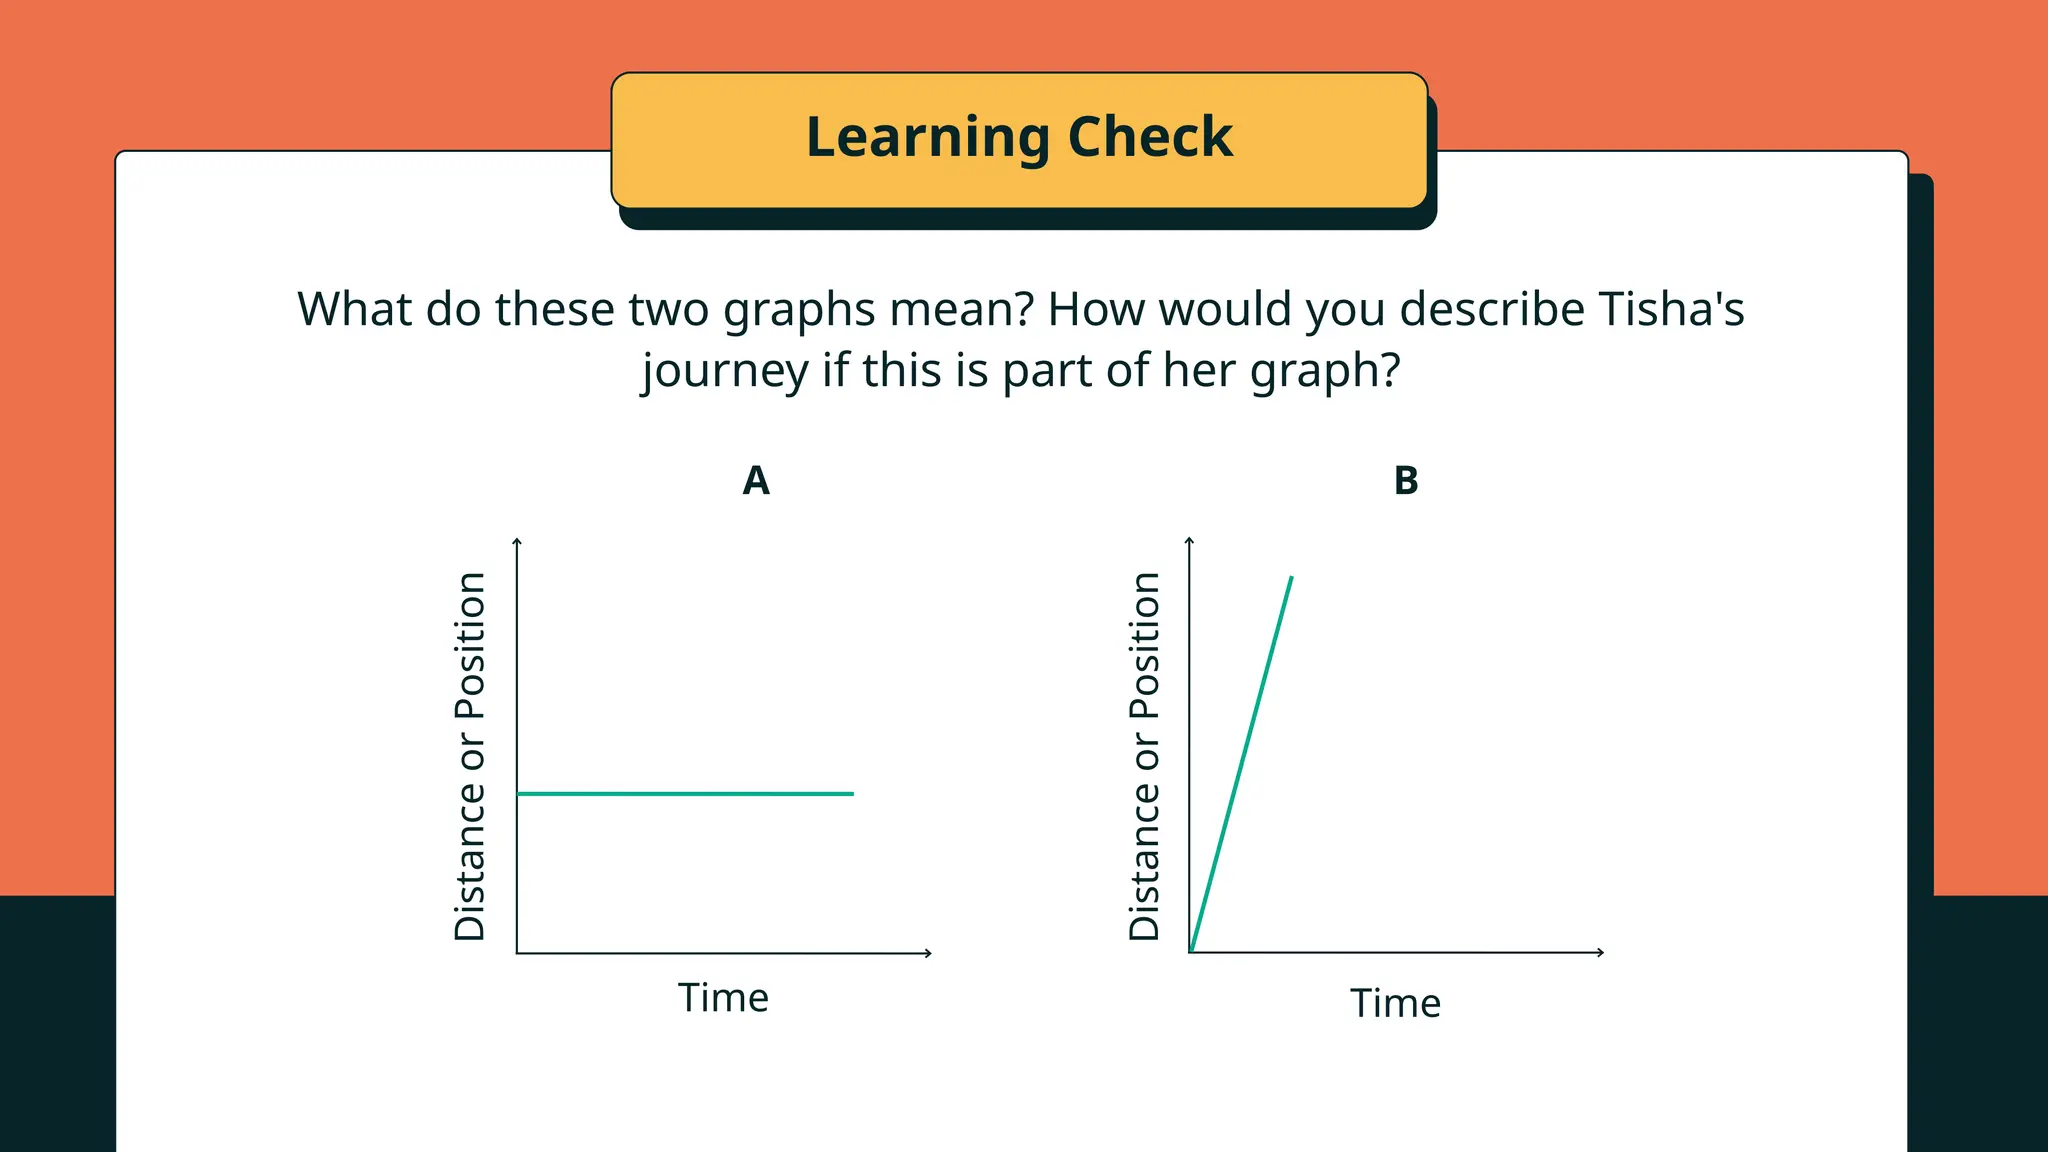
Learning Check
What dothese two graphs mean? How would you describe Tisha's
journey if this is part of her graph?
Time
Distance
or
Position
Time
Distance
or
Position
A B
26.
Answer Key
Learning Check
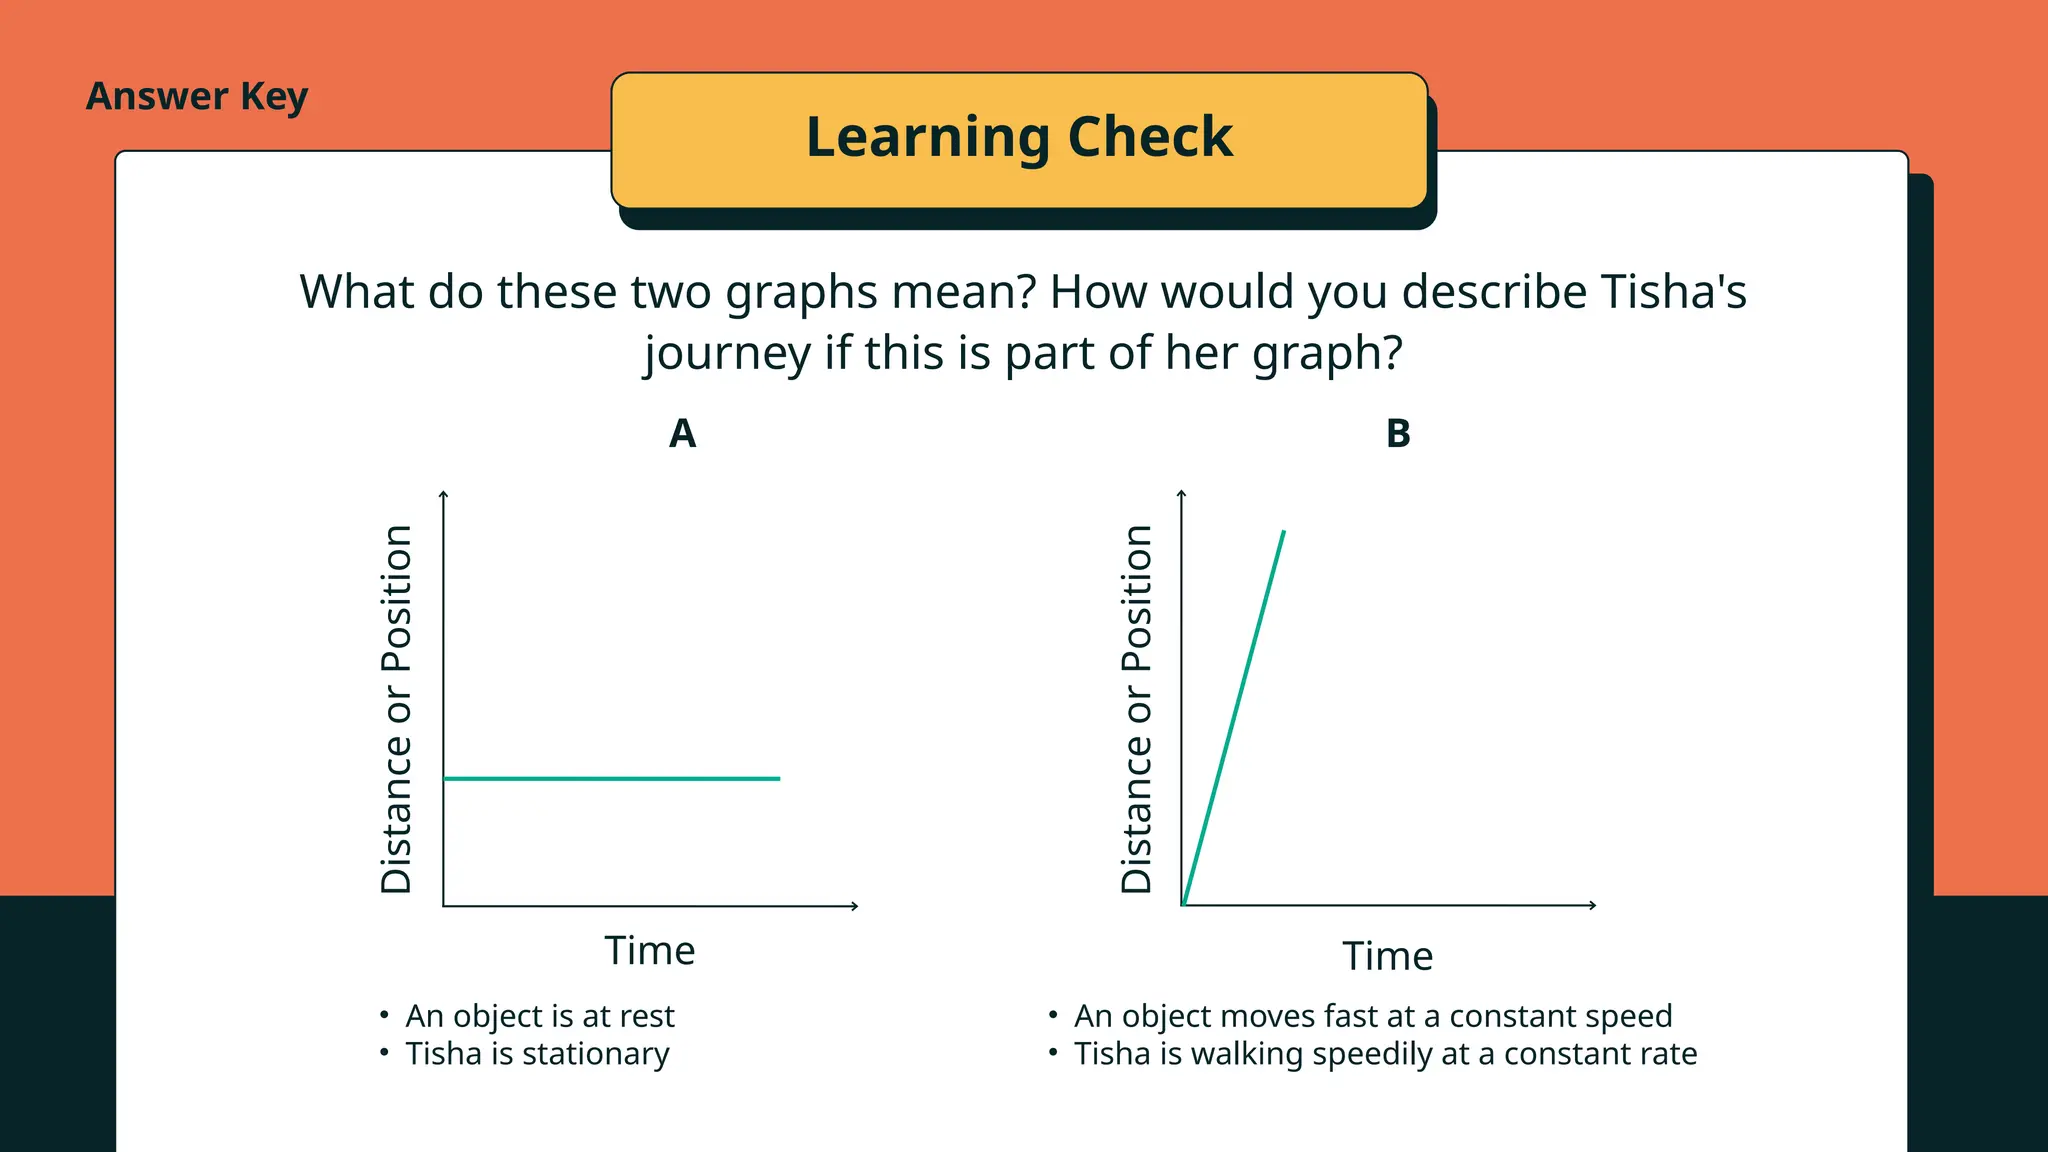
Whatdo these two graphs mean? How would you describe Tisha's
journey if this is part of her graph?
Time
Distance
or
Position
A
• An object is at rest
• Tisha is stationary
Time
Distance
or
Position
B
• An object moves fast at a constant speed
• Tisha is walking speedily at a constant rate
27.
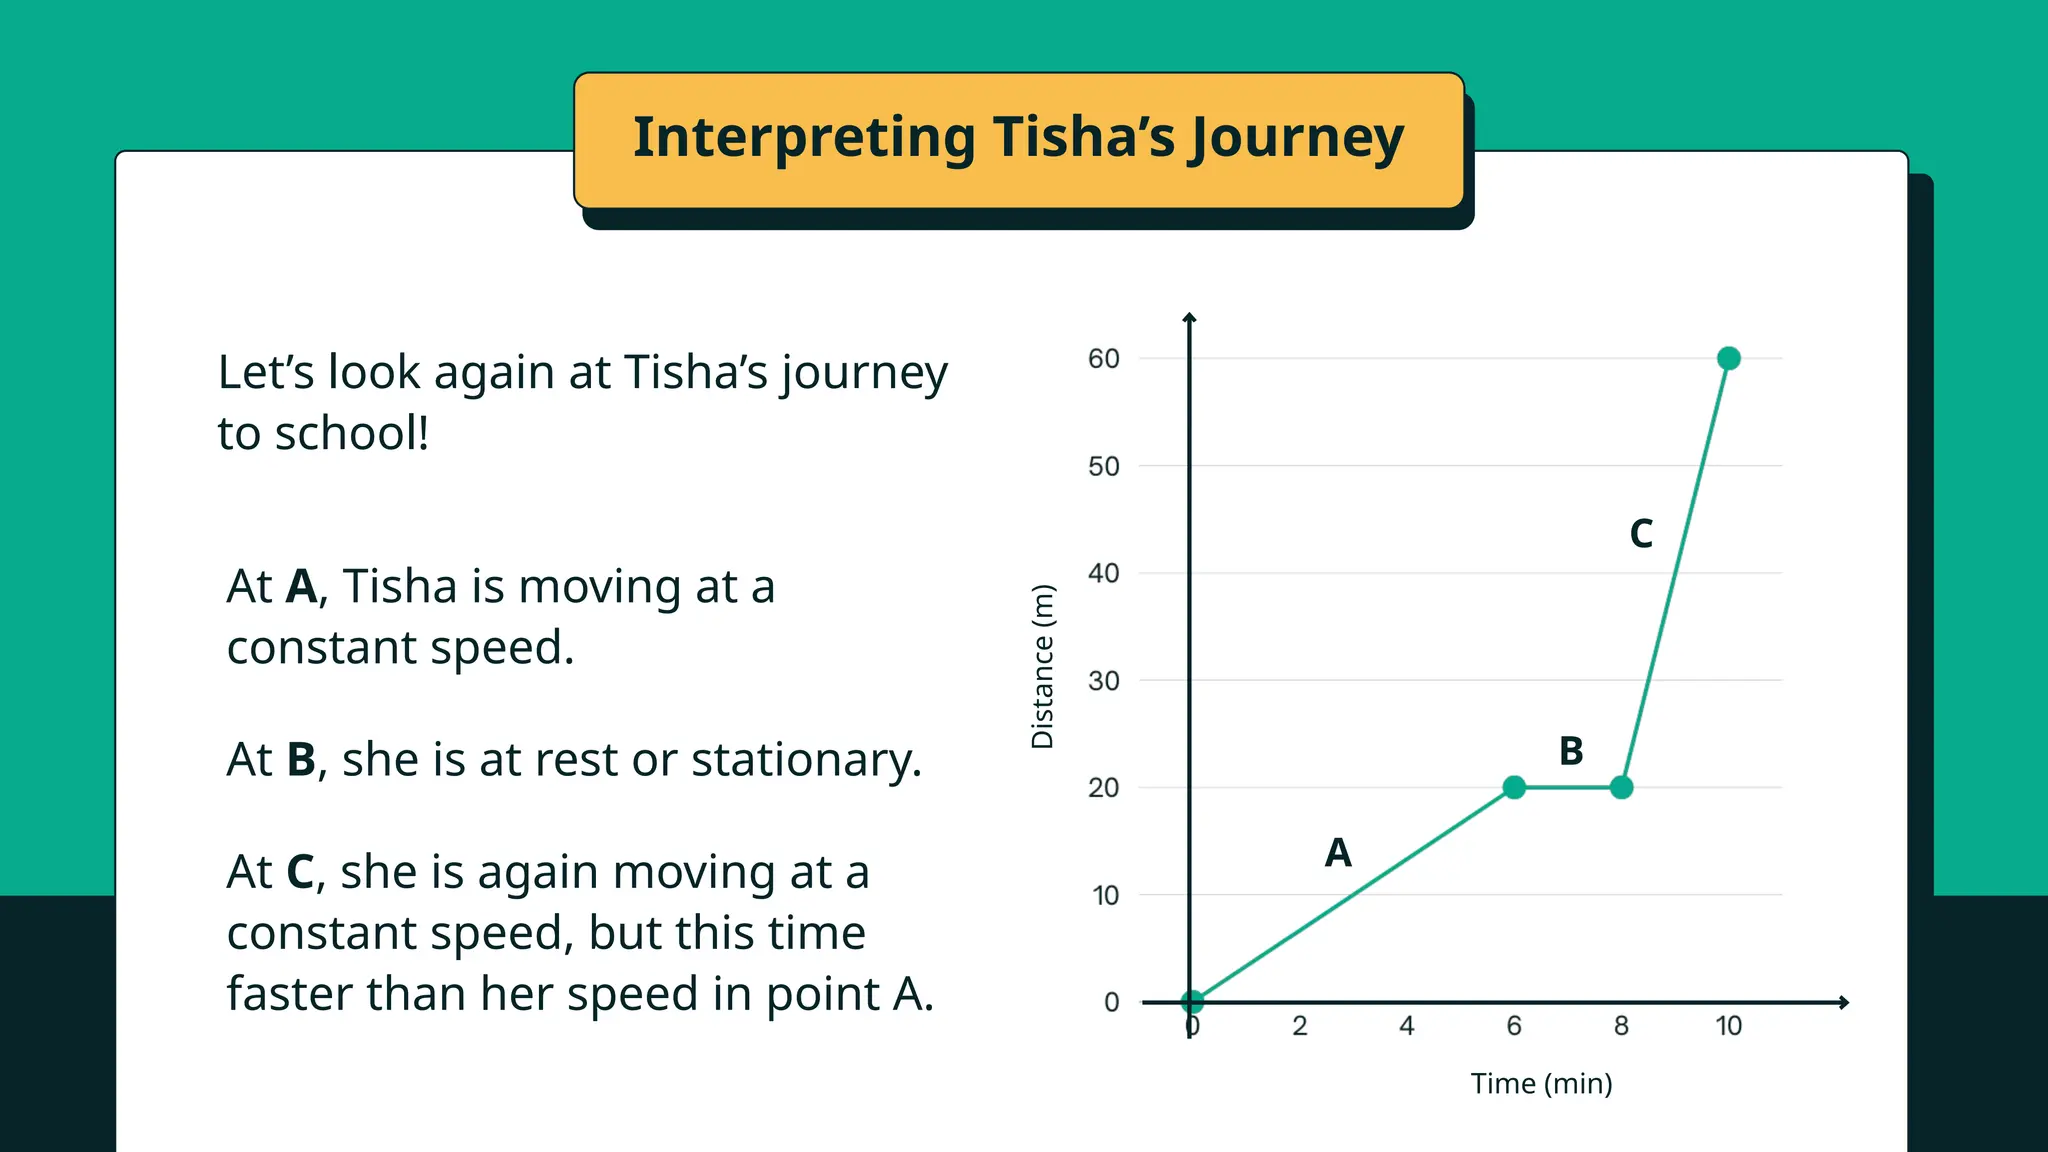
Interpreting Tisha’s Journey
AtA, Tisha is moving at a
constant speed.
At B, she is at rest or stationary.
At C, she is again moving at a
constant speed, but this time
faster than her speed in point A.
Let’s look again at Tisha’s journey
to school!
A
B
C
Time (min)
Distance
(m)
28.
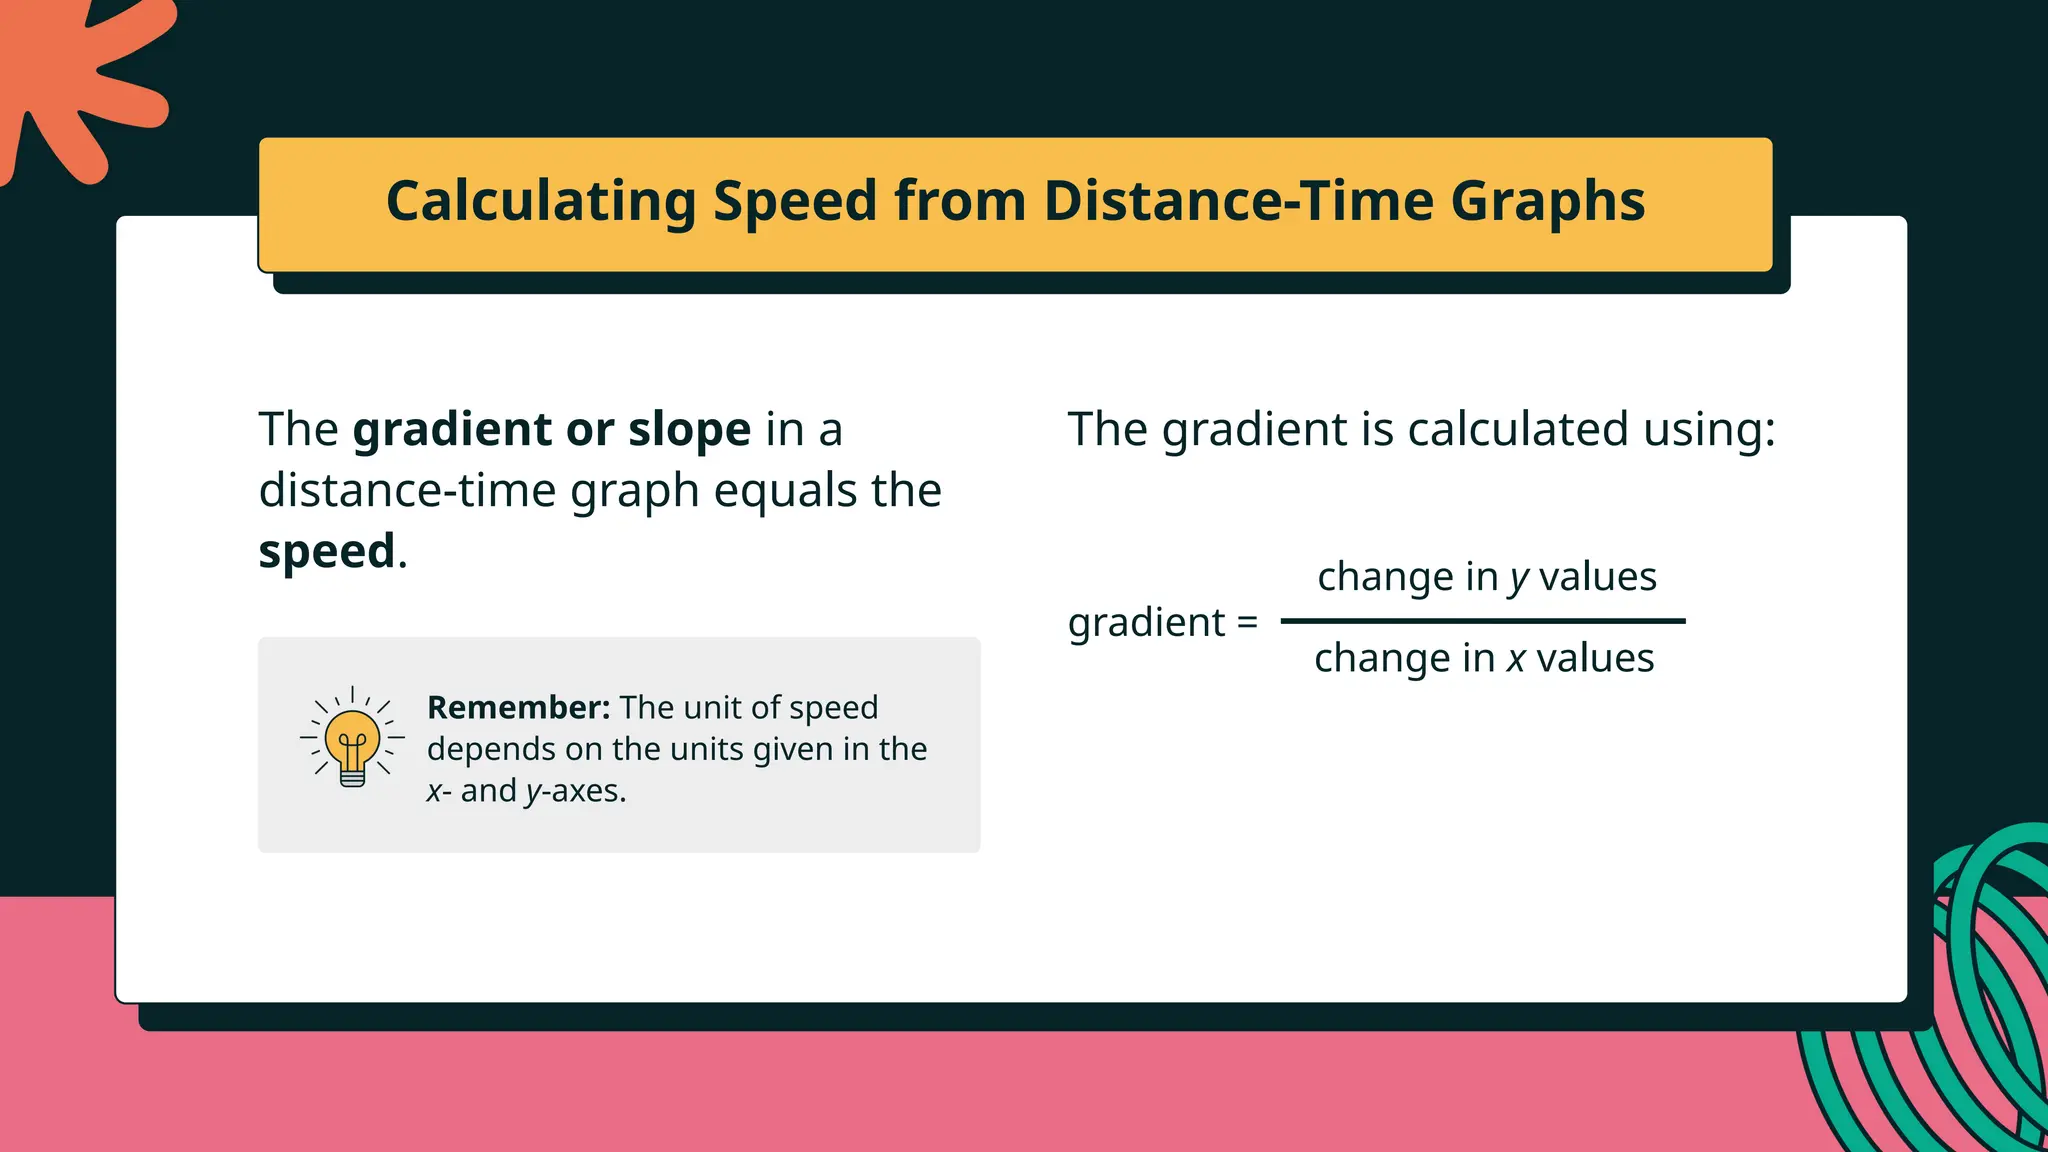
Calculating Speed fromDistance-Time Graphs
gradient =
change in y values
change in x values
The gradient or slope in a
distance-time graph equals the
speed.
The gradient is calculated using:
Remember: The unit of speed
depends on the units given in the
x- and y-axes.
29.
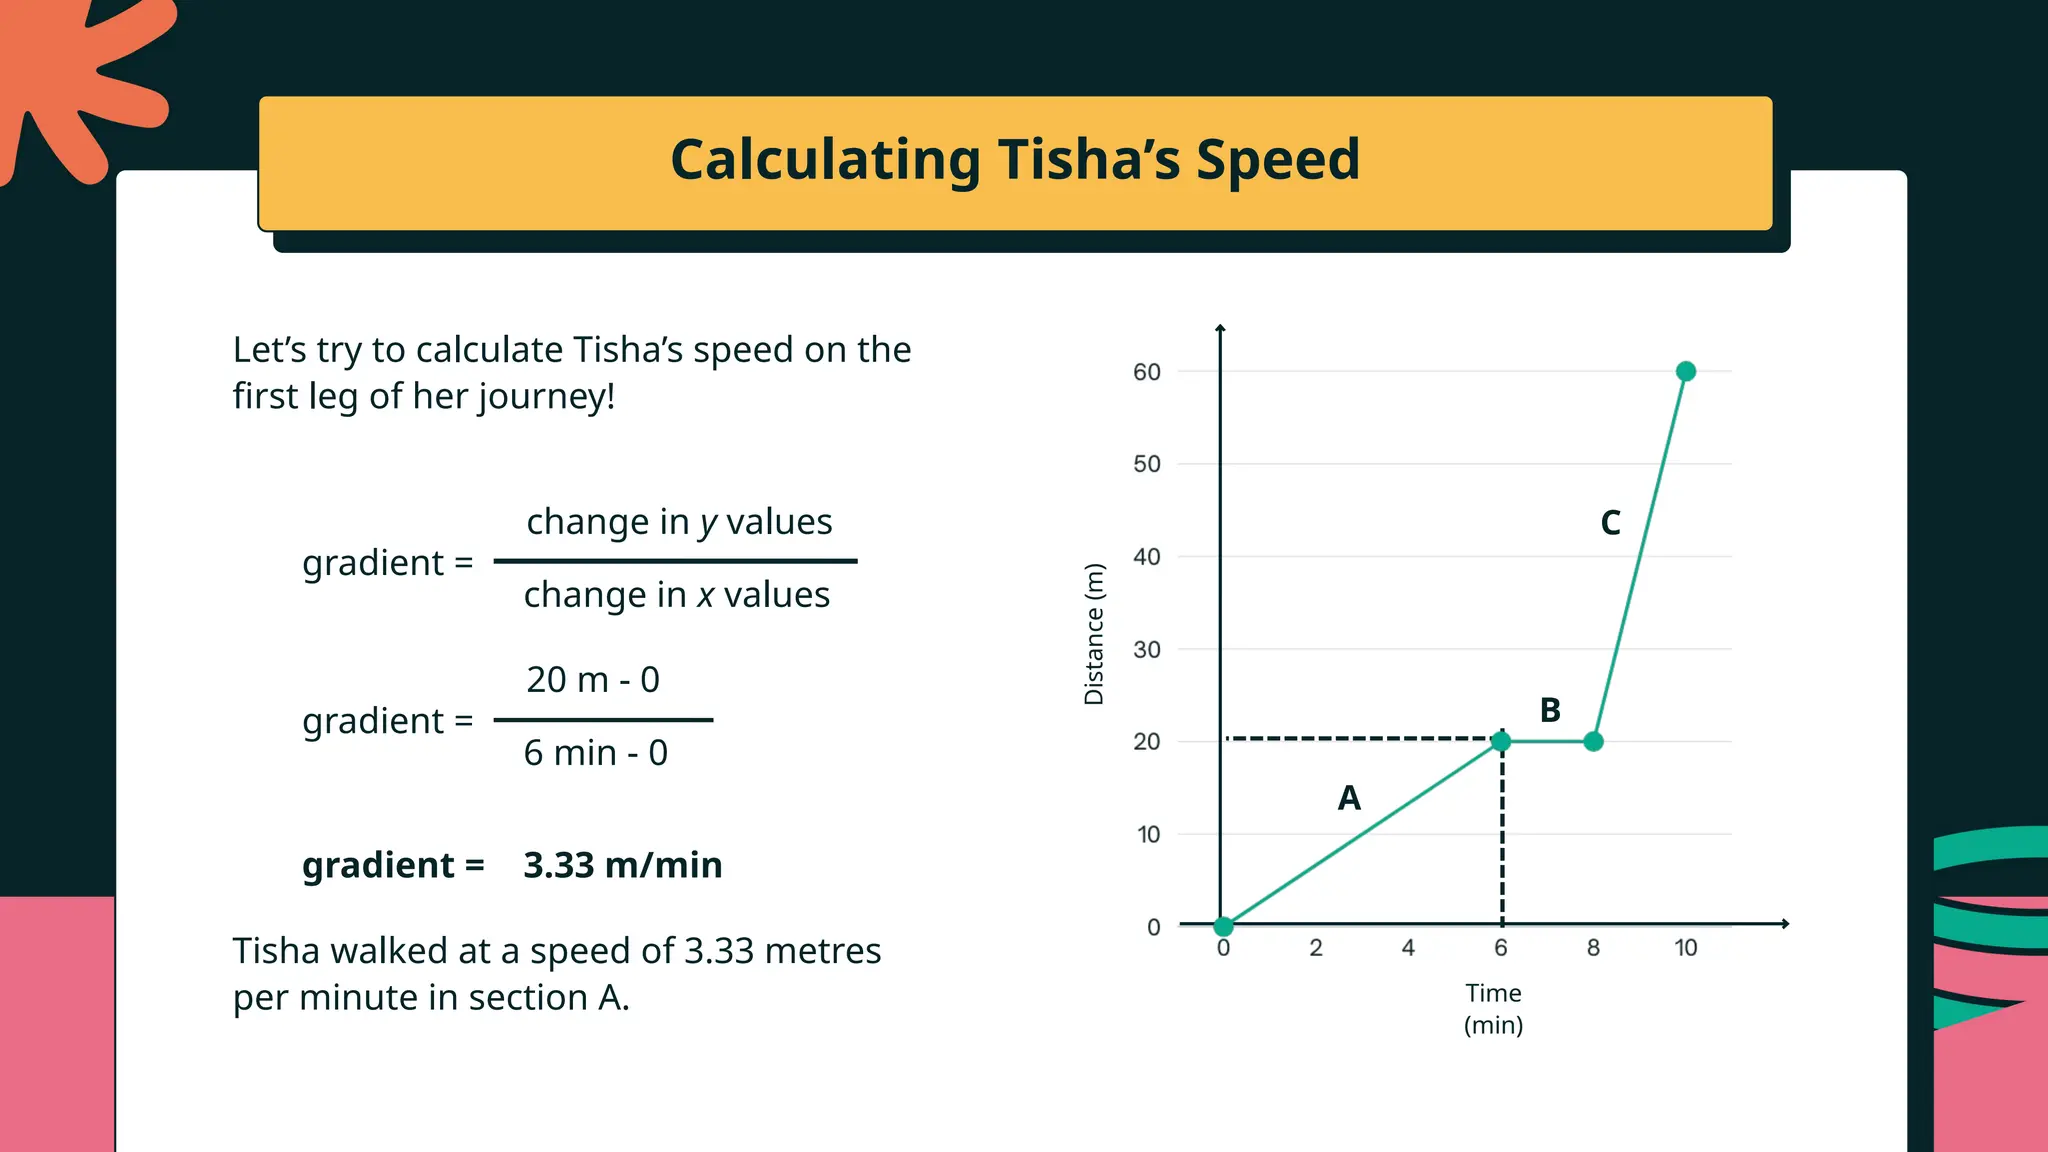
Calculating Tisha’s Speed
Let’stry to calculate Tisha’s speed on the
first leg of her journey!
gradient =
change in y values
change in x values
gradient =
20 m - 0
6 min - 0
gradient = 3.33 m/min
Tisha walked at a speed of 3.33 metres
per minute in section A. Time
(min)
Distance
(m)
A
B
C
30.
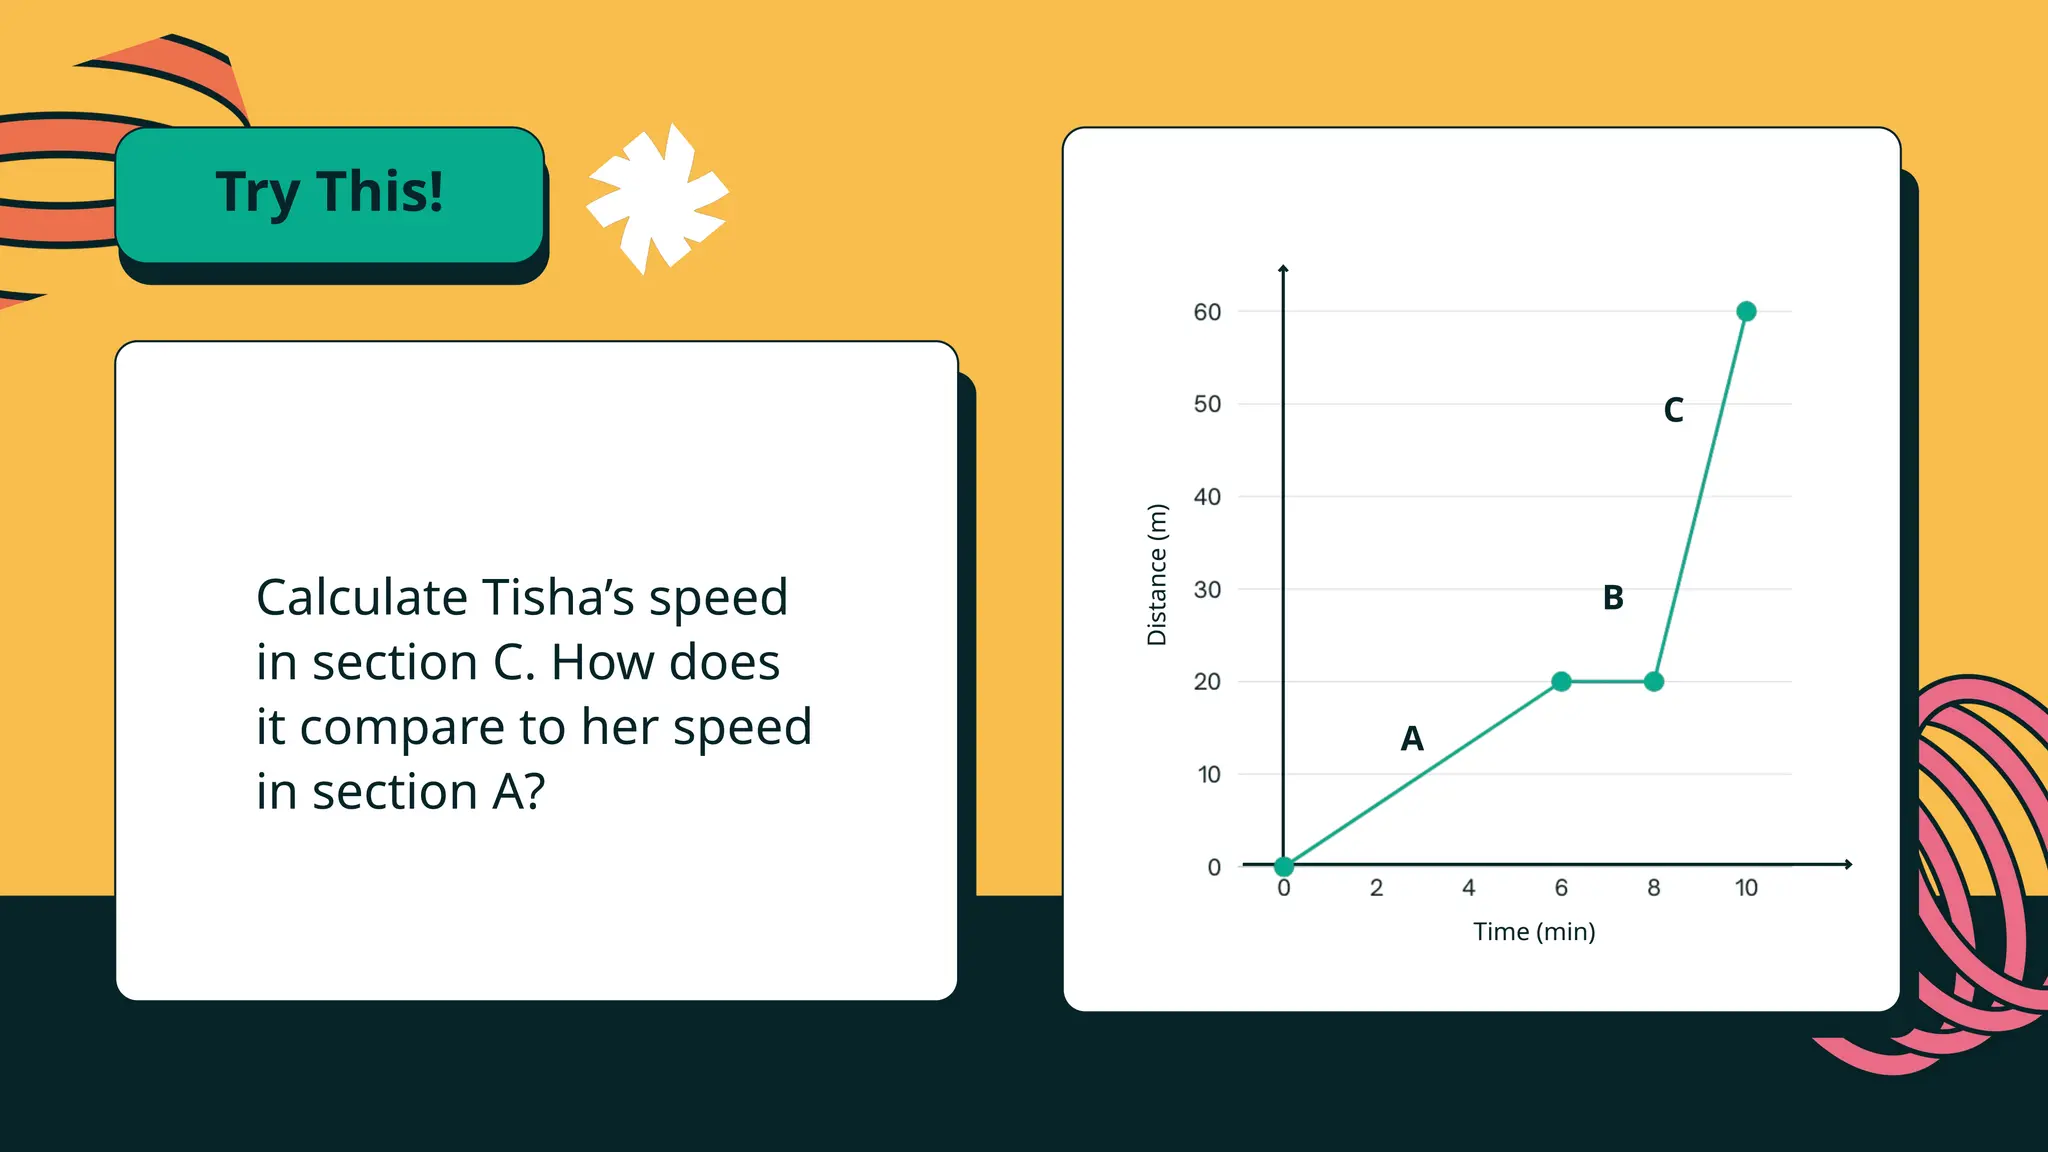
Try This!
Calculate Tisha’sspeed
in section C. How does
it compare to her speed
in section A?
Time (min)
Distance
(m)
A
B
C
31.
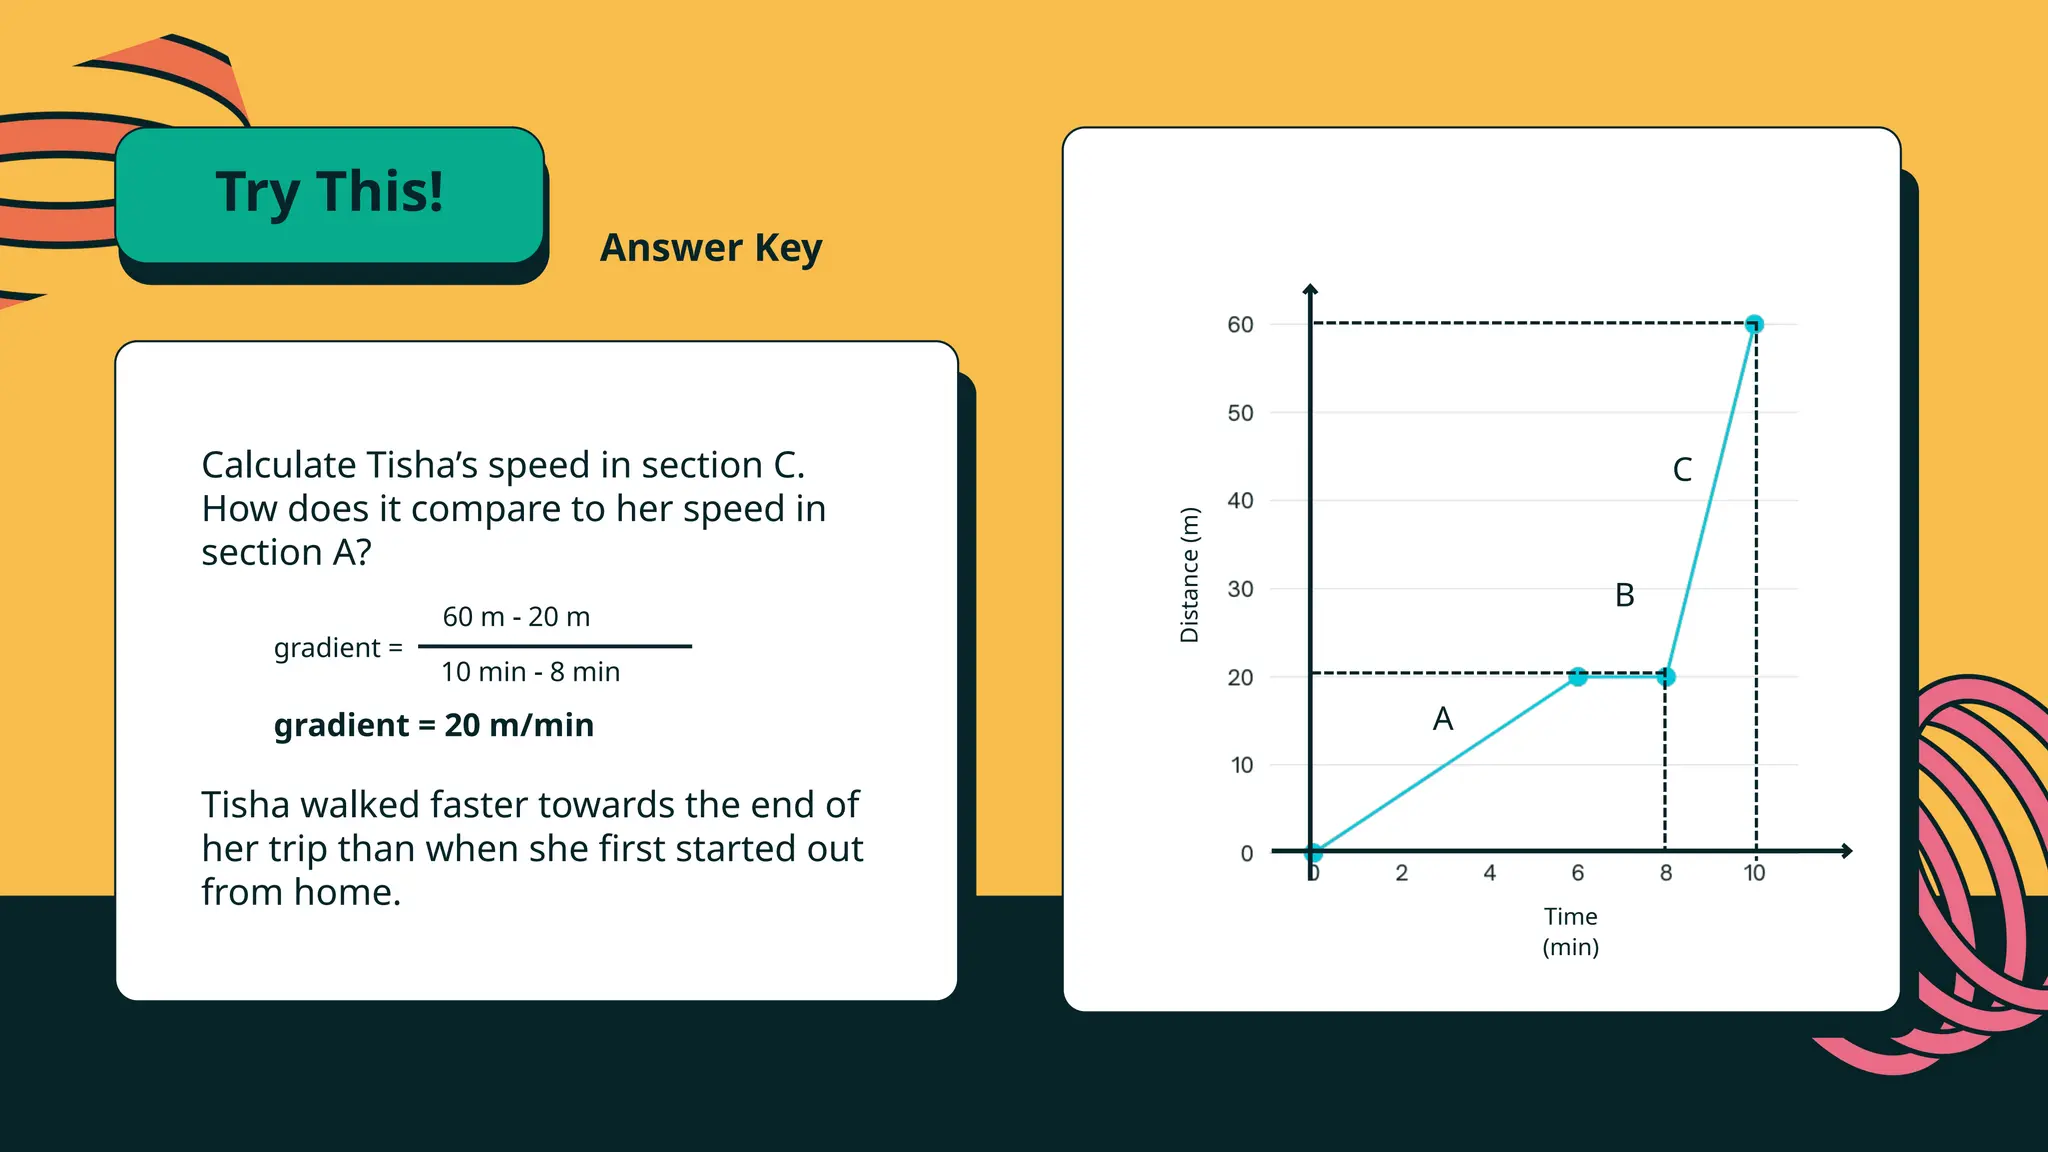
Calculate Tisha’s speedin section C.
How does it compare to her speed in
section A?
gradient =
60 m - 20 m
10 min - 8 min
gradient = 20 m/min
Tisha walked faster towards the end of
her trip than when she first started out
from home.
Time
(min)
Distance
(m)
A
B
C
Answer Key
Try This!
32.
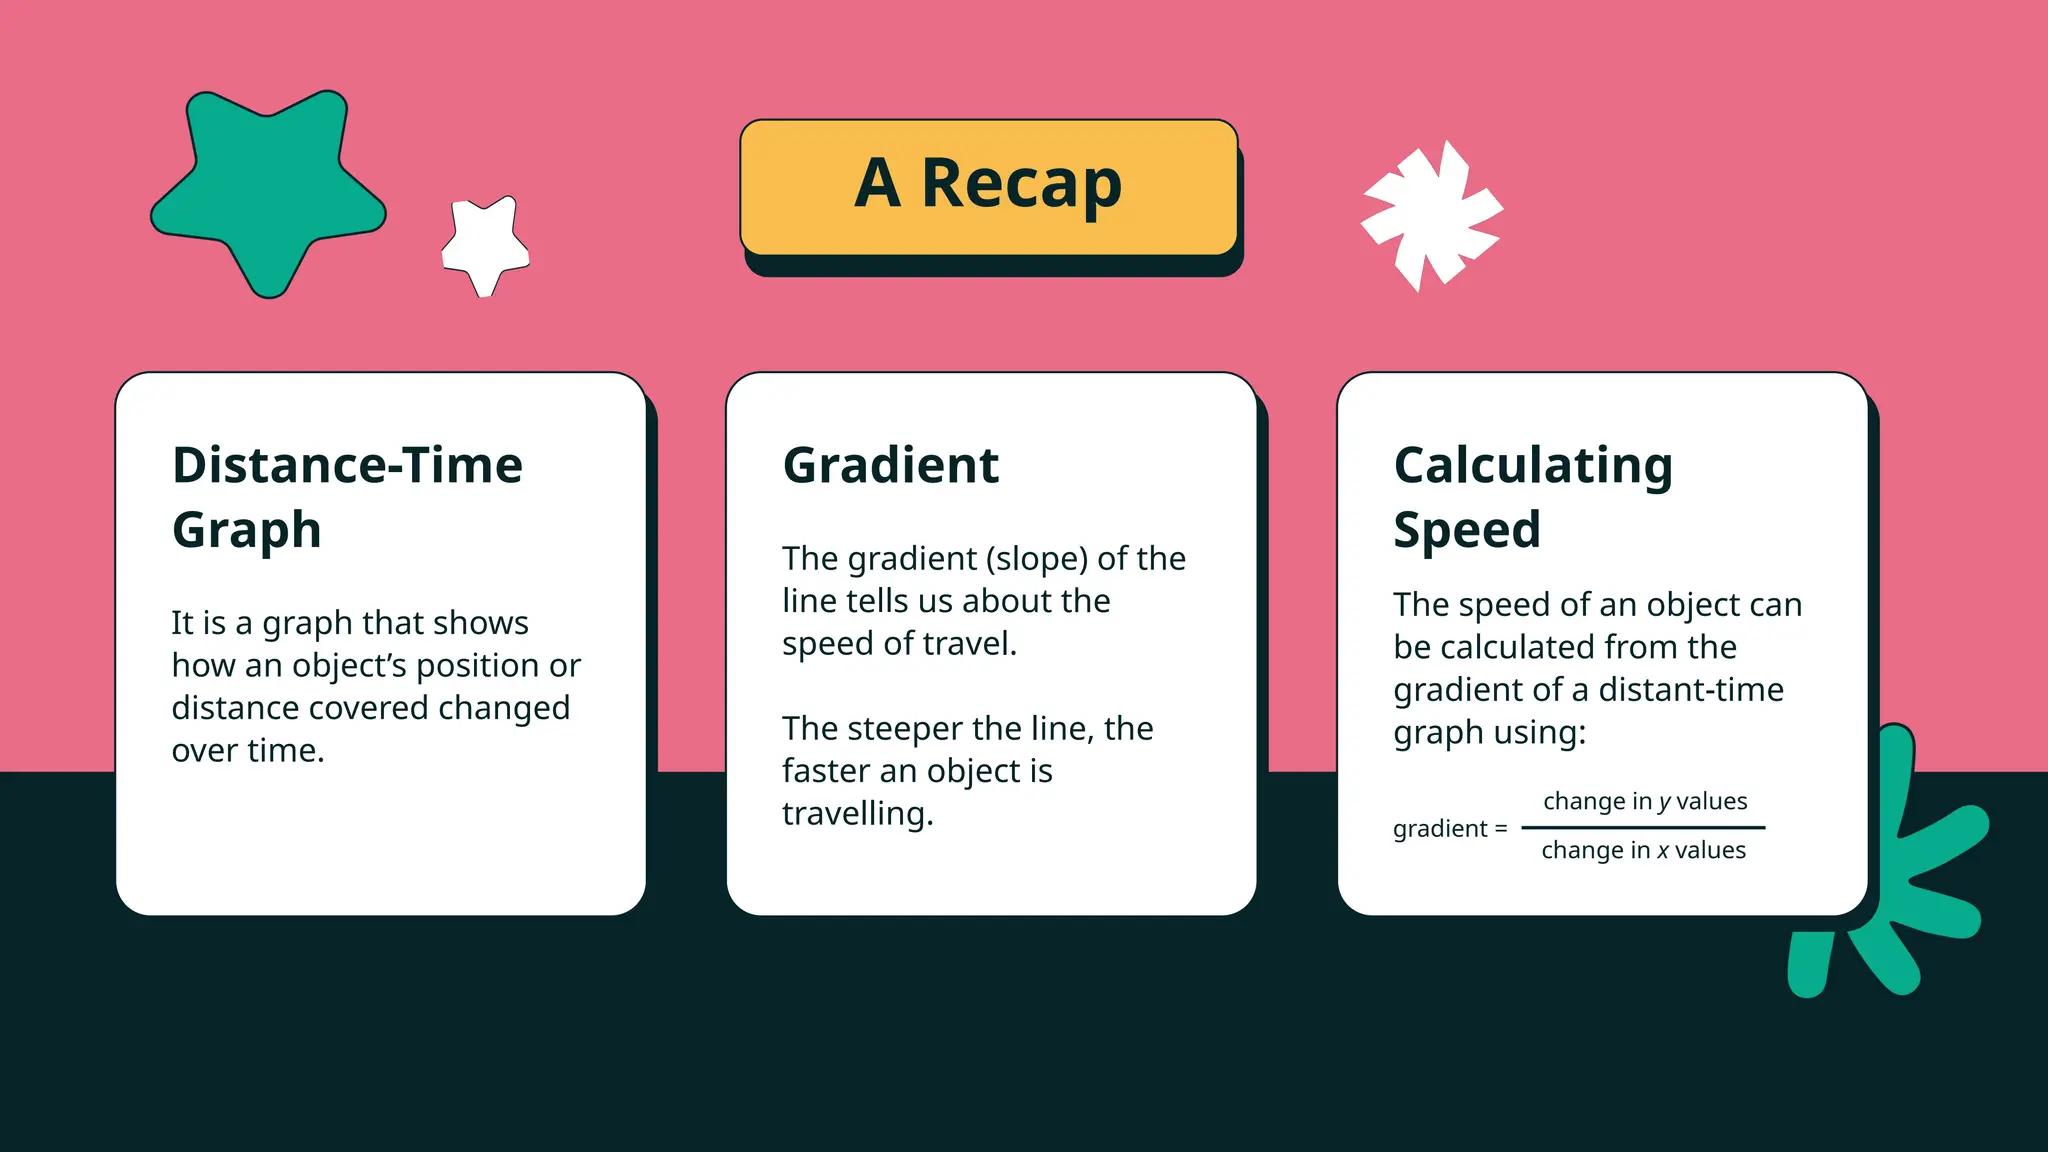
A Recap
gradient =
changein y values
change in x values
The gradient (slope) of the
line tells us about the
speed of travel.
The steeper the line, the
faster an object is
travelling.
Distance-Time
Graph
Gradient Calculating
Speed
It is a graph that shows
how an object’s position or
distance covered changed
over time.
The speed of an object can
be calculated from the
gradient of a distant-time
graph using:
33.
Your Journey toSchool
Sketch a simple diagram of your
journey to school with approximate
timings.
Organise the data in a table format.
Then, prepare a distance-time graph to
represent your journey.
34.
Resource Page
Use theseicons and illustrations in your Canva Presentation.
Happy designing! Don't forget to delete this page before presenting.
35.
Try this backgroundfor
online class.
*Please delete this section before downloading.


![DISTANCE & DISPLACEMENT [Autosaved].pptx](https://cdn.slidesharecdn.com/ss_thumbnails/distancedisplacementautosaved-240205035054-d2154fe1-thumbnail.jpg?width=640&height=640&fit=bounds)


