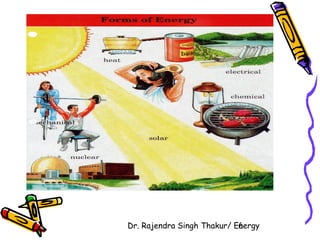
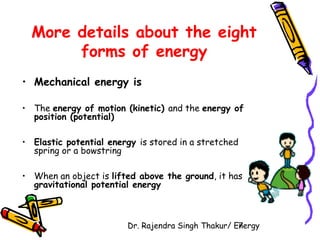
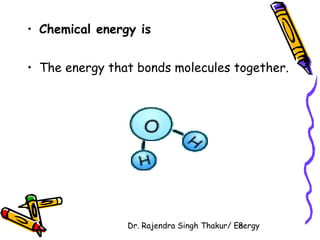
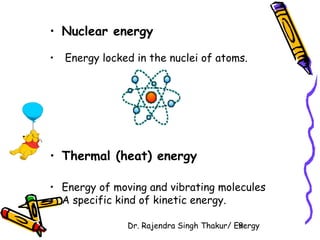
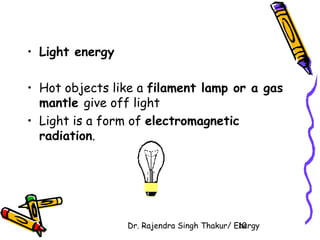
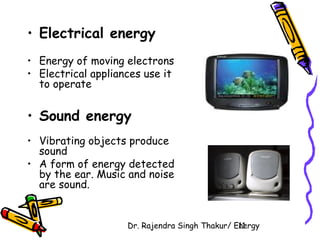
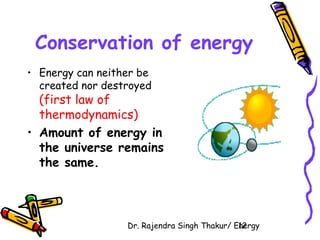
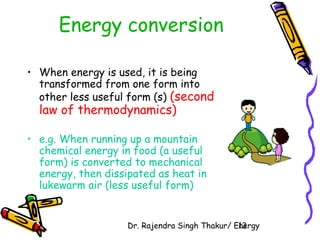
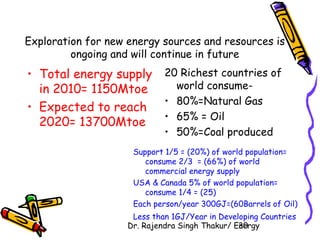
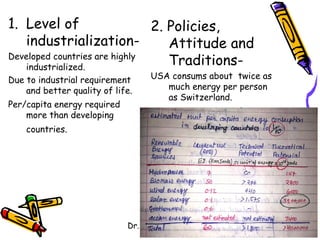
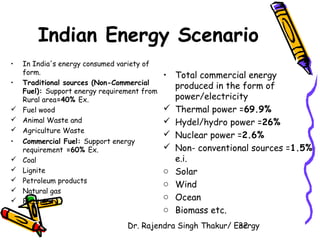
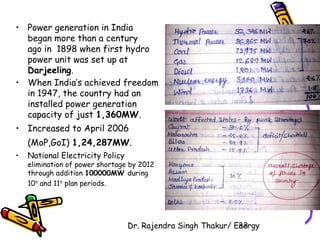
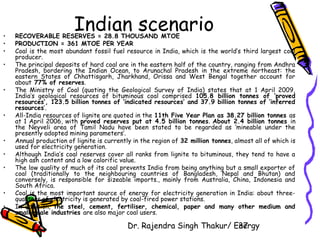
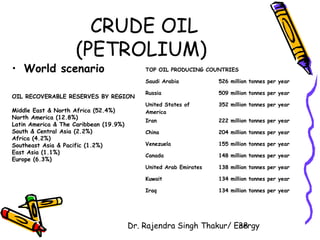
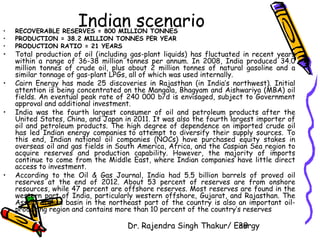
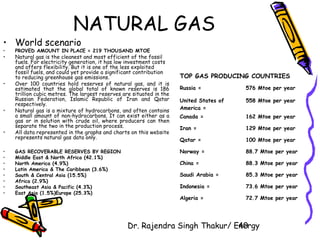
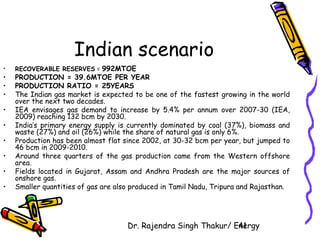
EENNEERRGGYY 
PPrreesseennttaattiioonn bbyy:: 
DDrr.. RRaajjeennddrraa SSiinngghh TThhaakkuurr 
Dr. Rajendra Singh Thakur/ Energy 1
Energy and its uses ? 
• Like space, time and information energy is one of 
the fundamental quantity. 
• Energy is the physical ability to do work. 
• All activities in the universe, including human 
activities involves energy changes. 
Dr. Rajendra Singh Thakur/ E2nergy
• Energy in SI system units is Joule (J). 
• Work done when a force of 1 Newton moves through 
1 Meter. 
• Energy/unit of Time = Power. 
• SI units of Power = Watt (W) 
• Power = Watt (W) = 1 Joule/Sec. 
• All the physical processes can be transition from one 
form of energy to another. 
• All living being are operated by mean of energy 
which is derived from the environment. 
Dr. Rajendra Singh Thakur/ E3nergy
Energy is everywhere 
Dr. Rajendra Singh Thakur/ E4nergy
Forms of energy 
In everyday life, energy 
exists in eight forms: 
• Mechanical (kinetic and 
potential) 
• Chemical 
• Nuclear 
• Thermal or Heat 
• Light 
• Electrical 
• Sound 
Dr. Rajendra Singh Thakur/ E5nergy
Dr. Rajendra Singh Thakur/ E6nergy
More details about the eight 
forms of energy 
• Mechanical energy is 
• The energy of motion (kinetic) and the energy of 
position (potential) 
• Elastic potential energy is stored in a stretched 
spring or a bowstring 
• When an object is lifted above the ground, it has 
gravitational potential energy 
Dr. Rajendra Singh Thakur/ E7nergy
• Chemical energy is 
• The energy that bonds molecules together. 
Dr. Rajendra Singh Thakur/ E8nergy
• Nuclear energy 
• Energy locked in the nuclei of atoms. 
• Thermal (heat) energy 
• Energy of moving and vibrating molecules 
• A specific kind of kinetic energy. 
Dr. Rajendra Singh Thakur/ E9nergy
Dr. Rajendra Singh Thakur/ E1n0ergy 
• Light energy 
• Hot objects like a filament lamp or a gas 
mantle give off light 
• Light is a form of electromagnetic 
radiation.
• Electrical energy 
• Energy of moving electrons 
• Electrical appliances use it 
to operate 
• Sound energy 
• Vibrating objects produce 
sound 
• A form of energy detected 
by the ear. Music and noise 
are sound. 
Dr. Rajendra Singh Thakur/ E1n1ergy
Conservation of energy 
• Energy can neither be 
created nor destroyed 
(first law of 
thermodynamics) 
• Amount of energy in 
the universe remains 
the same. 
Dr. Rajendra Singh Thakur/ E1n2ergy
Energy conversion 
• When energy is used, it is being 
transformed from one form into 
other less useful form (s) (second 
law of thermodynamics) 
• e.g. When running up a mountain 
chemical energy in food (a useful 
form) is converted to mechanical 
energy, then dissipated as heat in 
lukewarm air (less useful form) 
Dr. Rajendra Singh Thakur/ E1n3ergy
Test: When you rub your hands together, 
what is the energy conversion? 
Answer: From mechanical energy to heat 
energy. 
Can you think of other examples in your 
daily lives? 
Dr. Rajendra Singh Thakur/ E1n4ergy
• For thousands of years, every human being using up 
about 2000 cal./day. 
• Today inhabitants of industrialization nations consumed 
about 200000 cal./person/day. 
• To sustain life biologically consumed for other purposes 
100 times. 
• Energy is not only the pre-requisite for all life form but 
important factor in Economic growth and Technical 
changes. 
Dr. Rajendra Singh Thakur/ E1n5ergy
Energy is used in following purpose 
• Cooking, heating, lighting & other facilities. 
• Transporting people and goods. 
• Manufacturing consumer goods and capital equipments. 
• Production and conversion of primary fuels conversion 
chemical by dry cell battery electrical energy. 
Dr. Rajendra Singh Thakur/ E1n6ergy
Energy and development 
• Energy is of key input in economic growth and 
closed link between 
Availability of energy 
Future growth and 
Development of nation. 
• To understand Energy and development and 
Economic development of society. 
Dr. Rajendra Singh Thakur/ E1n7ergy
Energy and development: 
Present perspective and issue 
• Relationship between 
economic growth and 
increase energy 
demand is not always 
linear. 
• Ex. Present 6% increase 
INDIAS GDP need 9% 
increase energy demand. 
• The major causes of High 
energy intensity and High 
energy demand in developing 
countries. Causes are- 
• Technological 
• Managerial 
• Economical 
• Structural 
• Lack of awareness 
• Volatility of international energy prices. 
Dr. Rajendra Singh Thakur/ E1n8ergy
History of energy use 
• Date back several thousand years ago. Sun is 
probably the first source of energy known to 
mankind. 
• Animals learn "energy" and its "power" when 
getting warmth under sun and when facing the 
danger of a forest fire due to lightning. 
Dr. Rajendra Singh Thakur/ E1n9ergy
How do we use Energy? 
To human, its main function can be grouped 
into five main categories: 
• Energy allows us to see 
• Energy give us warmth 
• Energy produces growth 
• Energy produces motion 
• Energy powers technology 
Dr. Rajendra Singh Thakur/ E2ne0rgy
Classification of 
Sources of Energy 
Commercial Fuels- 
• Coal 
• Lignite 
• Petroleum products 
• Natural gas 
• electricity 
Non-Commercial Fuels- 
• Fuel wood 
• Caw dung 
• Agriculture waste 
Dr. Rajendra Singh Thakur/ E2ne1rgy
• Primary Energy 
Resources- which are 
mined or otherwise obtained 
from environment, 
Include- 
• Fossil fuel-Coal, Lignite, Crude 
oil, Natural gas 
• Nuclear fuel 
• Water (Hydro energy) 
• Solar 
• Wind 
• Ocean and 
• Geothermal energy. 
• Secondary Energy 
Resources- which do 
not occurs in nature, they are 
derived from primary 
resources. 
Include- 
• Petrol & diesel 
• Electricity (Coal, Diesel or 
gas) etc. 
Dr. Rajendra Singh Thakur/ E2ne2rgy
Dr. Rajendra Singh Thakur/ E2ne3rgy 
• Conventional 
Energy 
Resources- 
• Fossil fuel- 
 Coal, 
 Petroleum, 
 Natural gas 
• Water- 
 Hydel/Hydro Power 
• Non-conventional 
Energy Resources- 
• (called Alternate 
or Unconventional) 
• Solar 
• Wind 
• Geothermal 
• Ocean (thermal and wave) 
• Biomass 
• Hydrogen and 
• Nuclear energy
• Non-renewable 
energy resources- 
• Natural resources which are 
Dr. Rajendra Singh Thakur/ E2ne4rgy 
exhaustible and can’t be 
replaced once they used 
• Available in limited amount and 
develop over a long period 
• Fossil fuel- 
 Coal, 
 Petroleum (Oil), 
 Natural gas 
 Nuclear power 
• Renewable energy 
resources- 
• Natural resources which are 
inexhaustible and can be replaced 
as we use. Can be used to produce 
energy again and again 
• Available in unlimited amount and 
develop in a relatively short period 
of time. 
• Solar 
• Wind 
• Water 
• Geothermal 
• Ocean (thermal and wave) 
• Biomass 
• Hydrogen and 
• Nuclear energy (consider as inexhaustible 
sources if atomic mineral are used in fast 
breeder reactor technology.)
World Energy Scenario 
Dr. Rajendra Singh Thakur/ E2ne5rgy 
• Coal, 
• Oil, 
• Natural Gas and 
• Nuclear Energy 
are major sources 
of primary energy 
Followed by- 
Renewable Sources 
• Combustible waste 
 Biomass, 
 Animal Products, 
 Municipal Waste, 
 Industrial Waste 
• Hydro Power and 
• Other sources
Dr. Rajendra Singh Thakur/ E2ne6rgy
Dr. Rajendra Singh Thakur/ E2ne7rgy
Dr. Rajendra Singh Thakur/ E2ne8rgy
Dr. Rajendra Singh Thakur/ E2ne9rgy
Exploration for new energy sources and resources is 
ongoing and will continue in future 
• Total energy supply 
in 2010= 1150Mtoe 
• Expected to reach 
2020= 13700Mtoe 
20 Richest countries of 
world consume- 
• 80%=Natural Gas 
• 65% = Oil 
• 50%=Coal produced 
Support 1/5 = (20%) of world population= 
consume 2/3 = (66%) of world 
commercial energy supply 
USA & Canada 5% of world population= 
consume 1/4 = (25) 
Each person/year 300GJ=(60Barrels of Oil) 
Less than 1GJ/Year in Developing Countries 
Dr. Rajendra Singh Thakur/ E3ne0rgy
1. Level of 
industrialization- 
Developed countries are highly 
Dr. Rajendra Singh Thakur/ E3ne1rgy 
industrialized. 
Due to industrial requirement 
and better quality of life. 
Per/capita energy required 
more than developing 
countries. 
2. Policies, 
Attitude and 
Traditions- 
USA consums about twice as 
much energy per person 
as Switzerland.
Indian Energy Scenario 
• In India's energy consumed variety of 
Dr. Rajendra Singh Thakur/ E3ne2rgy 
form. 
• Traditional sources (Non-Commercial 
Fuel): Support energy requirement from 
Rural area=40% Ex. 
 Fuel wood 
 Animal Waste and 
 Agriculture Waste 
• Commercial Fuel: Support energy 
requirement =60% Ex. 
 Coal 
 Lignite 
 Petroleum products 
 Natural gas 
 Electricity 
• Total commercial energy 
produced in the form of 
power/electricity 
 Thermal power =69.9% 
 Hydel/hydro power =26% 
 Nuclear power =2.6% 
 Non- conventional sources =1.5% 
e.i. 
o Solar 
o Wind 
o Ocean 
o Biomass etc.
• Power generation in India 
began more than a century 
ago in 1898 when first hydro 
power unit was set up at 
Darjeeling. 
• When India’s achieved freedom 
in 1947, the country had an 
installed power generation 
capacity of just 1,360MW. 
• Increased to April 2006 
(MoP,GoI) 1,24,287MW. 
• National Electricity Policy 
elimination of power shortage by 2012 
through addition 100000MW during 
10th and 11th plan periods. 
Dr. Rajendra Singh Thakur/ E3ne3rgy
Non-renewable energy 
resources 
Dr. Rajendra Singh Thakur/ E3ne4rgy
FOSSILE FUELS 
• COAL 
• CRUDE OIL (PETROLIUM) 
• NATURAL GAS 
Dr. Rajendra Singh Thakur/ E3ne5rgy
COAL 
• World scenario 
COAL RECOVERABLE RESERVES BY REGION 
• Middle East & North Africa (0.1%) 
• North America (27.5%) 
• Latin America & The Caribbean (1.6%) 
• South & Central Asia (11.2%) 
• Africa (3.5%) 
• Southeast Asia & Pacific (12%) 
• East Asia (13.2%) 
• Europe (30.8%) 
TOP COAL PRODUCING COUNTRIES 
China 2.48 thousand Mtoe 
per year 
United States of 
America 
764 Mtoe per year 
India 361 Mtoe per year 
Australia 278 Mtoe per year 
Indonesia 247 Mtoe per year 
Russia 229 Mtoe per year 
South Africa 176 Mtoe per year 
Germany 133 Mtoe per year 
Poland 91.4 Mtoe per year 
Kazakhstan 87.3 Mtoe per year 
Dr. Rajendra Singh Thakur/ E3ne6rgy
Indian scenario • RECOVERABLE RESERVES = 28.8 THOUSAND MTOE 
• PRODUCTION = 361 MTOE PER YEAR 
• Coal is the most abundant fossil fuel resource in India, which is the world’s third largest coal 
Dr. Rajendra Singh Thakur/ E3ne7rgy 
producer. 
• The principal deposits of hard coal are in the eastern half of the country, ranging from Andhra 
Pradesh, bordering the Indian Ocean, to Arunachal Pradesh in the extreme northeast: the 
eastern States of Chhattisgarh, Jharkhand, Orissa and West Bengal together account for 
about 77% of reserves. 
• The Ministry of Coal (quoting the Geological Survey of India) states that at 1 April 2009, 
India’s geological resources of bituminous coal comprised 105.8 billion tonnes of ‘proved 
resources’, 123.5 billion tonnes of ‘indicated resources’ and 37.9 billion tonnes of ‘inferred 
resources’. 
• All-India resources of lignite are quoted in the 11th Five Year Plan as 38.27 billion tonnes as 
at 1 April 2006, with proved reserves put at 4.5 billion tonnes. About 2.4 billion tonnes in 
the Neyveli area of Tamil Nadu have been stated to be regarded as ‘mineable under the 
presently adopted mining parameters’. 
• Annual production of lignite is currently in the region of 32 million tonnes, almost all of which is 
used for electricity generation. 
• Although India’s coal reserves cover all ranks from lignite to bituminous, they tend to have a 
high ash content and a low calorific value. 
• The low quality of much of its coal prevents India from being anything but a small exporter of 
coal (traditionally to the neighbouring countries of Bangladesh, Nepal and Bhutan) and 
conversely, is responsible for sizeable imports., mainly from Australia, China, Indonesia and 
South Africa. 
• Coal is the most important source of energy for electricity generation in India: about three-quarters 
of electricity is generated by coal-fired power stations. 
• In addition, the steel, cement, fertiliser, chemical, paper and many other medium and 
small-scale industries are also major coal users.
CRUDE OIL 
(PETROLIUM) 
Dr. Rajendra Singh Thakur/ E3ne8rgy 
• World scenario 
OIL RECOVERABLE RESERVES BY REGION 
Middle East & North Africa (52.4%) 
North America (12.8%) 
Latin America & The Caribbean (19.9%) 
South & Central Asia (2.2%) 
Africa (4.2%) 
Southeast Asia & Pacific (1.2%) 
East Asia (1.1%) 
Europe (6.3%) 
TOP OIL PRODUCING COUNTRIES 
Saudi Arabia 526 million tonnes per year 
Russia 509 million tonnes per year 
United States of 
352 million tonnes per year 
America 
Iran 222 million tonnes per year 
China 204 million tonnes per year 
Venezuela 155 million tonnes per year 
Canada 148 million tonnes per year 
United Arab Emirates 138 million tonnes per year 
Kuwait 134 million tonnes per year 
Iraq 134 million tonnes per year
Indian scenario • RECOVERABLE RESERVES = 800 MILLION TONNES 
• PRODUCTION = 38.2 MILLION TONNES PER YEAR 
• PRODUCTION RATIO = 21 YEARS 
• Total production of oil (including gas-plant liquids) has fluctuated in recent years 
within a range of 36-38 million tonnes per annum. In 2008, India produced 34.0 
million tonnes of crude oil, plus about 2 million tonnes of natural gasoline and a 
similar tonnage of gas-plant LPGs, all of which was used internally. 
• Cairn Energy has made 25 discoveries in Rajasthan (in India’s northwest). Initial 
attention is being concentrated on the Mangala, Bhagyam and Aishwariya (MBA) oil 
fields. An eventual peak rate of 240 000 b/d is envisaged, subject to Government 
approval and additional investment. 
• India was the fourth largest consumer of oil and petroleum products after the 
United States, China, and Japan in 2011. It was also the fourth largest importer of 
oil and petroleum products. The high degree of dependence on imported crude oil 
has led Indian energy companies to attempt to diversify their supply sources. To 
this end, Indian national oil companies (NOCs) have purchased equity stakes in 
overseas oil and gas fields in South America, Africa, and the Caspian Sea region to 
acquire reserves and production capability. However, the majority of imports 
continue to come from the Middle East, where Indian companies have little direct 
access to investment. 
• According to the Oil & Gas Journal, India had 5.5 billion barrels of proved oil 
reserves at the end of 2012. About 53 percent of reserves are from onshore 
resources, while 47 percent are offshore reserves. Most reserves are found in the 
western part of India, particularly western offshore, Gujarat, and Rajasthan. The 
Assam-Arakan basin in the northeast part of the country is also an important oil-producing 
region and contains more than 10 percent of the country’s reserves 
Dr. Rajendra Singh Thakur/ E3ne9rgy
NATURAL GAS 
• World scenario 
• PROVED AMOUNT IN PLACE = 219 THOUSAND MTOE 
• Natural gas is the cleanest and most efficient of the fossil 
fuels. For electricity generation, it has low investment costs 
and offers flexibility. But it is one of the less exploited 
fossil fuels, and could yet provide a significant contribution 
to reducing greenhouse gas emissions. 
• Over 100 countries hold reserves of natural gas, and it is 
estimated that the global total of known reserves is 186 
trillion cubic metres. The largest reserves are situated in the 
Russian Federation, Islamic Republic of Iran and Qatar 
respectively. 
• Natural gas is a mixture of hydrocarbons, and often contains 
a small amount of non-hydrocarbons. It can exist either as a 
gas or in solution with crude oil, where producers can then 
separate the two in the production process. 
• All data represented in the graphs and charts on this website 
Dr. Rajendra Singh Thakur/ E4ne0rgy 
represents natural gas data only. 
• GAS RECOVERABLE RESERVES BY REGION 
• Middle East & North Africa (42.1%) 
• North America (4.9%) 
• Latin America & The Caribbean (3.6%) 
• South & Central Asia (15.5%) 
• Africa (2.9%) 
• Southeast Asia & Pacific (4.3%) 
• East Asia (1.5%)Europe (25.3%) 
TOP GAS PRODUCING COUNTRIES 
Russia = 576 Mtoe per year 
United States of 
558 Mtoe per year 
America = 
Canada = 162 Mtoe per year 
Iran = 129 Mtoe per year 
Qatar = 100 Mtoe per year 
Norway = 88.7 Mtoe per year 
China = 88.3 Mtoe per year 
Saudi Arabia = 85.3 Mtoe per year 
Indonesia = 73.6 Mtoe per year 
Algeria = 72.7 Mtoe per year
Indian scenario 
• RECOVERABLE RESERVES = 992MTOE 
• PRODUCTION = 39.6MTOE PER YEAR 
• PRODUCTION RATIO = 25YEARS 
• The Indian gas market is expected to be one of the fastest growing in the world 
Dr. Rajendra Singh Thakur/ E4ne1rgy 
over the next two decades. 
• IEA envisages gas demand to increase by 5.4% per annum over 2007-30 (IEA, 
2009) reaching 132 bcm by 2030. 
• India’s primary energy supply is currently dominated by coal (37%), biomass and 
waste (27%) and oil (26%) while the share of natural gas is only 6%. 
• Production has been almost flat since 2002, at 30-32 bcm per year, but jumped to 
46 bcm in 2009-2010. 
• Around three quarters of the gas production came from the Western offshore 
area. 
• Fields located in Gujarat, Assam and Andhra Pradesh are the major sources of 
onshore gas. 
• Smaller quantities of gas are also produced in Tamil Nadu, Tripura and Rajasthan.

Energy

  • 1.
    EENNEERRGGYY PPrreesseennttaattiioonn bbyy:: DDrr.. RRaajjeennddrraa SSiinngghh TThhaakkuurr Dr. Rajendra Singh Thakur/ Energy 1
  • 2.
    Energy and itsuses ? • Like space, time and information energy is one of the fundamental quantity. • Energy is the physical ability to do work. • All activities in the universe, including human activities involves energy changes. Dr. Rajendra Singh Thakur/ E2nergy
  • 3.
    • Energy inSI system units is Joule (J). • Work done when a force of 1 Newton moves through 1 Meter. • Energy/unit of Time = Power. • SI units of Power = Watt (W) • Power = Watt (W) = 1 Joule/Sec. • All the physical processes can be transition from one form of energy to another. • All living being are operated by mean of energy which is derived from the environment. Dr. Rajendra Singh Thakur/ E3nergy
  • 4.
    Energy is everywhere Dr. Rajendra Singh Thakur/ E4nergy
  • 5.
    Forms of energy In everyday life, energy exists in eight forms: • Mechanical (kinetic and potential) • Chemical • Nuclear • Thermal or Heat • Light • Electrical • Sound Dr. Rajendra Singh Thakur/ E5nergy
  • 6.
    Dr. Rajendra SinghThakur/ E6nergy
  • 7.
    More details aboutthe eight forms of energy • Mechanical energy is • The energy of motion (kinetic) and the energy of position (potential) • Elastic potential energy is stored in a stretched spring or a bowstring • When an object is lifted above the ground, it has gravitational potential energy Dr. Rajendra Singh Thakur/ E7nergy
  • 8.
    • Chemical energyis • The energy that bonds molecules together. Dr. Rajendra Singh Thakur/ E8nergy
  • 9.
    • Nuclear energy • Energy locked in the nuclei of atoms. • Thermal (heat) energy • Energy of moving and vibrating molecules • A specific kind of kinetic energy. Dr. Rajendra Singh Thakur/ E9nergy
  • 10.
    Dr. Rajendra SinghThakur/ E1n0ergy • Light energy • Hot objects like a filament lamp or a gas mantle give off light • Light is a form of electromagnetic radiation.
  • 11.
    • Electrical energy • Energy of moving electrons • Electrical appliances use it to operate • Sound energy • Vibrating objects produce sound • A form of energy detected by the ear. Music and noise are sound. Dr. Rajendra Singh Thakur/ E1n1ergy
  • 12.
    Conservation of energy • Energy can neither be created nor destroyed (first law of thermodynamics) • Amount of energy in the universe remains the same. Dr. Rajendra Singh Thakur/ E1n2ergy
  • 13.
    Energy conversion •When energy is used, it is being transformed from one form into other less useful form (s) (second law of thermodynamics) • e.g. When running up a mountain chemical energy in food (a useful form) is converted to mechanical energy, then dissipated as heat in lukewarm air (less useful form) Dr. Rajendra Singh Thakur/ E1n3ergy
  • 14.
    Test: When yourub your hands together, what is the energy conversion? Answer: From mechanical energy to heat energy. Can you think of other examples in your daily lives? Dr. Rajendra Singh Thakur/ E1n4ergy
  • 15.
    • For thousandsof years, every human being using up about 2000 cal./day. • Today inhabitants of industrialization nations consumed about 200000 cal./person/day. • To sustain life biologically consumed for other purposes 100 times. • Energy is not only the pre-requisite for all life form but important factor in Economic growth and Technical changes. Dr. Rajendra Singh Thakur/ E1n5ergy
  • 16.
    Energy is usedin following purpose • Cooking, heating, lighting & other facilities. • Transporting people and goods. • Manufacturing consumer goods and capital equipments. • Production and conversion of primary fuels conversion chemical by dry cell battery electrical energy. Dr. Rajendra Singh Thakur/ E1n6ergy
  • 17.
    Energy and development • Energy is of key input in economic growth and closed link between Availability of energy Future growth and Development of nation. • To understand Energy and development and Economic development of society. Dr. Rajendra Singh Thakur/ E1n7ergy
  • 18.
    Energy and development: Present perspective and issue • Relationship between economic growth and increase energy demand is not always linear. • Ex. Present 6% increase INDIAS GDP need 9% increase energy demand. • The major causes of High energy intensity and High energy demand in developing countries. Causes are- • Technological • Managerial • Economical • Structural • Lack of awareness • Volatility of international energy prices. Dr. Rajendra Singh Thakur/ E1n8ergy
  • 19.
    History of energyuse • Date back several thousand years ago. Sun is probably the first source of energy known to mankind. • Animals learn "energy" and its "power" when getting warmth under sun and when facing the danger of a forest fire due to lightning. Dr. Rajendra Singh Thakur/ E1n9ergy
  • 20.
    How do weuse Energy? To human, its main function can be grouped into five main categories: • Energy allows us to see • Energy give us warmth • Energy produces growth • Energy produces motion • Energy powers technology Dr. Rajendra Singh Thakur/ E2ne0rgy
  • 21.
    Classification of Sourcesof Energy Commercial Fuels- • Coal • Lignite • Petroleum products • Natural gas • electricity Non-Commercial Fuels- • Fuel wood • Caw dung • Agriculture waste Dr. Rajendra Singh Thakur/ E2ne1rgy
  • 22.
    • Primary Energy Resources- which are mined or otherwise obtained from environment, Include- • Fossil fuel-Coal, Lignite, Crude oil, Natural gas • Nuclear fuel • Water (Hydro energy) • Solar • Wind • Ocean and • Geothermal energy. • Secondary Energy Resources- which do not occurs in nature, they are derived from primary resources. Include- • Petrol & diesel • Electricity (Coal, Diesel or gas) etc. Dr. Rajendra Singh Thakur/ E2ne2rgy
  • 23.
    Dr. Rajendra SinghThakur/ E2ne3rgy • Conventional Energy Resources- • Fossil fuel-  Coal,  Petroleum,  Natural gas • Water-  Hydel/Hydro Power • Non-conventional Energy Resources- • (called Alternate or Unconventional) • Solar • Wind • Geothermal • Ocean (thermal and wave) • Biomass • Hydrogen and • Nuclear energy
  • 24.
    • Non-renewable energyresources- • Natural resources which are Dr. Rajendra Singh Thakur/ E2ne4rgy exhaustible and can’t be replaced once they used • Available in limited amount and develop over a long period • Fossil fuel-  Coal,  Petroleum (Oil),  Natural gas  Nuclear power • Renewable energy resources- • Natural resources which are inexhaustible and can be replaced as we use. Can be used to produce energy again and again • Available in unlimited amount and develop in a relatively short period of time. • Solar • Wind • Water • Geothermal • Ocean (thermal and wave) • Biomass • Hydrogen and • Nuclear energy (consider as inexhaustible sources if atomic mineral are used in fast breeder reactor technology.)
  • 25.
    World Energy Scenario Dr. Rajendra Singh Thakur/ E2ne5rgy • Coal, • Oil, • Natural Gas and • Nuclear Energy are major sources of primary energy Followed by- Renewable Sources • Combustible waste  Biomass,  Animal Products,  Municipal Waste,  Industrial Waste • Hydro Power and • Other sources
  • 26.
    Dr. Rajendra SinghThakur/ E2ne6rgy
  • 27.
    Dr. Rajendra SinghThakur/ E2ne7rgy
  • 28.
    Dr. Rajendra SinghThakur/ E2ne8rgy
  • 29.
    Dr. Rajendra SinghThakur/ E2ne9rgy
  • 30.
    Exploration for newenergy sources and resources is ongoing and will continue in future • Total energy supply in 2010= 1150Mtoe • Expected to reach 2020= 13700Mtoe 20 Richest countries of world consume- • 80%=Natural Gas • 65% = Oil • 50%=Coal produced Support 1/5 = (20%) of world population= consume 2/3 = (66%) of world commercial energy supply USA & Canada 5% of world population= consume 1/4 = (25) Each person/year 300GJ=(60Barrels of Oil) Less than 1GJ/Year in Developing Countries Dr. Rajendra Singh Thakur/ E3ne0rgy
  • 31.
    1. Level of industrialization- Developed countries are highly Dr. Rajendra Singh Thakur/ E3ne1rgy industrialized. Due to industrial requirement and better quality of life. Per/capita energy required more than developing countries. 2. Policies, Attitude and Traditions- USA consums about twice as much energy per person as Switzerland.
  • 32.
    Indian Energy Scenario • In India's energy consumed variety of Dr. Rajendra Singh Thakur/ E3ne2rgy form. • Traditional sources (Non-Commercial Fuel): Support energy requirement from Rural area=40% Ex.  Fuel wood  Animal Waste and  Agriculture Waste • Commercial Fuel: Support energy requirement =60% Ex.  Coal  Lignite  Petroleum products  Natural gas  Electricity • Total commercial energy produced in the form of power/electricity  Thermal power =69.9%  Hydel/hydro power =26%  Nuclear power =2.6%  Non- conventional sources =1.5% e.i. o Solar o Wind o Ocean o Biomass etc.
  • 33.
    • Power generationin India began more than a century ago in 1898 when first hydro power unit was set up at Darjeeling. • When India’s achieved freedom in 1947, the country had an installed power generation capacity of just 1,360MW. • Increased to April 2006 (MoP,GoI) 1,24,287MW. • National Electricity Policy elimination of power shortage by 2012 through addition 100000MW during 10th and 11th plan periods. Dr. Rajendra Singh Thakur/ E3ne3rgy
  • 34.
    Non-renewable energy resources Dr. Rajendra Singh Thakur/ E3ne4rgy
  • 35.
    FOSSILE FUELS •COAL • CRUDE OIL (PETROLIUM) • NATURAL GAS Dr. Rajendra Singh Thakur/ E3ne5rgy
  • 36.
    COAL • Worldscenario COAL RECOVERABLE RESERVES BY REGION • Middle East & North Africa (0.1%) • North America (27.5%) • Latin America & The Caribbean (1.6%) • South & Central Asia (11.2%) • Africa (3.5%) • Southeast Asia & Pacific (12%) • East Asia (13.2%) • Europe (30.8%) TOP COAL PRODUCING COUNTRIES China 2.48 thousand Mtoe per year United States of America 764 Mtoe per year India 361 Mtoe per year Australia 278 Mtoe per year Indonesia 247 Mtoe per year Russia 229 Mtoe per year South Africa 176 Mtoe per year Germany 133 Mtoe per year Poland 91.4 Mtoe per year Kazakhstan 87.3 Mtoe per year Dr. Rajendra Singh Thakur/ E3ne6rgy
  • 37.
    Indian scenario •RECOVERABLE RESERVES = 28.8 THOUSAND MTOE • PRODUCTION = 361 MTOE PER YEAR • Coal is the most abundant fossil fuel resource in India, which is the world’s third largest coal Dr. Rajendra Singh Thakur/ E3ne7rgy producer. • The principal deposits of hard coal are in the eastern half of the country, ranging from Andhra Pradesh, bordering the Indian Ocean, to Arunachal Pradesh in the extreme northeast: the eastern States of Chhattisgarh, Jharkhand, Orissa and West Bengal together account for about 77% of reserves. • The Ministry of Coal (quoting the Geological Survey of India) states that at 1 April 2009, India’s geological resources of bituminous coal comprised 105.8 billion tonnes of ‘proved resources’, 123.5 billion tonnes of ‘indicated resources’ and 37.9 billion tonnes of ‘inferred resources’. • All-India resources of lignite are quoted in the 11th Five Year Plan as 38.27 billion tonnes as at 1 April 2006, with proved reserves put at 4.5 billion tonnes. About 2.4 billion tonnes in the Neyveli area of Tamil Nadu have been stated to be regarded as ‘mineable under the presently adopted mining parameters’. • Annual production of lignite is currently in the region of 32 million tonnes, almost all of which is used for electricity generation. • Although India’s coal reserves cover all ranks from lignite to bituminous, they tend to have a high ash content and a low calorific value. • The low quality of much of its coal prevents India from being anything but a small exporter of coal (traditionally to the neighbouring countries of Bangladesh, Nepal and Bhutan) and conversely, is responsible for sizeable imports., mainly from Australia, China, Indonesia and South Africa. • Coal is the most important source of energy for electricity generation in India: about three-quarters of electricity is generated by coal-fired power stations. • In addition, the steel, cement, fertiliser, chemical, paper and many other medium and small-scale industries are also major coal users.
  • 38.
    CRUDE OIL (PETROLIUM) Dr. Rajendra Singh Thakur/ E3ne8rgy • World scenario OIL RECOVERABLE RESERVES BY REGION Middle East & North Africa (52.4%) North America (12.8%) Latin America & The Caribbean (19.9%) South & Central Asia (2.2%) Africa (4.2%) Southeast Asia & Pacific (1.2%) East Asia (1.1%) Europe (6.3%) TOP OIL PRODUCING COUNTRIES Saudi Arabia 526 million tonnes per year Russia 509 million tonnes per year United States of 352 million tonnes per year America Iran 222 million tonnes per year China 204 million tonnes per year Venezuela 155 million tonnes per year Canada 148 million tonnes per year United Arab Emirates 138 million tonnes per year Kuwait 134 million tonnes per year Iraq 134 million tonnes per year
  • 39.
    Indian scenario •RECOVERABLE RESERVES = 800 MILLION TONNES • PRODUCTION = 38.2 MILLION TONNES PER YEAR • PRODUCTION RATIO = 21 YEARS • Total production of oil (including gas-plant liquids) has fluctuated in recent years within a range of 36-38 million tonnes per annum. In 2008, India produced 34.0 million tonnes of crude oil, plus about 2 million tonnes of natural gasoline and a similar tonnage of gas-plant LPGs, all of which was used internally. • Cairn Energy has made 25 discoveries in Rajasthan (in India’s northwest). Initial attention is being concentrated on the Mangala, Bhagyam and Aishwariya (MBA) oil fields. An eventual peak rate of 240 000 b/d is envisaged, subject to Government approval and additional investment. • India was the fourth largest consumer of oil and petroleum products after the United States, China, and Japan in 2011. It was also the fourth largest importer of oil and petroleum products. The high degree of dependence on imported crude oil has led Indian energy companies to attempt to diversify their supply sources. To this end, Indian national oil companies (NOCs) have purchased equity stakes in overseas oil and gas fields in South America, Africa, and the Caspian Sea region to acquire reserves and production capability. However, the majority of imports continue to come from the Middle East, where Indian companies have little direct access to investment. • According to the Oil & Gas Journal, India had 5.5 billion barrels of proved oil reserves at the end of 2012. About 53 percent of reserves are from onshore resources, while 47 percent are offshore reserves. Most reserves are found in the western part of India, particularly western offshore, Gujarat, and Rajasthan. The Assam-Arakan basin in the northeast part of the country is also an important oil-producing region and contains more than 10 percent of the country’s reserves Dr. Rajendra Singh Thakur/ E3ne9rgy
  • 40.
    NATURAL GAS •World scenario • PROVED AMOUNT IN PLACE = 219 THOUSAND MTOE • Natural gas is the cleanest and most efficient of the fossil fuels. For electricity generation, it has low investment costs and offers flexibility. But it is one of the less exploited fossil fuels, and could yet provide a significant contribution to reducing greenhouse gas emissions. • Over 100 countries hold reserves of natural gas, and it is estimated that the global total of known reserves is 186 trillion cubic metres. The largest reserves are situated in the Russian Federation, Islamic Republic of Iran and Qatar respectively. • Natural gas is a mixture of hydrocarbons, and often contains a small amount of non-hydrocarbons. It can exist either as a gas or in solution with crude oil, where producers can then separate the two in the production process. • All data represented in the graphs and charts on this website Dr. Rajendra Singh Thakur/ E4ne0rgy represents natural gas data only. • GAS RECOVERABLE RESERVES BY REGION • Middle East & North Africa (42.1%) • North America (4.9%) • Latin America & The Caribbean (3.6%) • South & Central Asia (15.5%) • Africa (2.9%) • Southeast Asia & Pacific (4.3%) • East Asia (1.5%)Europe (25.3%) TOP GAS PRODUCING COUNTRIES Russia = 576 Mtoe per year United States of 558 Mtoe per year America = Canada = 162 Mtoe per year Iran = 129 Mtoe per year Qatar = 100 Mtoe per year Norway = 88.7 Mtoe per year China = 88.3 Mtoe per year Saudi Arabia = 85.3 Mtoe per year Indonesia = 73.6 Mtoe per year Algeria = 72.7 Mtoe per year
  • 41.
    Indian scenario •RECOVERABLE RESERVES = 992MTOE • PRODUCTION = 39.6MTOE PER YEAR • PRODUCTION RATIO = 25YEARS • The Indian gas market is expected to be one of the fastest growing in the world Dr. Rajendra Singh Thakur/ E4ne1rgy over the next two decades. • IEA envisages gas demand to increase by 5.4% per annum over 2007-30 (IEA, 2009) reaching 132 bcm by 2030. • India’s primary energy supply is currently dominated by coal (37%), biomass and waste (27%) and oil (26%) while the share of natural gas is only 6%. • Production has been almost flat since 2002, at 30-32 bcm per year, but jumped to 46 bcm in 2009-2010. • Around three quarters of the gas production came from the Western offshore area. • Fields located in Gujarat, Assam and Andhra Pradesh are the major sources of onshore gas. • Smaller quantities of gas are also produced in Tamil Nadu, Tripura and Rajasthan.