Download as PDF, PPTX


![More data or better models?
[Banko and Brill, 2001]
Norvig: “Google does not
have better Algorithms,
only more Data”
Many features/
low-bias models](https://image.slidesharecdn.com/10lessons-141114132417-conversion-gate02/85/10-Lessons-Learned-from-Building-Machine-Learning-Systems-10-320.jpg)


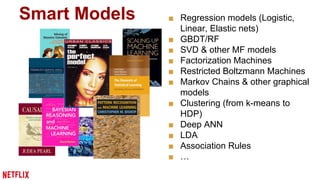
The document outlines 10 lessons learned from building machine learning systems at Netflix, emphasizing the trade-off between data quantity and model complexity. It highlights the importance of thoughtful training data selection, evaluation techniques, and the interplay between user interface and algorithms. Key recommendations include optimizing hyperparameters wisely, understanding model dependencies, and making data-driven product decisions.


![[기초개념] Graph Convolutional Network (GCN)](https://cdn.slidesharecdn.com/ss_thumbnails/agistdkimgcn190507-190507153736-thumbnail.jpg?width=640&height=640&fit=bounds)


![Big Data [sorry] & Data Science: What Does a Data Scientist Do?](https://cdn.slidesharecdn.com/ss_thumbnails/dslatcloudmsevent20130125-130126065651-phpapp01-thumbnail.jpg?width=640&height=640&fit=bounds)