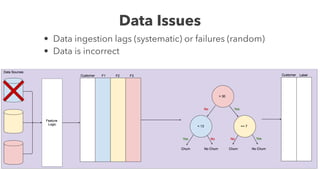
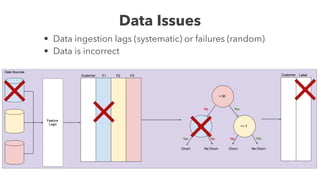
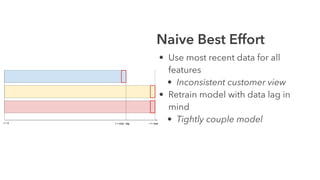
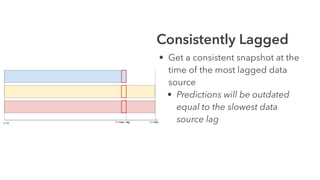
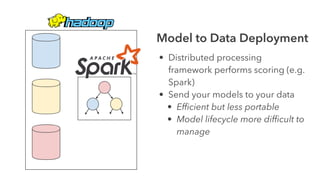
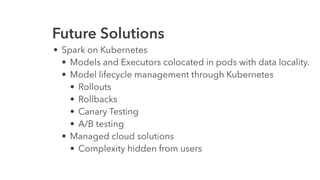
Machine Learning
Systems for Engineers
Where Data Science Meets
Engineering
Who Am I?
• I’m Cameron!
• LinkedIn - https://www.linkedin.com/in/cameron-joannidis/
• Twitter - @CamJo89
• Consult across a range of areas and have built many big data
and machine learning systems
• Buzz Word Bingo
• Big Data
• Machine Learning
• Functional Programming
Agenda
• Data
• Deployment
• Metrics
• Big Data Iteration Speed
Data
Example Use Case: Churn Prediction
We want to predict which users are likely to leave our service
soon so that we can try and give them reasons to stay
Training Data Creation
• Historical Data (need actual
churn events as examples)
• We know the labels at train time
• Produce Features to try and
predict the label

Train Our Model
• Minimise our loss function to
best predict our labels (Churn/
No Churn)
Prediction Time
• Jason’s red feature value > 30
Prediction Time
• Jason’s red feature value > 30
• Jason’s yellow feature value != 7
Prediction Time
• Jason’s red feature value > 30
• Jason’s yellow feature value != 7
• We predict Jason will churn
Moving to Production
Training
Pipeline
Training
Pipeline
Scoring
Pipeline
Data Issues
• Data ingestion lags (systematic) or failures (random)
• Data is incorrect
Data Issues
• Data ingestion lags (systematic) or failures (random)
• Data is incorrect
Before We Change the System
• Fix the data source if that’s and option
• Measure the importance of the feature in the model to
quantify the cost/effort
Naive Best Effort
• Use most recent data for all
features
• Inconsistent customer view
• Retrain model with data lag in
mind
• Tightly couple model
Consistently Lagged
• Get a consistent snapshot at the
time of the most lagged data
source
• Predictions will be outdated
equal to the slowest data
source lag
Imputation
• Fill in missing values with median
for numerical, mode for
continuous
• Every users experience is the
median experience? Not useful.
• Contextual Imputing (e.g. Median
male height for men, median
female height for women)
• Lots of custom model specific
code necessary
Graceful Model Degradation
• Model Specific fallback to give a
best guess from the distribution
given the current inputs
• Doesn't come out of the box in
most cases
Deployment
Data to Model Deployments
• Containerised model exposing
scoring API
• Clean and simple model
management semantics
• Send your data to your models
• Network shuffle costs can be
substantial for larger datasets
Model to Data Deployment
• Distributed processing
framework performs scoring (e.g.
Spark)
• Send your models to your data
• Efficient but less portable
• Model lifecycle more difficult to
manage

Future Solutions
• Spark on Kubernetes
• Models and Executors colocated in pods with data locality.
• Model lifecycle management through Kubernetes
• Rollouts
• Rollbacks
• Canary Testing
• A/B testing
• Managed cloud solutions
• Complexity hidden from users

Metrics
A Few ML System Metrics
• Data Distribution
• Effectiveness in Market
Data Distribution
Your training data will have some
distribution of labels
Data Distribution
•In production, your data distribution
may be significantly different
•This can happen over time as these
systems tend to be dynamic

Possible Causes
• Changes to the domain you're modelling
• Seasonality or external effects
• Changes to the customers themselves or the way the
customers are using your service
• Problems with the data collection pipelines (corrupted
data feeds etc)
Effectiveness in Market
• Production is the first real test
• Need to capture metrics to measure the effect of the
model for its intended purpose
• Paves the road towards;
• Effective A/B testing
• Incremental model improvement
• Measurability of ROI
Big Data Iteration Speed
Training Models on Big Data is Slow
• Not all algorithms scale linearly as data/model
complexity increases
• Hit computation/memory bottlenecks
• Number of hypothesis we can test is reduced
• Generating new features can become prohibitively
expensive
Stratified Sampling
Sampling History
Customer Subset Sampling
Know Where to Spend Your Time
• Bad performance on training data = Bias Problem
• Improve features
• More complex model
• Train longer
• Good performance on training data and bad
performance on test set = Variance Problem
• Get more data for training
• Regularisation
Choice of Framework / Technology
• Modelling in R/Python and rewriting in production in
Scala/Spark is an expensive process
• Choose a tech stack that allows engineers and data
scientists to work together and productionise things
quickly. Leads to faster feedback loops
What We’ve Covered
• Data issues can be be a central issue to ML systems are
require a lot of up front design thought
• There are several modes of deployment, each with
their own tradeoffs for different scenarios
• Production is not the end of the process for ML
models. Metrics are a fundamental part of enabling
improvement and growth.
• Ways to improve iteration speed on ML projects
Thank You
Questions?

Machine learning systems for engineers

  • 1.
    Machine Learning Systems forEngineers Where Data Science Meets Engineering
  • 2.
    Who Am I? •I’m Cameron! • LinkedIn - https://www.linkedin.com/in/cameron-joannidis/ • Twitter - @CamJo89 • Consult across a range of areas and have built many big data and machine learning systems • Buzz Word Bingo • Big Data • Machine Learning • Functional Programming
  • 4.
    Agenda • Data • Deployment •Metrics • Big Data Iteration Speed
  • 5.
  • 6.
    Example Use Case:Churn Prediction We want to predict which users are likely to leave our service soon so that we can try and give them reasons to stay
  • 7.
    Training Data Creation •Historical Data (need actual churn events as examples) • We know the labels at train time • Produce Features to try and predict the label

  • 8.
    Train Our Model •Minimise our loss function to best predict our labels (Churn/ No Churn)
  • 9.
    Prediction Time • Jason’sred feature value > 30
  • 10.
    Prediction Time • Jason’sred feature value > 30 • Jason’s yellow feature value != 7
  • 11.
    Prediction Time • Jason’sred feature value > 30 • Jason’s yellow feature value != 7 • We predict Jason will churn
  • 12.
  • 13.
  • 14.
  • 15.
    Data Issues • Dataingestion lags (systematic) or failures (random) • Data is incorrect
  • 16.
    Data Issues • Dataingestion lags (systematic) or failures (random) • Data is incorrect
  • 17.
    Before We Changethe System • Fix the data source if that’s and option • Measure the importance of the feature in the model to quantify the cost/effort
  • 18.
    Naive Best Effort •Use most recent data for all features • Inconsistent customer view • Retrain model with data lag in mind • Tightly couple model
  • 19.
    Consistently Lagged • Geta consistent snapshot at the time of the most lagged data source • Predictions will be outdated equal to the slowest data source lag
  • 20.
    Imputation • Fill inmissing values with median for numerical, mode for continuous • Every users experience is the median experience? Not useful. • Contextual Imputing (e.g. Median male height for men, median female height for women) • Lots of custom model specific code necessary
  • 21.
    Graceful Model Degradation •Model Specific fallback to give a best guess from the distribution given the current inputs • Doesn't come out of the box in most cases
  • 22.
  • 23.
    Data to ModelDeployments • Containerised model exposing scoring API • Clean and simple model management semantics • Send your data to your models • Network shuffle costs can be substantial for larger datasets
  • 24.
    Model to DataDeployment • Distributed processing framework performs scoring (e.g. Spark) • Send your models to your data • Efficient but less portable • Model lifecycle more difficult to manage

  • 25.
    Future Solutions • Sparkon Kubernetes • Models and Executors colocated in pods with data locality. • Model lifecycle management through Kubernetes • Rollouts • Rollbacks • Canary Testing • A/B testing • Managed cloud solutions • Complexity hidden from users

  • 26.
  • 27.
    A Few MLSystem Metrics • Data Distribution • Effectiveness in Market
  • 28.
    Data Distribution Your trainingdata will have some distribution of labels
  • 29.
    Data Distribution •In production,your data distribution may be significantly different •This can happen over time as these systems tend to be dynamic

  • 30.
    Possible Causes • Changesto the domain you're modelling • Seasonality or external effects • Changes to the customers themselves or the way the customers are using your service • Problems with the data collection pipelines (corrupted data feeds etc)
  • 31.
    Effectiveness in Market •Production is the first real test • Need to capture metrics to measure the effect of the model for its intended purpose • Paves the road towards; • Effective A/B testing • Incremental model improvement • Measurability of ROI
  • 32.
  • 33.
    Training Models onBig Data is Slow • Not all algorithms scale linearly as data/model complexity increases • Hit computation/memory bottlenecks • Number of hypothesis we can test is reduced • Generating new features can become prohibitively expensive
  • 34.
  • 35.
  • 36.
  • 37.
    Know Where toSpend Your Time • Bad performance on training data = Bias Problem • Improve features • More complex model • Train longer • Good performance on training data and bad performance on test set = Variance Problem • Get more data for training • Regularisation
  • 38.
    Choice of Framework/ Technology • Modelling in R/Python and rewriting in production in Scala/Spark is an expensive process • Choose a tech stack that allows engineers and data scientists to work together and productionise things quickly. Leads to faster feedback loops
  • 39.
    What We’ve Covered •Data issues can be be a central issue to ML systems are require a lot of up front design thought • There are several modes of deployment, each with their own tradeoffs for different scenarios • Production is not the end of the process for ML models. Metrics are a fundamental part of enabling improvement and growth. • Ways to improve iteration speed on ML projects
  • 40.
  • 41.