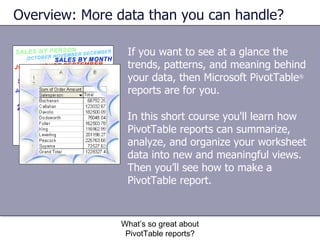
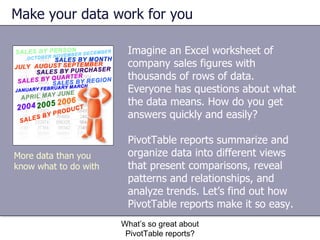
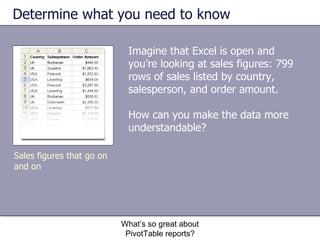
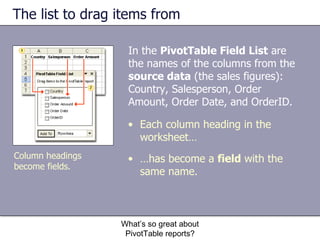
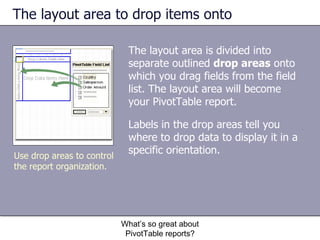
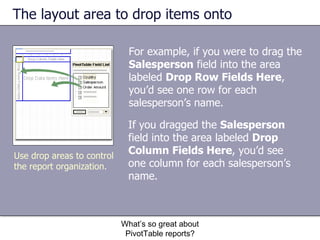
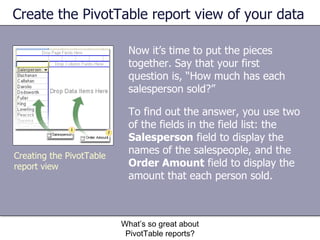
This document provides an overview of a training course on creating PivotTable reports in Microsoft Excel. It discusses how PivotTables can summarize and analyze large amounts of data by allowing users to pivot and rearrange fields to gain insights. The document outlines the steps to create a PivotTable report, including using the PivotTable wizard to select fields from source data and drag them into a layout area to build the report view. An example is provided of creating a PivotTable to summarize sales figures by dragging salesperson and order amount fields to show total sales by each person.