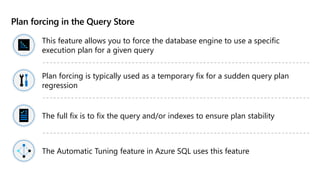
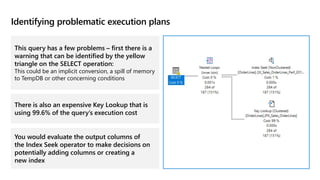
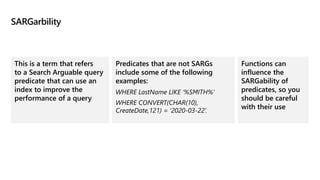
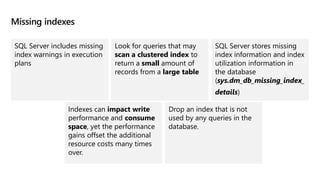
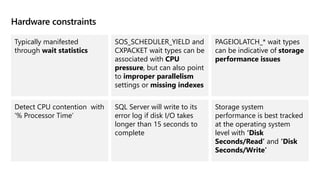
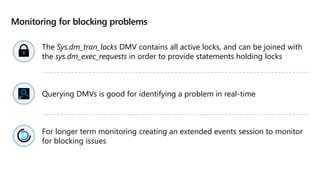
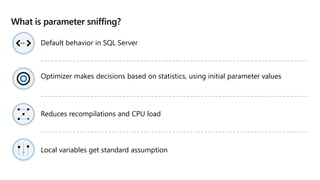
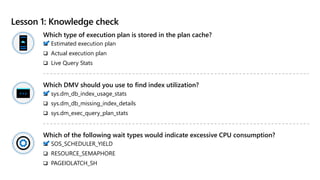
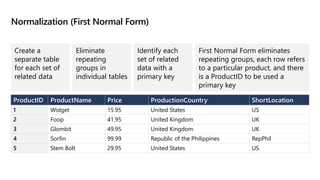
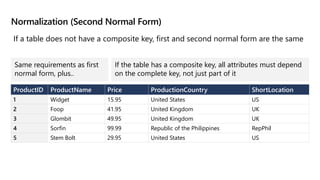
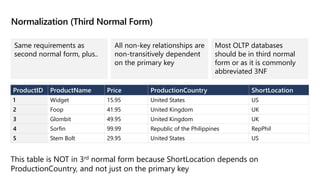
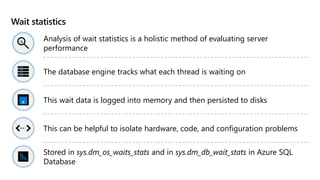
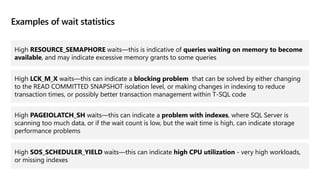
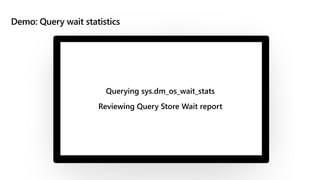
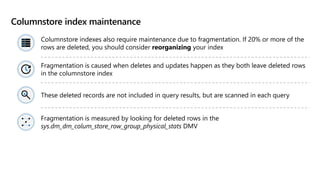
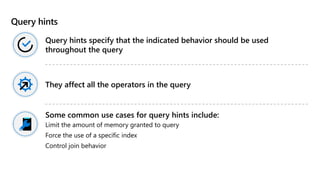
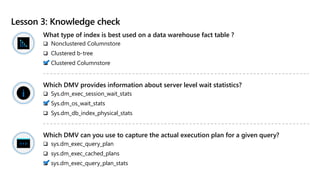
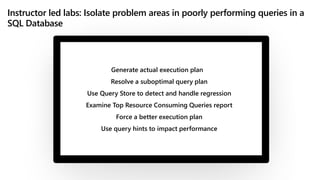
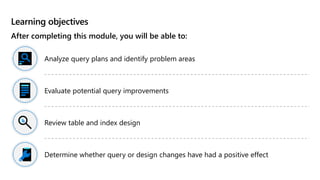
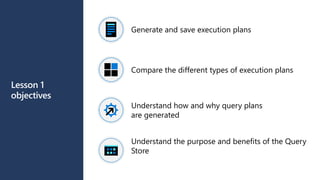
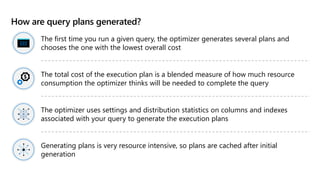
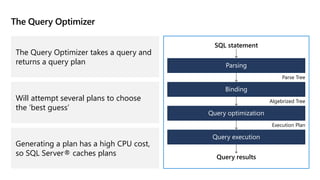
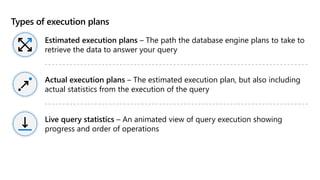
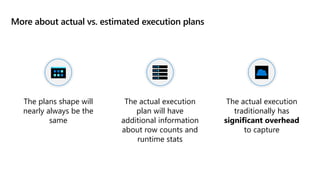
This document provides an overview of Module 5: Optimize query performance in Azure SQL. The module contains 3 lessons that cover analyzing query plans, evaluating potential improvements, and reviewing table and index design. Lesson 1 explores generating and comparing execution plans, understanding how plans are generated, and the benefits of the Query Store. Lesson 2 examines database normalization, data types, index types, and denormalization. Lesson 3 describes wait statistics, tuning indexes, and using query hints. The lessons aim to help administrators optimize query performance in Azure SQL.
Microsoft Azure Redis Cache is based on the popular open source Redis Cache. It gives you access to a secure, dedicated Redis cache, managed by Microsoft. A cache created using Azure Redis Cache is accessible from any application within Microsoft Azure.
This presentation discusses Windows Azure Blob Storage, covering from the Windows Azure Storage Overview, Blob Storage Basic Concept, Blob Storage Advanced, and finally the Tip of the day.
This is part 1 of the Azure storage series, where we will build our understanding of Azure Storage, and will also learn about the storage data services, and the types of Azure Storage. Last but not least, we will also touch base on securing storage accounts
In the second part, we will continue with our demo on creating and utilizing the Azure Storage.
Oracle Data Guard ensures high availability, disaster recovery and data protection for enterprise data. This enable production Oracle databases to survive disasters and data corruptions. Oracle 18c and 19c offers many new features it will bring many advantages to organization.
Amazon Relational Database Service (Amazon RDS) is a web service that makes it easier to set up, operate, and scale a relational database in the cloud. It provides cost-efficient, re-sizable capacity for an industry-standard relational database and manages common database administration tasks
Scaling Data Analytics Workloads on DatabricksDatabricks
Imagine an organization with thousands of users who want to run data analytics workloads. These users shouldn’t have to worry about provisioning instances from a cloud provider, deploying a runtime processing engine, scaling resources based on utilization, or ensuring their data is secure. Nor should the organization’s system administrators.
In this talk we will highlight some of the exciting problems we’re working on at Databricks in order to meet the demands of organizations that are analyzing data at scale. In particular, data engineers attending this session will walk away with learning how we:
Manage a typical query lifetime through the Databricks software stack
Dynamically allocate resources to satisfy the elastic demands of a single cluster
Isolate the data and the generated state within a large organization with multiple clusters
Azure SQL Database (SQL DB) is a database-as-a-service (DBaaS) that provides nearly full T-SQL compatibility so you can gain tons of benefits for new databases or by moving your existing databases to the cloud. Those benefits include provisioning in minutes, built-in high availability and disaster recovery, predictable performance levels, instant scaling, and reduced overhead. And gone will be the days of getting a call at 3am because of a hardware failure. If you want to make your life easier, this is the presentation for you.
Microsoft Azure is an ever-expanding set of cloud services to help your organization meet your business challenges. It’s the freedom to build, manage, and deploy applications on a massive, global network using your favorite tools and frameworks.
Productive
Reduce time to market, by delivering features faster with over 100 end-to-end services.
Hybrid
Develop and deploy where you want, with the only consistent hybrid cloud on the market. Extend Azure on-premises with Azure Stack.
Intelligent
Create intelligent apps using powerful data and artificial intelligence services.
Trusted
Join startups, governments, and 90 percent of Fortune 500 businesses who run on the Microsoft Cloud today.
Advanced Load Balancer/Traffic Manager and App Gateway for Microsoft AzureKemp
While Azure provides native load balancing capabilities, our KEMP Virtual LoadMaster (VLM) significantly improves on these via advance features like application delivery and load balancing in Layer 7 of the network stack. Other features that KEMP VLM delivers for Azure based and hybrid infrastructure deployments are:
- Client authentication and single sign-on (SSO) High Performance Layer 4 & Layer 7 Application Load Balancing
- Intelligent Global Site Traffic Distribution
- Application Health Checking
- IP and Layer 7 Persistence
- Content Switching
- SSL Acceleration and Offload
- Compression
- Caching
- Advanced App Gateway Services
- Provide better Load Balancing over the Internal Load Balancer
- Sophisticated Traffic Manager
https://kemptechnologies.com/solutions/microsoft-load-balancing/loadmaster-azure/
https://azure.microsoft.com/en-us/marketplace/partners/kemptech/vlm-azure/
RDX takes a deeper look at some of the most popular and interesting features within Azure SQL DB in addition to how the DBaaS platform differs from its on-premises and IaaS counterparts.
The presentation covers a wide range of topics from purchasing and provisioning to geo-replication, sharding and advanced automations. The demo presented by Azure SQL DB Specialist, Jim Donahoe, will provide best practices and educate participants in Azure SQL DB features and the Azure Portal's administration and monitoring interfaces.
State, Local and Education customers are using the AWS cloud to enable faster disaster recovery of their mission critical IT systems without incurring the infrastructure expense of a second physical site. Join us for an informative webinar on how AWS cloud supports many popular disaster recovery (DR) architectures from “pilot light” environments that are ready to scale up at a moment’s notice to “hot standby” environments that enable rapid failover. With infrastructure centers in 10 regions around the world, AWS provides a set of cloud-based DR services that enable rapid recovery of your IT infrastructure and data.
Amazon EC2 provides a broad selection of instance types to accommodate a diverse mix of workloads. In this session, we provide an overview of the Amazon EC2 instance platform, key features, and the concept of instance generations.
This presentation features the fundamentals of SQL tunning like SQL Processing, Optimizer and Execution Plan, Accessing Tables, Performance Improvement Consideration Partition Technique. Presented by Alphalogic Inc : https://www.alphalogicinc.com/
Antes de migrar de 10g a 11g o 12c, tome en cuenta las siguientes consideraciones. No es tan sencillo como simplemente cambiar de motor de base de datos, se necesita hacer consideraciones a nivel del aplicativo.
The presentation helps to introduce the key aspects of the Oracle Optimizer and how you find out what it's up to and how you can influence its decisions.
In this first of a series of presentations, we'll overview the differences between SQL and PL/SQL, and the first steps in optimization, as understanding RULE vs. COST, and how to slash 90% response time in data extractions running in SQL*Plus.
Slack (or Teams) Automation for Bonterra Impact Management (fka Social Soluti...Jeffrey Haguewood
Sidekick Solutions uses Bonterra Impact Management (fka Social Solutions Apricot) and automation solutions to integrate data for business workflows.
We believe integration and automation are essential to user experience and the promise of efficient work through technology. Automation is the critical ingredient to realizing that full vision. We develop integration products and services for Bonterra Case Management software to support the deployment of automations for a variety of use cases.
This video focuses on the notifications, alerts, and approval requests using Slack for Bonterra Impact Management. The solutions covered in this webinar can also be deployed for Microsoft Teams.
Interested in deploying notification automations for Bonterra Impact Management? Contact us at sales@sidekicksolutionsllc.com to discuss next steps.
JMeter webinar - integration with InfluxDB and GrafanaRTTS
Watch this recorded webinar about real-time monitoring of application performance. See how to integrate Apache JMeter, the open-source leader in performance testing, with InfluxDB, the open-source time-series database, and Grafana, the open-source analytics and visualization application.
In this webinar, we will review the benefits of leveraging InfluxDB and Grafana when executing load tests and demonstrate how these tools are used to visualize performance metrics.
Length: 30 minutes
Session Overview
-------------------------------------------
During this webinar, we will cover the following topics while demonstrating the integrations of JMeter, InfluxDB and Grafana:
- What out-of-the-box solutions are available for real-time monitoring JMeter tests?
- What are the benefits of integrating InfluxDB and Grafana into the load testing stack?
- Which features are provided by Grafana?
- Demonstration of InfluxDB and Grafana using a practice web application
To view the webinar recording, go to:
https://www.rttsweb.com/jmeter-integration-webinar
Accelerate your Kubernetes clusters with Varnish CachingThijs Feryn
A presentation about the usage and availability of Varnish on Kubernetes. This talk explores the capabilities of Varnish caching and shows how to use the Varnish Helm chart to deploy it to Kubernetes.
This presentation was delivered at K8SUG Singapore. See https://feryn.eu/presentations/accelerate-your-kubernetes-clusters-with-varnish-caching-k8sug-singapore-28-2024 for more details.
UiPath Test Automation using UiPath Test Suite series, part 4DianaGray10
Welcome to UiPath Test Automation using UiPath Test Suite series part 4. In this session, we will cover Test Manager overview along with SAP heatmap.
The UiPath Test Manager overview with SAP heatmap webinar offers a concise yet comprehensive exploration of the role of a Test Manager within SAP environments, coupled with the utilization of heatmaps for effective testing strategies.
Participants will gain insights into the responsibilities, challenges, and best practices associated with test management in SAP projects. Additionally, the webinar delves into the significance of heatmaps as a visual aid for identifying testing priorities, areas of risk, and resource allocation within SAP landscapes. Through this session, attendees can expect to enhance their understanding of test management principles while learning practical approaches to optimize testing processes in SAP environments using heatmap visualization techniques
What will you get from this session?
1. Insights into SAP testing best practices
2. Heatmap utilization for testing
3. Optimization of testing processes
4. Demo
Topics covered:
Execution from the test manager
Orchestrator execution result
Defect reporting
SAP heatmap example with demo
Speaker:
Deepak Rai, Automation Practice Lead, Boundaryless Group and UiPath MVP
Let's dive deeper into the world of ODC! Ricardo Alves (OutSystems) will join us to tell all about the new Data Fabric. After that, Sezen de Bruijn (OutSystems) will get into the details on how to best design a sturdy architecture within ODC.
PHP Frameworks: I want to break free (IPC Berlin 2024)Ralf Eggert
In this presentation, we examine the challenges and limitations of relying too heavily on PHP frameworks in web development. We discuss the history of PHP and its frameworks to understand how this dependence has evolved. The focus will be on providing concrete tips and strategies to reduce reliance on these frameworks, based on real-world examples and practical considerations. The goal is to equip developers with the skills and knowledge to create more flexible and future-proof web applications. We'll explore the importance of maintaining autonomy in a rapidly changing tech landscape and how to make informed decisions in PHP development.
This talk is aimed at encouraging a more independent approach to using PHP frameworks, moving towards a more flexible and future-proof approach to PHP development.
Dev Dives: Train smarter, not harder – active learning and UiPath LLMs for do...UiPathCommunity
💥 Speed, accuracy, and scaling – discover the superpowers of GenAI in action with UiPath Document Understanding and Communications Mining™:
See how to accelerate model training and optimize model performance with active learning
Learn about the latest enhancements to out-of-the-box document processing – with little to no training required
Get an exclusive demo of the new family of UiPath LLMs – GenAI models specialized for processing different types of documents and messages
This is a hands-on session specifically designed for automation developers and AI enthusiasts seeking to enhance their knowledge in leveraging the latest intelligent document processing capabilities offered by UiPath.
Speakers:
👨🏫 Andras Palfi, Senior Product Manager, UiPath
👩🏫 Lenka Dulovicova, Product Program Manager, UiPath
DevOps and Testing slides at DASA ConnectKari Kakkonen
My and Rik Marselis slides at 30.5.2024 DASA Connect conference. We discuss about what is testing, then what is agile testing and finally what is Testing in DevOps. Finally we had lovely workshop with the participants trying to find out different ways to think about quality and testing in different parts of the DevOps infinity loop.
GDG Cloud Southlake #33: Boule & Rebala: Effective AppSec in SDLC using Deplo...James Anderson
Effective Application Security in Software Delivery lifecycle using Deployment Firewall and DBOM
The modern software delivery process (or the CI/CD process) includes many tools, distributed teams, open-source code, and cloud platforms. Constant focus on speed to release software to market, along with the traditional slow and manual security checks has caused gaps in continuous security as an important piece in the software supply chain. Today organizations feel more susceptible to external and internal cyber threats due to the vast attack surface in their applications supply chain and the lack of end-to-end governance and risk management.
The software team must secure its software delivery process to avoid vulnerability and security breaches. This needs to be achieved with existing tool chains and without extensive rework of the delivery processes. This talk will present strategies and techniques for providing visibility into the true risk of the existing vulnerabilities, preventing the introduction of security issues in the software, resolving vulnerabilities in production environments quickly, and capturing the deployment bill of materials (DBOM).
Speakers:
Bob Boule
Robert Boule is a technology enthusiast with PASSION for technology and making things work along with a knack for helping others understand how things work. He comes with around 20 years of solution engineering experience in application security, software continuous delivery, and SaaS platforms. He is known for his dynamic presentations in CI/CD and application security integrated in software delivery lifecycle.
Gopinath Rebala
Gopinath Rebala is the CTO of OpsMx, where he has overall responsibility for the machine learning and data processing architectures for Secure Software Delivery. Gopi also has a strong connection with our customers, leading design and architecture for strategic implementations. Gopi is a frequent speaker and well-known leader in continuous delivery and integrating security into software delivery.
Smart TV Buyer Insights Survey 2024 by 91mobiles.pdf91mobiles
91mobiles recently conducted a Smart TV Buyer Insights Survey in which we asked over 3,000 respondents about the TV they own, aspects they look at on a new TV, and their TV buying preferences.
1. Module 5: Optimize query
performance in Azure SQL
Introduction to Query Store, Execution Plans, Indexes, and Query Tuning
DP-300 Administering Microsoft Azure
SQL Solutions
2. Learning objectives
After completing this module, you will be able to:
Analyze query plans and identify problem areas
Evaluate potential query improvements
Review table and index design
Determine whether query or design changes have had a positive effect
4. Lesson 1
objectives
Generate and save execution plans
Compare the different types of execution plans
Understand how and why query plans
are generated
Understand the purpose and benefits of the Query
Store
5. What are execution plans?
Every time you execute a query, the query optimizer uses a path of operations to
process your query and retrieve any results
The optimizer also collects statistics about the operation and execution of this plan
After being generated by the optimizer, query plans are cached in an area of
memory called the plan cache
Stored internally as XML
6. How are query plans generated?
The first time you run a given query, the optimizer generates several plans and
chooses the one with the lowest overall cost
The total cost of the execution plan is a blended measure of how much resource
consumption the optimizer thinks will be needed to complete the query
The optimizer uses settings and distribution statistics on columns and indexes
associated with your query to generate the execution plans
Generating plans is very resource intensive, so plans are cached after initial
generation
7. The Query Optimizer
The Query Optimizer takes a query and
returns a query plan
Will attempt several plans to choose
the ‘best guess’
Generating a plan has a high CPU cost,
so SQL Server® caches plans
SQL statement
Parsing
Parse Tree
Binding
Algebrized Tree
Query optimization
Execution Plan
Query execution
Query results
8. Types of execution plans
Estimated execution plans – The path the database engine plans to take to
retrieve the data to answer your query
Actual execution plans – The estimated execution plan, but also including
actual statistics from the execution of the query
Live query statistics – An animated view of query execution showing
progress and order of operations
9. More about actual vs. estimated execution plans
The plans shape will
nearly always be the
same
The actual execution
plan will have
additional information
about row counts and
runtime stats
The actual execution
traditionally has
significant overhead
to capture
10. Capturing plans in Management Studio
SQL Server Management Studio allows you
to capture both estimated and actual
execution plans, and Live Query Statistics
Plan capture can also be enabled by
keyboard commands
You can capture a text query plan by using
the SET SHOWPLAN ON option
11. Lightweight query profiling
Supported by Azure SQL Database
Required trace flag 7412 to be enabled globally, prior to SQL Server 2019
Newer releases allow it to be enabled at the query level
Provides additional statistics to help close gap to actual execution plan data
12. How to read an execution plan
Plans should be read from right to left and top to bottom
The size of the arrows connecting the objects is representative of the amount of
data flowing to the next operator
Each operator contains a lot of metadata in its properties and tool tip. This is where
you can learn how the decisions were made
All operators are assigned a cost
Even operators that have a 0% cost have some degree of cost—nothing is free in
SQL Server query execution
13. Example: SQL query with a JOIN clause
SELECT [stockItemName],
[UnitPrice] * [QuantityPerOuter] AS CostPerOuterBox,
[QuantityonHand]
FROM [Warehouse].[StockItems] s
JOIN [Warehouse].[StockItemHoldings] sh ON s.StockItemID = sh.StockItemID
ORDER BY CostPerOuterBox;
15. Common plan operators: Finding data
Index Seek – Reads the portion of the index which contains the
needed data
Index Scan – Reads the entire index for the needed data
Table Scan – Reads the entire table for the needed data
Key Lookup – Looks up values row by row for values which are
missing from the index used
Table Valued Function – Executes a table valued function within
the database
16. Common plan operators: Filtering & sorting
Nested Loops – Performs inner, outer, semi and anti semi joins. Performs
search on the inner table for each row of the outer table
Hash Match – Creates a hash for required columns for each row. Then
creates a hash for second table and finds matches
TOP – Returns the specified top number of rows
Sort – Sorts the incoming rows
Stream Aggregate – Groups rows by one or more columns and
calculates one or more aggregate expressions
17. Demo: Reading an execution plan
Generate a query execution plan
Reading a query execution plan
18. Dynamic management objects
Dynamic Manage Views and Functions supply data about database
performance and state
These objects may be scoped at the database or server level
Azure SQL Database has some of its own DMVs to provide Azure specific
data at the database level
All objects are in the sys schema and following the naming convention
sys.dm_*
19. Query Store
Introduced in SQL Server 2016, this data collection tool tracks query
execution plans and runtime statistics
Can help you quickly identity queries that have regressed in performance
Allows you to easily identity the most expensive queries in your database
Available in Azure SQL Database and Azure SQL Managed Instances
A version of the Query Store is available in Azure Database for MySQL and
Azure Database for PostgreSQL
20. Query Store cont’d
Common scenarios:
• Detecting regressed queries
• Determining the number of times a query was executed in a given time window
• Comparing the average execution time of a query across time windows to see large
deltas
Enabled by default for new Azure SQL Database databases, not enabled for
ALTER DATABASE <dbname> SET QUERY_STORE = ON (OPERATION_MODE = READ_WRITE);
21. Query Store reports
The Query Store includes several reports
built into SQL Server Management Studio
These reports can be filtered by a range
of time, allowing you to identity
performance issues that happened
in the past
These reports can also help you identity a
problematic change in execution plans
leading to a performance regression
22. Performance overhead of Query Store
Any monitoring system has some degree of observer overhead to
capture data
The query store has been developed with performance in mind and has
relatively low overheard
The query store allows adjusting of collection parameters to reduce data
collection on particularly busy systems
23. Plan forcing in the Query Store
This feature allows you to force the database engine to use a specific
execution plan for a given query
Plan forcing is typically used as a temporary fix for a sudden query plan
regression
The full fix is to fix the query and/or indexes to ensure plan stability
The Automatic Tuning feature in Azure SQL uses this feature
25. Identifying problematic execution plans
This query has a few problems – first there is a
warning that can be identified by the yellow
triangle on the SELECT operation:
This could be an implicit conversion, a spill of memory
to TempDB or other concerning conditions
There is also an expensive Key Lookup that is
using 99.6% of the query’s execution cost
You would evaluate the output columns of
the Index Seek operator to make decisions on
potentially adding columns or creating a
new index
26. SARGarbility
This is a term that refers
to a Search Arguable query
predicate that can use an
index to improve the
performance of a query
Predicates that are not SARGs
include some of the following
examples:
WHERE LastName LIKE ‘%SMITH%’
WHERE CONVERT(CHAR(10),
CreateDate,121) = ‘2020-03-22’.
Functions can
influence the
SARGability of
predicates, so you
should be careful
with their use
27. Missing indexes
SQL Server includes missing
index warnings in execution
plans
Look for queries that may
scan a clustered index to
return a small amount of
records from a large table
SQL Server stores missing
index information and index
utilization information in
the database
(sys.dm_db_missing_index_
details)
Indexes can impact write
performance and consume
space, yet the performance
gains offset the additional
resource costs many times
over.
Drop an index that is not
used by any queries in the
database.
28. Hardware constraints
Typically manifested
through wait statistics
SOS_SCHEDULER_YIELD and
CXPACKET wait types can be
associated with CPU
pressure, but can also point
to improper parallelism
settings or missing indexes
PAGEIOLATCH_* wait types
can be indicative of storage
performance issues
Detect CPU contention with
‘% Processor Time’
SQL Server will write to its
error log if disk I/O takes
longer than 15 seconds to
complete
Storage system
performance is best tracked
at the operating system
level with ‘Disk
Seconds/Read’ and ‘Disk
Seconds/Write’
29. Statistics
Having up to date column
and index statistics allows
for the query optimizer to
make the best possible
execution plan decisions
SQL Server, Azure SQL
Database and Managed
Instance default to auto-
updating statistics
In some cases, you may
want to update statistics
more frequently to ensure
consistent performance for
your queries
Use sys.dm_db_stats_properties to see the
last time statistics were updated and the
number of modifications that have been
made since the last update
Auto-update statistics uses a dynamic
percentage, which as the table grows, the
percentage of row modifications that was
required to trigger a statistics update gets
smaller
30. Blocking and locking in SQL Server
Databases lock records and block other transactions as part of their
normal behavior and their consistency model
SQL Server uses a process called lock escalation to reduce the impact of
these locks, taking low level locks and only escalating as needed
Blocking activity can be problematic in two main scenarios:
Poor transaction handling in application code (leaving transactions open for too long)
Transactions taking too long to complete because of poor indexing or external operations
like linked server queries
31. Isolation levels
SQL Server offers multiple isolation levels to allow for a balance of
concurrency and data quality
Isolation levels are specified at the session level, but may be overridden by
the query
Lower isolation like Read Uncommitted may allow for more users to read
the data, but increase the chance that the queries return incorrect results
32. Monitoring for blocking problems
The Sys.dm_tran_locks DMV contains all active locks, and can be joined with
the sys.dm_exec_requests in order to provide statements holding locks
Querying DMVs is good for identifying a problem in real-time
For longer term monitoring creating an extended events session to monitor
for blocking issues
33. What is parameter sniffing?
Default behavior in SQL Server
Optimizer makes decisions based on statistics, using initial parameter values
Reduces recompilations and CPU load
Local variables get standard assumption
34. Lesson 1: Knowledge check
Which type of execution plan is stored in the plan cache?
Estimated execution plan
Actual execution plan
Live Query Stats
Which DMV should you use to find index utilization?
sys.dm_db_index_usage_stats
sys.dm_db_missing_index_details
sys.dm_exec_query_plan_stats
Which of the following wait types would indicate excessive CPU consumption?
SOS_SCHEDULER_YIELD
RESOURCE_SEMAPHORE
PAGEIOLATCH_SH
35. Instructor led labs: Identify and resolve blocking issues
Run blocked queries report
Enable Read Commit Snapshot isolation level
Evaluate performance improvements
37. Lesson 2
objectives
Explore normal forms and how they affect
database design
Choose appropriate datatypes for your data
Evaluate appropriate index types
38. Normalization (First Normal Form)
Create a
separate table
for each set of
related data
Eliminate
repeating
groups in
individual tables
Identify each
set of related
data with a
primary key
First Normal Form eliminates
repeating groups, each row refers
to a particular product, and there
is a ProductID to be used a
primary key
ProductID ProductName Price ProductionCountry ShortLocation
1 Widget 15.95 United States US
2 Foop 41.95 United Kingdom UK
3 Glombit 49.95 United Kingdom UK
4 Sorfin 99.99 Republic of the Philippines RepPhil
5 Stem Bolt 29.95 United States US
39. Normalization (Second Normal Form)
If a table does not have a composite key, first and second normal form are the same
Same requirements as first
normal form, plus..
If the table has a composite key, all attributes must depend
on the complete key, not just part of it
ProductID ProductName Price ProductionCountry ShortLocation
1 Widget 15.95 United States US
2 Foop 41.95 United Kingdom UK
3 Glombit 49.95 United Kingdom UK
4 Sorfin 99.99 Republic of the Philippines RepPhil
5 Stem Bolt 29.95 United States US
40. Normalization (Third Normal Form)
Same requirements as
second normal form, plus..
All non-key relationships are
non-transitively dependent
on the primary key
Most OLTP databases
should be in third normal
form or as it is commonly
abbreviated 3NF
ProductID ProductName Price ProductionCountry ShortLocation
1 Widget 15.95 United States US
2 Foop 41.95 United Kingdom UK
3 Glombit 49.95 United Kingdom UK
4 Sorfin 99.99 Republic of the Philippines RepPhil
5 Stem Bolt 29.95 United States US
This table is NOT in 3rd normal form because ShortLocation depends on
ProductionCountry, and not just on the primary key
41. Denormalization
Denormalized database
designs are commonly
used in data warehouses
and data mart
This is helpful for reducing
the number of joins
required for reporting, but
is less effective for updates
Two examples of
denormalized structures
are star (shown below)
and snowflake schemas
42. Understand data types for performance
Importantly, ensure that the data types in your application code match the
data types in your database tables
Conversions are expensive, and can cause much more expensive
execution plans
In general, smaller data types are better where possible
Data compression can help with this
43. Unicode data
Normal data types use 1 byte per character
The problem with this is that the data type can only represent about 256 characters
Unicode types use 2 bytes per character and can support up to 65,536 patterns
Unicode data is needed for Cyrillic languages, Asian languages and many symbols
45. Designing indexes
Cluster key values should be sequential (an increasing integer key is a good
example here)
Clustered Indexes should be as narrow (minimal columns) as possible
In nonclustered index keys, the most selective column should be the leftmost
column in the key
Use included columns in your nonclustered indexes where possible, to keep keys
narrower
You should not create redundant indexes and avoid creating unused indexes on
your tables
46. Clustered indexes
A clustered index sorts and stores the data in a table based on key values
There can only be one clustered index per table, since rows can only be
stored in one order
Clustered indexes are frequently the primary key for a table
Clustered indexes have no uniqueness requirement
47. What are nonclustered indexes?
Nonclustered indexes are secondary indexes used to help the performance of
queries not served by the clustered index
You can create multiple nonclustered indexes on a table
You can also create filtered indexes, for tables with large data skew
The cost of nonclustered indexes is space and insert/update performance
48. Nonclustered indexes
Each page in an index b-tree is a called an
index node, and the top node of b-tree is
called the root node.
The bottom nodes in an index are called
leaf nodes and the collection of leaf nodes
is the leaf level.
49. Columnstore indexes
Data is stored in columns, not rows
This allows for higher levels of compression, which reduces storage and memory footprint
of data
Columns that are not referenced in a query are not scanned, giving reducing the amount of
I/O needed
Best used in large tables (e.g., data warehouse fact tables, temporal history tables)
Clustered columnstore must include all columns of the table
Use clustered columnstore index for fact tables and large dimension tables for DW
workloads. Use nonclustered columnstore index to perform analysis in real time on an OLTP
workloads
51. Lesson 2: Knowledge check
What type of database design should you use for a data warehouse when you want to
reduce the data volume of your dimensions?
Star Schema
3rd normal form
Snowflake schema
What is the minimum number rows do you need to bulk insert into a columnstore index?
1,000,000
102,400
1000
Which compression type offers the highest level of compression?
Page Compression
Row Compression
Columnstore Archival
52. Instructor led labs: Identify database design issues
Examine the query and identify the problem
Identify ways to fix the warning message
Improve the code
55. Wait statistics
Analysis of wait statistics is a holistic method of evaluating server
performance
The database engine tracks what each thread is waiting on
This wait data is logged into memory and then persisted to disks
This can be helpful to isolate hardware, code, and configuration problems
Stored in sys.dm_os_waits_stats and in sys.dm_db_wait_stats in Azure SQL
Database
56. Examples of wait statistics
High RESOURCE_SEMAPHORE waits—this is indicative of queries waiting on memory to become
available, and may indicate excessive memory grants to some queries
High LCK_M_X waits—this can indicate a blocking problem that can be solved by either changing
to the READ COMMITTED SNAPSHOT isolation level, or making changes in indexing to reduce
transaction times, or possibly better transaction management within T-SQL code
High PAGEIOLATCH_SH waits—this can indicate a problem with indexes, where SQL Server is
scanning too much data, or if the wait count is low, but the wait time is high, can indicate storage
performance problems
High SOS_SCHEDULER_YIELD waits—this can indicate high CPU utilization - very high workloads,
or missing indexes
58. Index tuning
methodology
Identify expensive
queries, using the
Query Store or
Extended Events
profiling
Examine the query
plans for those
queries
Test changes to
indexes to evaluate
improvements in I/O
and elapsed time
Implement changes
in production
59. Index tuning
The goal is faster queries using the fewest indexes and IOs
Common tuning approach:
• Evaluate existing index usage - sys.dm_db_index_operational_stats and
sys.dm_db_index_usage_stats
• Eliminate unused and duplicate indexes
• Review and evaluate expensive queries from the Query Store or Extended Events and
refactor where appropriate
• Create the index(s) in a non-production environment and test query execution and
performance
• Deploy the changes to production
60. Index maintenance
Over time, inserts, updates and deletes can cause fragmentation in an index
Fragmentation causes the data to occupy more pages than it otherwise would
Fragmentation can cause query performance degradation
Indexes should be regularly reorganized or rebuilt
SQL Server and Azure SQL Database allow for indexes to rebuilt online
Newer versions of SQL Server allow resumable index operations
Stored in the DMV Sys.dm_db_index_physical_stats
61. Index maintenance
Reorganization
Rebuilding
• Defragments an index by physically
reordering the leaf-level index pages to
match the logical sorted order of the leaf
nodes
• Compacts the index pages based on the
index’s fill factor setting
• It is an online process
• Drops and recreates the pages of the
index
• Causes the statistics to be updated
• Use when fragmentation is greater than
30%
• It can be either online or offline
62. Columnstore index maintenance
Columnstore indexes also require maintenance due to fragmentation. If 20% or more of the
rows are deleted, you should consider reorganizing your index
Fragmentation is caused when deletes and updates happen as they both leave deleted rows
in the columnstore index
These deleted records are not included in query results, but are scanned in each query
Fragmentation is measured by looking for deleted rows in the
sys.dm_dm_colum_store_row_group_physical_stats DMV
63. Query hints
Query hints specify that the indicated behavior should be used
throughout the query
They affect all the operators in the query
Some common use cases for query hints include:
Limit the amount of memory granted to query
Force the use of a specific index
Control join behavior
64. Lesson 3: Knowledge check
What type of index is best used on a data warehouse fact table ?
Nonclustered Columnstore
Clustered b-tree
Clustered Columnstore
Which DMV provides information about server level wait statistics?
Sys.dm_exec_session_wait_stats
Sys.dm_os_wait_stats
Sys.dm_db_index_physical_stats
Which DMV can you use to capture the actual execution plan for a given query?
sys.dm_exec_query_plan
sys.dm_exec_cached_plans
sys.dm_exec_query_plan_stats
65. Instructor led labs: Isolate problem areas in poorly performing queries in a
SQL Database
Generate actual execution plan
Resolve a suboptimal query plan
Use Query Store to detect and handle regression
Examine Top Resource Consuming Queries report
Force a better execution plan
Use query hints to impact performance
66. Module summary
Explore query
performance
optimization:
Understand how plans are
generated
Understand query plan
warnings and guidance
Explore the Query Store
Types of query execution plans
Explore performance-
based database design:
Learn the concepts of database
normalization
Choosing the proper data types
for your database
Understand the types of indexes
in SQL Server
Evaluating performance
improvements:
Capturing data from dynamic
management views and
functions
Understand wait statistics
Understand index and
statistics maintenance
67. References
SQL Server Execution plans:
https://www.red-gate.com/simple-talk/books/sql-server-execution-plans-third-edition-by-grant-
fritchey/
Monitoring performance by using the Query Store:
https://docs.microsoft.com/sql/relational-databases/performance/monitoring-performance-by-
using-the-query-store
Query processing architecture guide:
https://docs.microsoft.com/sql/relational-databases/query-processing-architecture-guide
Index architecture and design:
https://docs.microsoft.com/sql/relational-databases/sql-server-index-design-guide