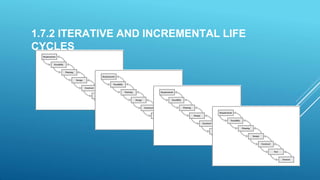
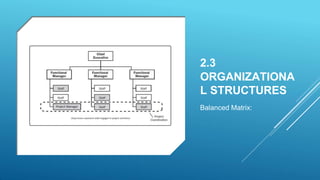
1.7.1
PREDICTIV
E LIFE
CYCLES
1.7.2 ITERATIVE AND INCREMENTAL LIFE
CYCLES
1.7.3 ADAPTIVE LIFE CYCLES
(AGILE)
3 weeks
3 weeks
3 weeks
3 weeks
3 weeks
3 weeks
3 weeks
1.7.4
PROJECT
LIFE
CYCLES
VARIABLES
1.8 PROJECT
MANAGEMEN
T PROCESS
INTERACTION
S
1.10
PROJECT
INFORMATIO
N
2.3
ORGANIZATIONA
L STRUCTURES
Functional
2.3
ORGANIZATIONA
L STRUCTURES
Weak Matrix:
2.3
ORGANIZATIONA
L STRUCTURES
Balanced Matrix:
2.3
ORGANIZATIONA
L STRUCTURES
Strong Matrix:
2.3
ORGANIZATIONA
L STRUCTURES
Projectized:
2.3
ORGANIZATIONA
L STRUCTURES
2.4
PROJECT
INFLUENCE
S
2.4.1
ORGANIZATIONAL
PROCESS ASSETS
(OPA)
Corporate/Organizational Knowledge
Base
-Financial databases.
-Historical information and lessons
learned knowledge bases
-Issue and defect management
databases
- Process measurement databases
- Project files from previous projects
2.4.2 ENTERPRISE
ENVIRONMENTAL FACTORS
3.2 ROLE OF THE PROJECT
MANAGER
Interpersonal
Skills
Leadership Political and Cultural
awareness
Motivation Trust Building
Influencing Coaching
3.4 PROJECT
STAKEHOLDERS
PROJECT MANAGEMENT PLAN VS. PROJECT
DOCUMENTS
••
••
•
••
••
Requ irements
Descriptio n
Logi
Business Need, I
J ustification
Create M inunum
Viable Program
Dm111tyN.
Department
W BS
Sp,
ecificatlon Design 1es t
' l
E
lem ent rcases
2 8 nislled 1001
Ei
nlsl led FinJslJ"!:I
3 i I
n Progress
Security Officer l 2.
2 No ed Not Started
Dmltrly N. Content 3 Not Started ed
Cootent
•
Finished
Forget Password Unk
to
I
Landing Page
'
I Create Minimum
w Viable Program
eam
Dmitrly N. Content
Log Out Link
A must-have starting
point for a chent.
Dm1
tr1y N. Content
Welcome Email Sequence
Forsecurity reasons
we need to log out
users.
Control ed ed
Unsubscrlbe Link
A must
·
have initial
Informationafter
' urchase
Required by anti·
spam act.
nP age
Project
Objective
Requested
B
y
1002,
1
003
Ei
D
s
ll
ed
T
echnicalCo ntro t Start
Not S tart
C h
ants need way
access protected
content
t will gre atly reduce
t orkload of support
Create Mi
nimum
Viabl
e Progra m
Create Minimum
Viable Program
Create Minimum
Viabl e Progra m
Email Se rv
i ce
Pr ovider
Not Start Not S tart
Create Mi
nimum
Viable Program
WBS
EXAMPLE
WBS
5.4.3 CREATE WBS:
OUTPUTS
• Project scope statement
• WBS
• Work Package
• WBS dictionary
2. Project Documents Updates
1. Scope Baseline
5.4.3
CREAT
E WBS:
OUTPUTS
PRODUCT
BACKLOG
PRODUCT
VS SPRINT
BACKLOG
AGIL
E CONCEPTS
FOR
SCOP
E
MANAGEMEN
T
 User Story: It is a stakeholder need or requirement. It has
a description about the needs, and acceptance criteria to
know if the deliverable meets the requirements. Another
name is backlog items.
6.3.2
SEQUENC
E
ACTIVITIE
S: TOOLS
AND
TECHNIQUE
S
1. Precedence Diagramming Method (PDM)
 Finish-to-start (FS). An activity must finish before
the successor can start. This is the most
commonly used relationship. Example: You
must finish digging a hole before you can start the
next activity of planting a tree.
 Finish-to-finish (FF). An activity must finish
before the successor can finish. Example: You
must finish testing
documentation.
before you can finish
6.3.2
SEQUENC
E
ACTIVITIE
S: TOOLS
AND
TECHNIQUE
S
1. Precedence Diagramming Method (PDM)
 Start-to-start (SS). An activity must start before
the successor can start. Example: You must
start designing and wait for two weeks’ lag in
order to have enough of the design
completed to start coding.
 Start-to-finish (SF). An activity must start before
the successor can finish. This dependency is
rarely used.
6.3.2
SEQUENCE
ACTIVITIES:
TOOLS AND
TECHNIQUE
S
6.3.2 SEQUENCE ACTIVITIES: TOOLS AND
TECHNIQUES
Arrow Diagram Method (ADM)
6.3.3
SEQUENC
E
ACTIVITIE
S:
OUTPUTS
1. Project Schedule Network Diagrams
T-SHIRT SIZING
EXAMPLE
T-SHIRT SIZING
EXAMPLE
After you with your team
identity the main features you
should break down the main
features in smaller components
called User Stories.
T-SHIRT SIZING
EXAMPLE
Next step
:
Classify
each user story as you
did with the main
features. You can use
the same t-shirt size
s
based on complexity
for each user story.
PLANNIN
G POKER
Planning poker: (also called Scrum poker) helps agile teams
estimate the time and effort needed to complete each initiative
on their product backlog. The name from this gamified
technique is planning poker because participants use physical
cards. These cards, which look like playing cards, estimate
the number of story points for each backlog story or task up
for discussion.
PLANNING
POKER
How Does Planning Poker Work?
 Planning poker brings together stakeholders from
across departments in the organization to reach a
consensus on the estimated effort needed for
several backlog initiatives. For an agile software
organization, stakeholders can include a product
owner, developers, UX designers, QA testers, and
product managers, among others.
6.5.2 DEVELOP SCHEDULE: TOOLS
AND TECHNIQUES
1. Schedule Network Analysis
2. Critical Path Method
 It is the longest path(s) in the
network diagram. By definition all
the activities in the critical path
have zero float.
6.5.2 DEVELOP
SCHEDULE: TOOLS
AND TECHNIQUES
Resource Optimization Techniques
Schedule Compression
 Fast Tracking
 Crashing
Agile Release Planning
Agile projects are often divided into
releases and iterations (sprints). An
iteration is a short, timeboxed
developed period, typically one to four
weeks in duration. A release is a group of
iterations that results in the
completion of a valuable deliverable on the
project. An agile project will have one or
more releases, each of which will contain
one or more iterations.
6.5.2 DEVELOP SCHEDULE: TOOLS
AND TECHNIQUES
6.5.2
DEVELOP
SCHEDULE:
TOOLS AND
TECHNIQUES
Agile Release Planning
6.5.3 DEVELOP
SCHEDULE:
OUTPUTS
1. Schedule Baseline
2. Project Schedule
 Bar Charts
 Milestone Charts
 Project schedule network diagram
6.6.2 CONTROL
SCHEDULE:
TOOLS AND
TECHNIQUES
Example of a Burndown Chart:
7.3.3 DETERMINE BUDGET:
OUTPUTS
7.4.2 CONTROL COSTS: TOOLS AND
TECHNIQUES
8.1.2 PLAN
QUALITY
MANAGEMENT
: TOOLS AND
TECHNIQUES
Cost of Quality (COQ)
8.2.2 MANAGE
QUALITY:
TOOLS AND
TECHNIQUES
8.2.2 MANAGE QUALITY: TOOLS
AND TECHNIQUES
8.2.2 MANAGE QUALITY: TOOLS AND
TECHNIQUES
Pareto Diagram
Histogra
m
8.2.2 MANAGE QUALITY: TOOLS AND
TECHNIQUES
Control Chart
Scatter Diagram
8.2.2 MANAGE QUALITY: TOOLS AND
TECHNIQUES Flow
Chart
Serve rice
Fill pan with water
Heat pan on stove
No
Yes
Add rice
Drain pan into sieve
Is the water
boiling?
Reduce heat to low,
cook for 15 minutes
How to boil rice
8.2.2 MANAGE QUALITY: TOOLS AND
TECHNIQUES Run
Chart
 Checklist
 Check sheets
 Statistical Sampling
 Questionnaires and Surveys
2. Data Analysis
 Performance Reviews
 Root-cause analysis
3. Inspection
8.3.2 CONTROL QUALITY: TOOLS
AND TECHNIQUES
1. Data Gathering
9.1.2 PLANRESOURCE
MANAGEMENT: TOOLS AND
TECHNIQUES
1. Expert Judgment
2. Data Representation
9.1.2 PLAN RESOURCE MANAGEMENT: TOOLS
AND
TECHNIQUES
RBS Example
(Resource Breakdown
Structure)
9.1.2 PLAN RESOURCE MANAGEMENT: TOOLS
AND
TECHNIQUES
OBS Example (Organizational Breakdown
Structure)
9.1.2 PLAN RESOURCE MANAGEMENT: TOOLS
AND TECHNIQUES
2. Data Representation (RACI)
9.1.2 PLAN RESOURCE MANAGEMENT: TOOLS
AND TECHNIQUES
Organizational Theory: (Maslow’s Hierarchy of needs)
9.1.2 PLAN RESOURCE MANAGEMENT: TOOLS
AND TECHNIQUES
Organizational Theory: (McGregor, Theory X and Theory Y)
9.2.3 ESTIMATE ACTIVITY RESOURCES:
OUTPUTS
RBS
Example
9.4.2 DEVELOP TEAM: TOOLS AND
TECHNIQUES Dreyfus Model of Adult Skill
Acquisition
10.1.2 PLAN COMMUNICATIONS
MANAGEMENT:
TOOLS AND TECHNIQUES
4. Communication Model
11.1.3 PLANRISK MANAGEMENT:
OUTPUTS
11.1.3 PLANRISK MANAGEMENT:
OUTPUTS
11.1.3 PLANRISK MANAGEMENT:
OUTPUTS
Probability Impact Matrix:
11.2.3 IDENTIFY RISKS:
OUTPUTS
1. RiskRegister
List of identified risks
Potential risk owners
List of potential responses
ID Risk Trigger Event Cause Impact Owner Response Plan
1 Infrastructure
team is not
available
when needed.
Predecessor
tasks not
completed on
time
Operating
System
Upgrade
delayed
Equipment
was not
delivered
on time
Schedule
delay
Brown Compress the
schedule by
beginning tasks in
the next milestone
while working on
operating system
upgrade
11.3.2 PERFORM QUALITATIVE RISK
ANALYSIS:
TOOLS AND TECHNIQUES
Probability & Impact Assessment (Example)
11.4.2 PERFORM QUANTITATIVE RISK
ANALYSIS: TOOLS AND TECHNIQUES
Simulations(Monte Carlo) Example:
11.4.2 PERFORM QUANTITATIVE RISK
ANALYSIS: TOOLS AND TECHNIQUES
Sensitivity Analysis Example:
11.4.2 PERFORM QUANTITATIVE RISK
ANALYSIS: TOOLS AND TECHNIQUES
Decision Tree
Analysis
Example:
11.5.2 PLAN RISK RESPONSES: TOOLS
AND TECHNIQUES
12.1.1 PLAN
PROCUREMENT
MANAGEMENT:INPUTS
5. Enterprise Environmental Factors
6. Organizational Process Assets
• Fixed-price contracts (FFP, FPIFC, FP-EPA)
• Cost-reimbursable contracts (CPFF, CPIF, CPAF, CPF or CPPC)
• Time and Material Contracts (T&M)
13.1.2 IDENTIFY STAKEHOLDERS: TOOLS
AND TECHNIQUES
13.2.2 PLAN STAKEHOLDER ENGAGEMENT: TOOLS
AND TECHNIQUES
- C indicates the current engagement.
- D indicates the desired engagement.
12.1.1 PLAN
PROCUREMENT
MANAGEMENT:
INPUTS
Risk and Contract
Types

Pmp Complete Diagrams