Download as PDF, PPTX

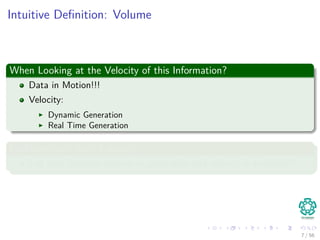
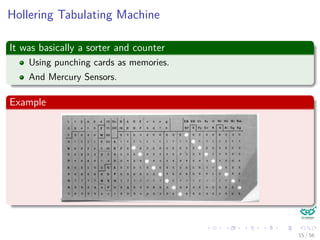
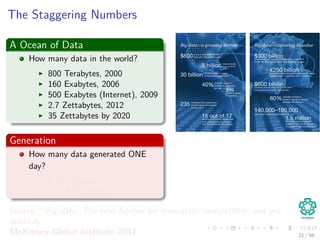
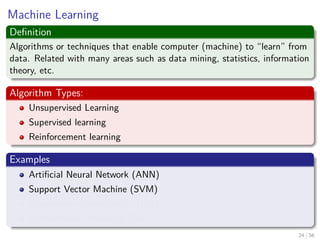
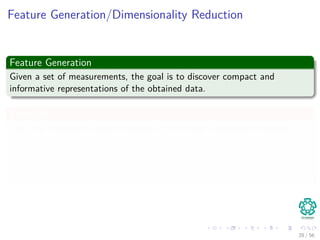
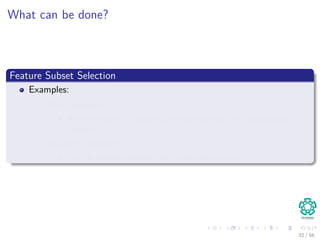
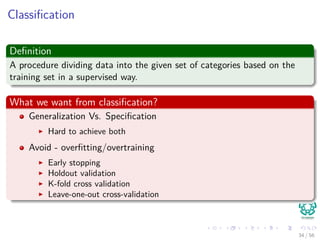
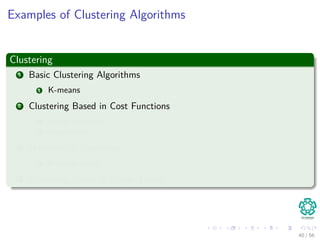
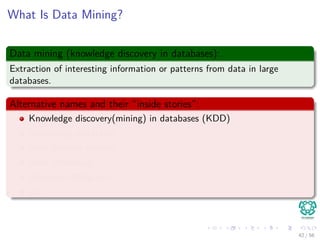
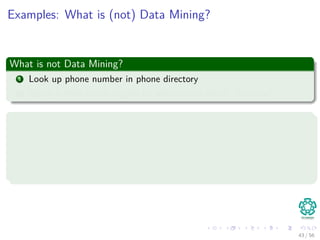
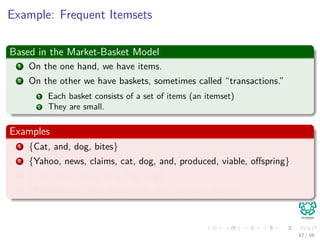
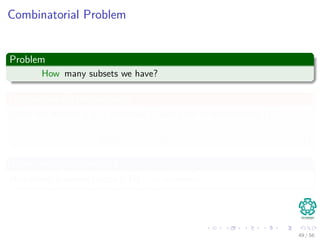
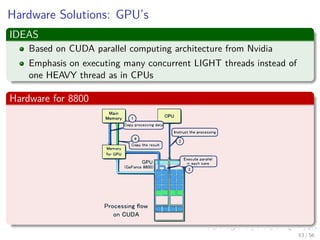
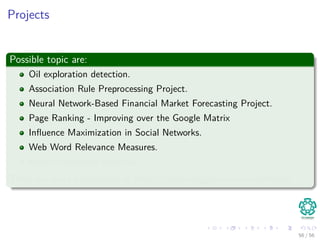
![For example
Imagine that I have a stream of m = 1025
integers with Ranges from
[a1, ..., an] with n = 10, 000, 000
Now, somebody ask you to find the most frequent item!!!
A naive algorithm
1 Take hash table with a counter.
2 Then, put numbers in the hash table.
Problems
Which problems we have?
8 / 56](https://image.slidesharecdn.com/01introduction-151212034726/85/01-Machine-Learning-Introduction-19-320.jpg)
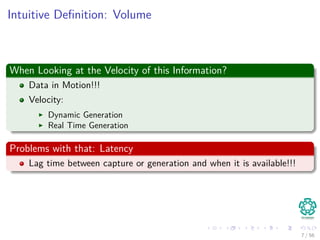
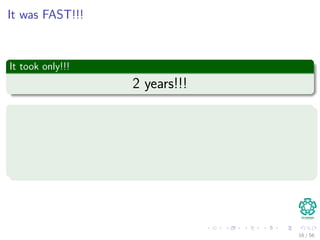
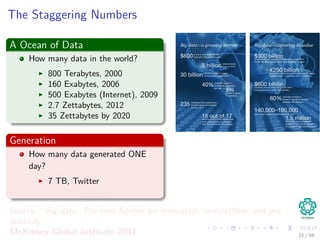
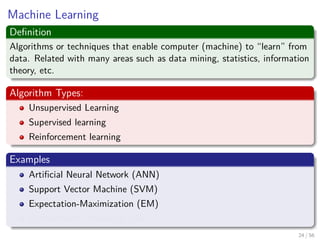
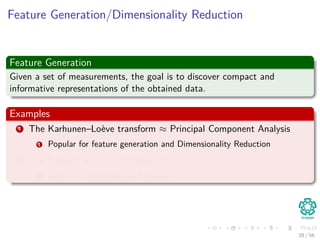
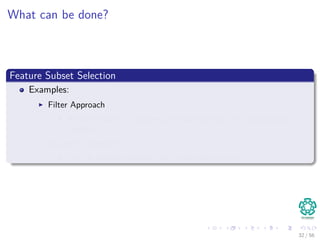
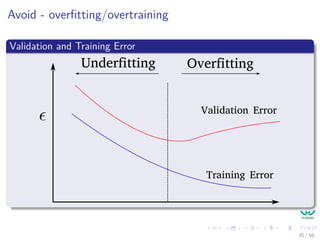
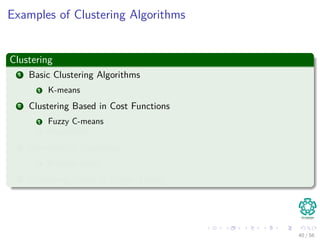
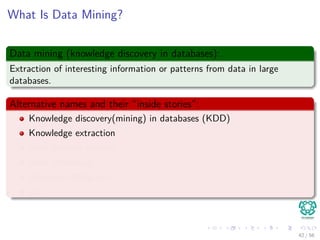
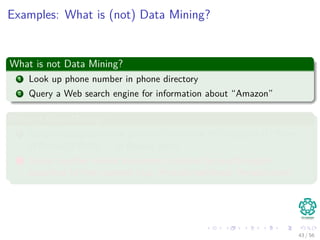
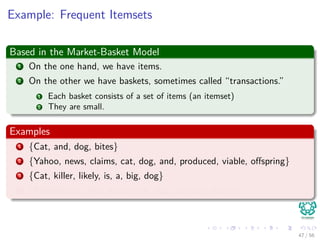
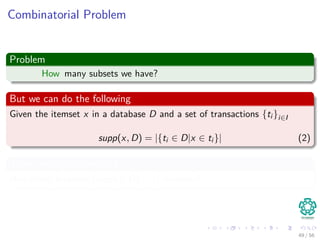
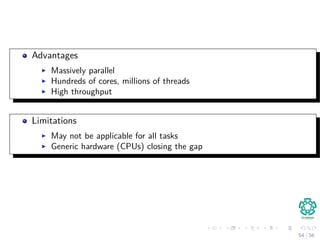
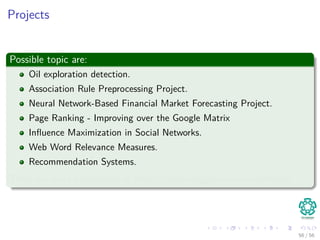
![For example
Imagine that I have a stream of m = 1025
integers with Ranges from
[a1, ..., an] with n = 10, 000, 000
Now, somebody ask you to find the most frequent item!!!
A naive algorithm
1 Take hash table with a counter.
2 Then, put numbers in the hash table.
Problems
Which problems we have?
8 / 56](https://image.slidesharecdn.com/01introduction-151212034726/85/01-Machine-Learning-Introduction-20-320.jpg)
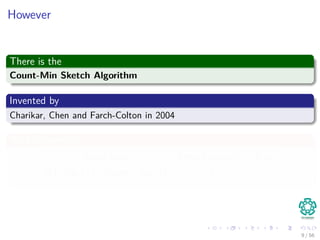
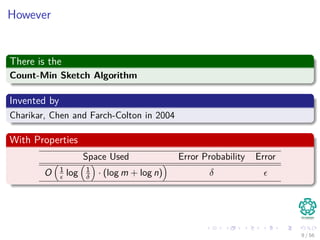
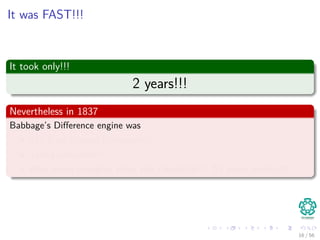
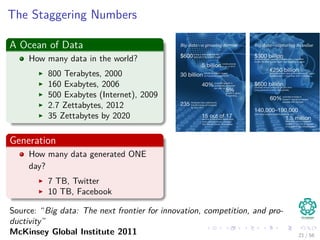
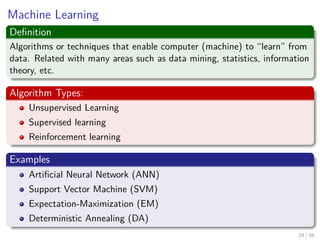
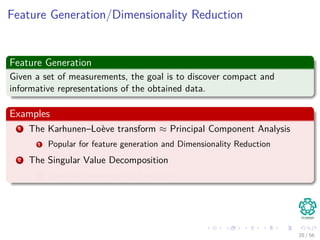
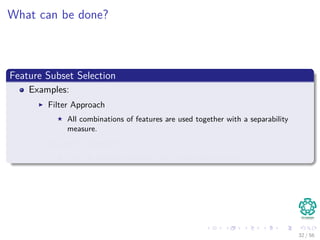
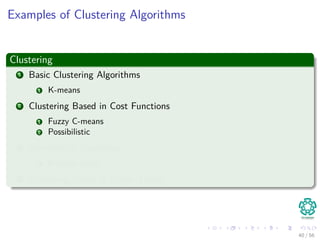
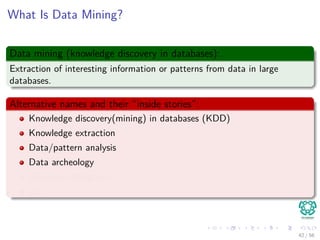
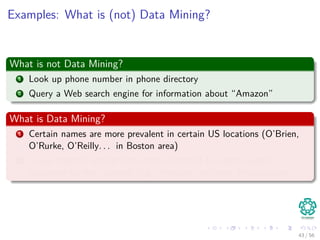
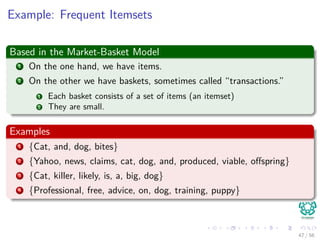
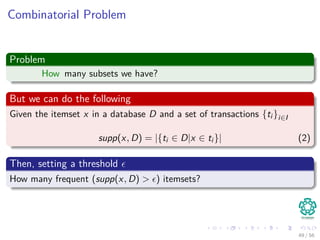
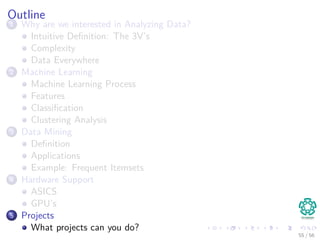
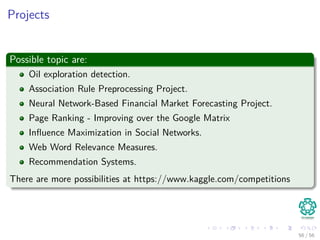
![For example
Imagine that I have a stream of m = 1025
integers with Ranges from
[a1, ..., an] with n = 10, 000, 000
Now, somebody ask you to find the most frequent item!!!
A naive algorithm
1 Take hash table with a counter.
2 Then, put numbers in the hash table.
Problems
Which problems we have?
8 / 56](https://image.slidesharecdn.com/01introduction-151212034726/85/01-Machine-Learning-Introduction-21-320.jpg)


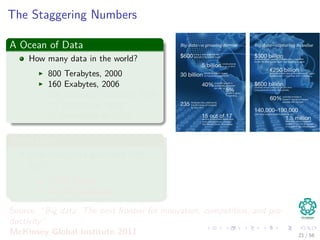
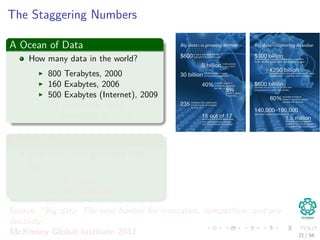
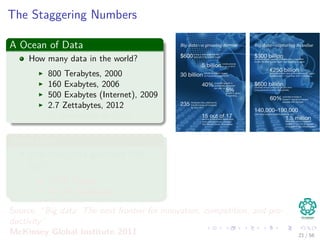


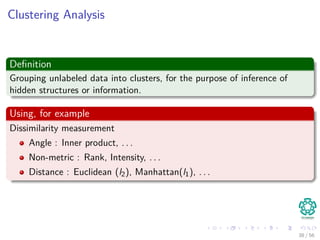
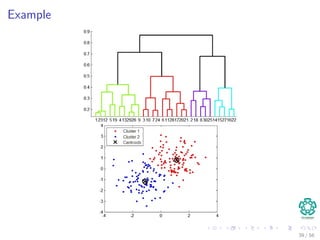
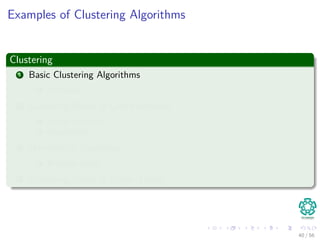
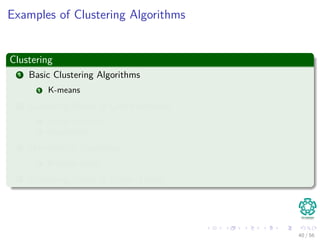


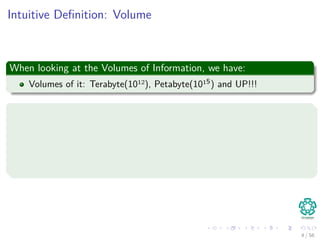
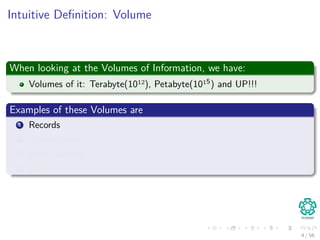
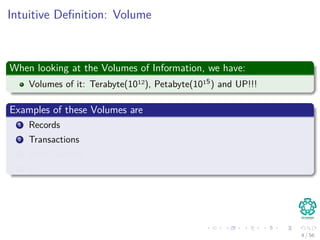
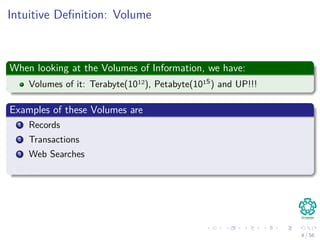
The document provides an overview of machine learning and data mining, highlighting the importance of analyzing large volumes of data characterized by the 3V's: volume, variety, and velocity. It discusses various applications of data mining, introduces concepts like classification and clustering, and mentions hardware support for processing data. Additionally, it reflects on historical challenges in data processing and outlines the staggering quantities of data generated daily, emphasizing the growing need for effective data analysis methods.


![[系列活動] 資料探勘速遊](https://cdn.slidesharecdn.com/ss_thumbnails/0114ycchendmquicktour-170110050658-thumbnail.jpg?width=640&height=640&fit=bounds)