Downloaded 372 times
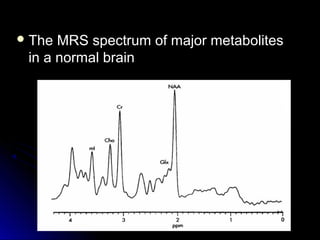
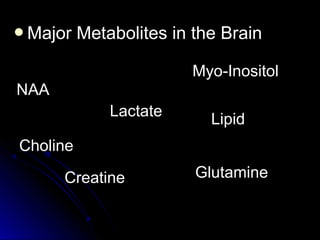
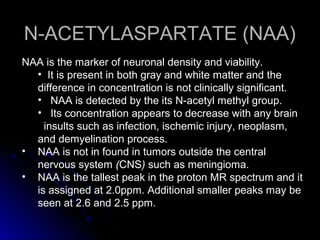
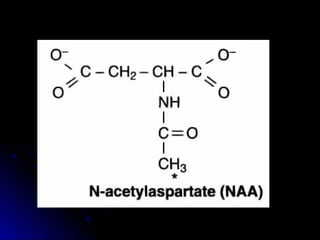

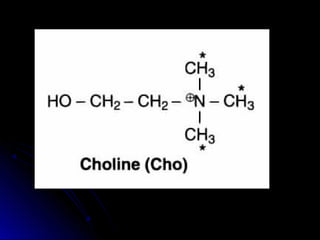


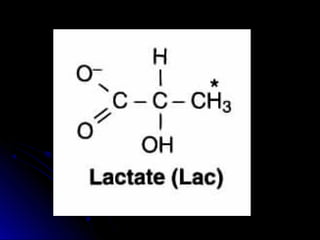
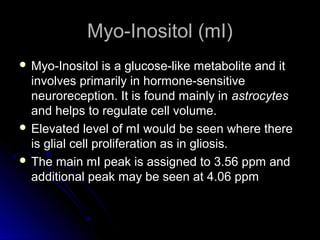


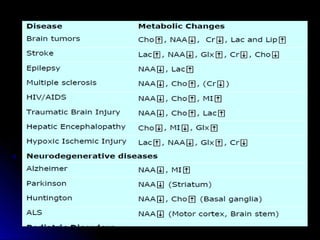
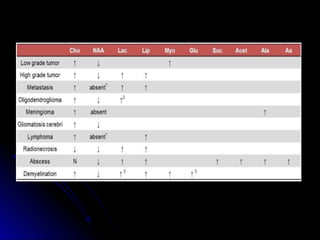
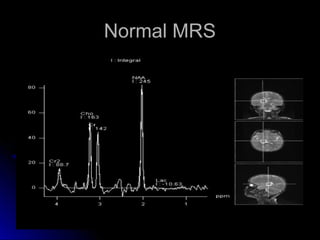
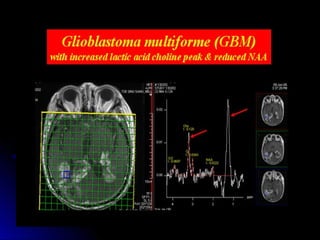
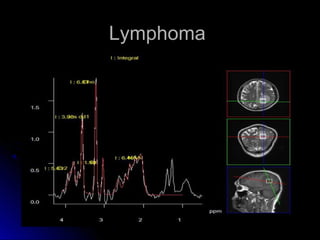
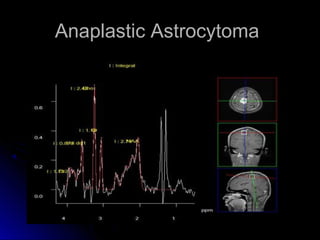
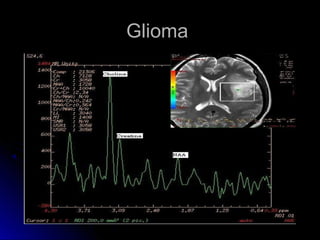


This document provides information on MR spectroscopy (MRS), a noninvasive technique used to assess biochemical and metabolic processes in the brain. It discusses the major metabolites that are detectable by MRS in the normal brain, including N-acetylaspartate (NAA), choline, creatine, lactate, myo-inositol, lipids, and glutamate/glutamine. The document also describes the chemical shifts of these metabolites and how their levels may change in various brain diseases or conditions. It concludes by outlining different MRS acquisition modes such as single voxel spectroscopy and chemical shift imaging.


