Downloaded 2,460 times


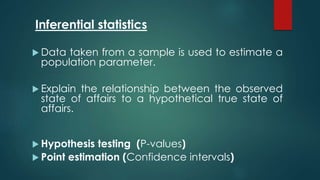


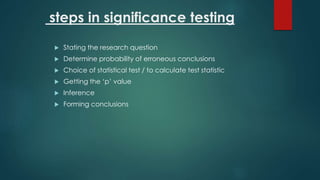

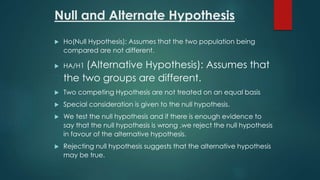
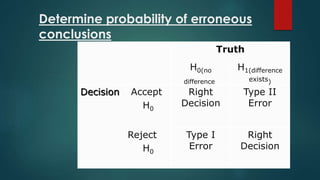
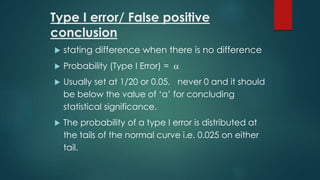
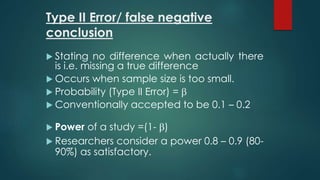

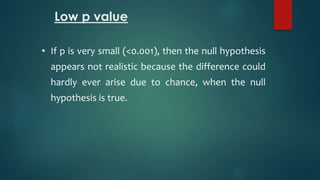
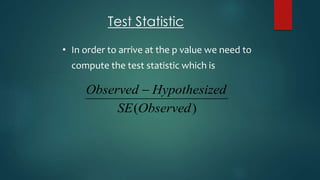

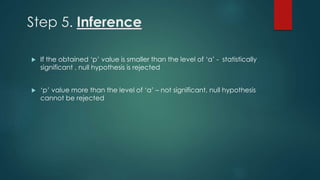


This document discusses p-values and their significance in statistical hypothesis testing. It defines a p-value as the probability of obtaining a result equal to or more extreme than what was observed assuming the null hypothesis is true. Lower p-values indicate stronger evidence against the null hypothesis. The document outlines the steps in hypothesis testing which include stating hypotheses, determining acceptable type I and type II error rates, selecting a statistical test to calculate a test statistic, determining the p-value, making inferences, and forming conclusions. It emphasizes that statistical significance does not necessarily imply real-world significance.